Using Manzan
Manzan is an open-source project designed to simplify the process of publishing IBM i system events to a wide variety of endpoints such as user applications, external resources, and/or open source technologies. Whether you need to monitor system messages, trigger alerts, or consolidate logs for compliance and reporting, Manzan makes it easy to integrate IBM i with the rest of your IT environment.
Understanding the Architecture
The architecture of Manzan is best understood by first exploring two core components: Inputs and Destinations.
-
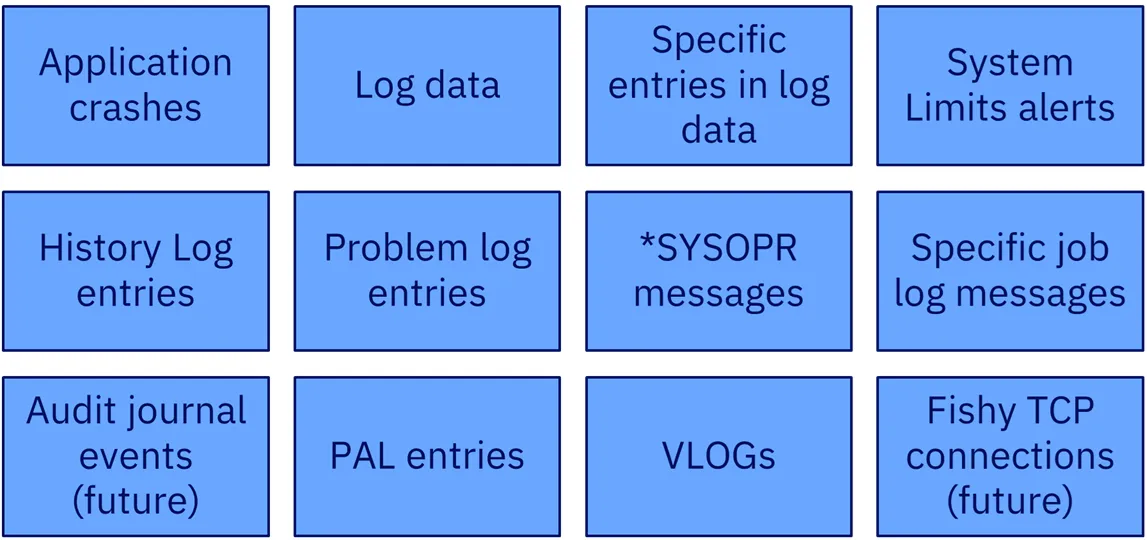
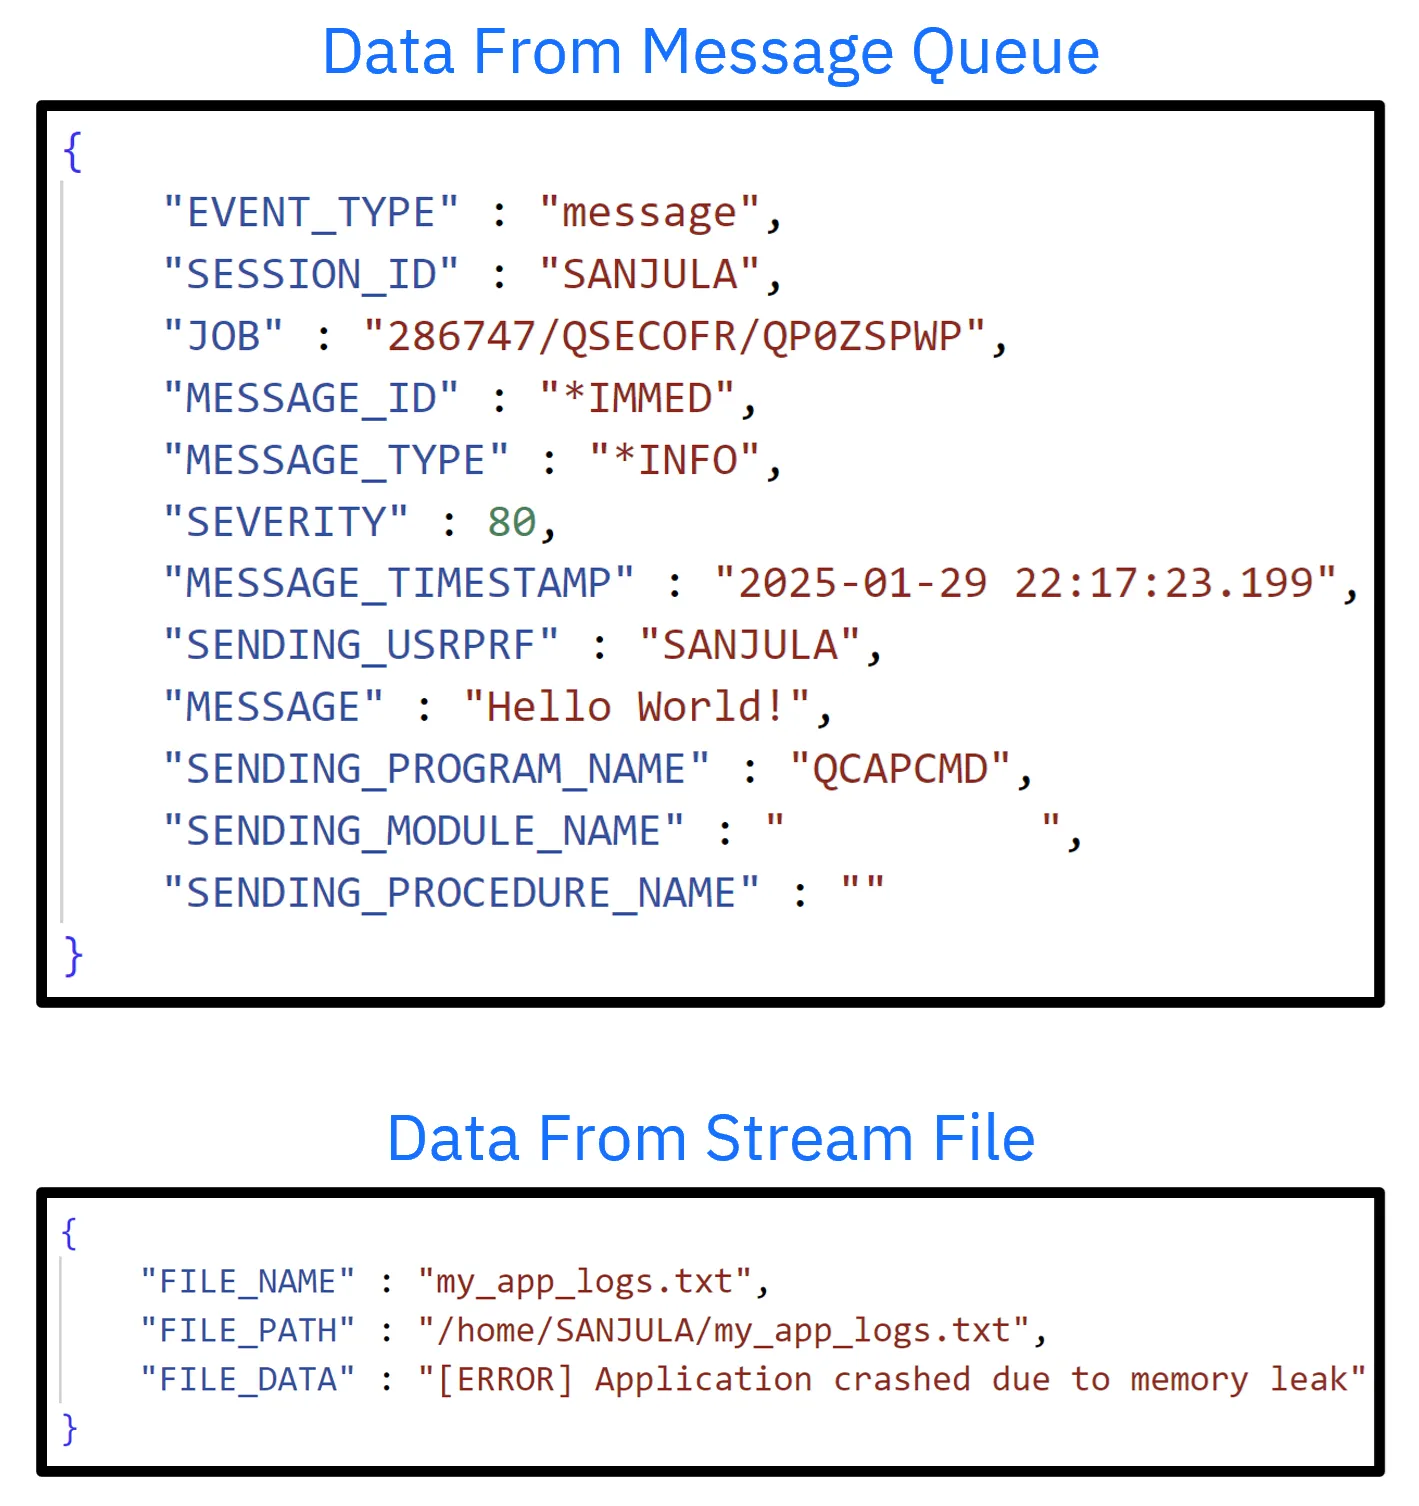
Inputs are the sources of your data. In its most simplistic form, this could be a stream file which you would like to monitor. However, an input can also involve using the system watch facility which is a powerful yet underutilized tool built into the IBM i. This tool uses the STRWCH command to start the watch for event function which calls a specified program when a specified event occurs. This means that your inputs can be a message on a message queue, a Licensed Internal Code (LIC) log entry or a Product Activity Log (PAL) entry.
-
Destinations are the locations you would like to send your data to. One option is to retrieve the data using your own custom ILE code, but in most cases you will want to use one of the many supported destinations based on your use case:
- HTTP/HTTPS endpoints (REST, etc)
- Email (SMTP/SMTPS)
- SMS (via Twilio)
- Slack
- FluentD
- Kafka
- Sentry
- Grafana Loki
- Google Pub/Sub
- ActiveMQ
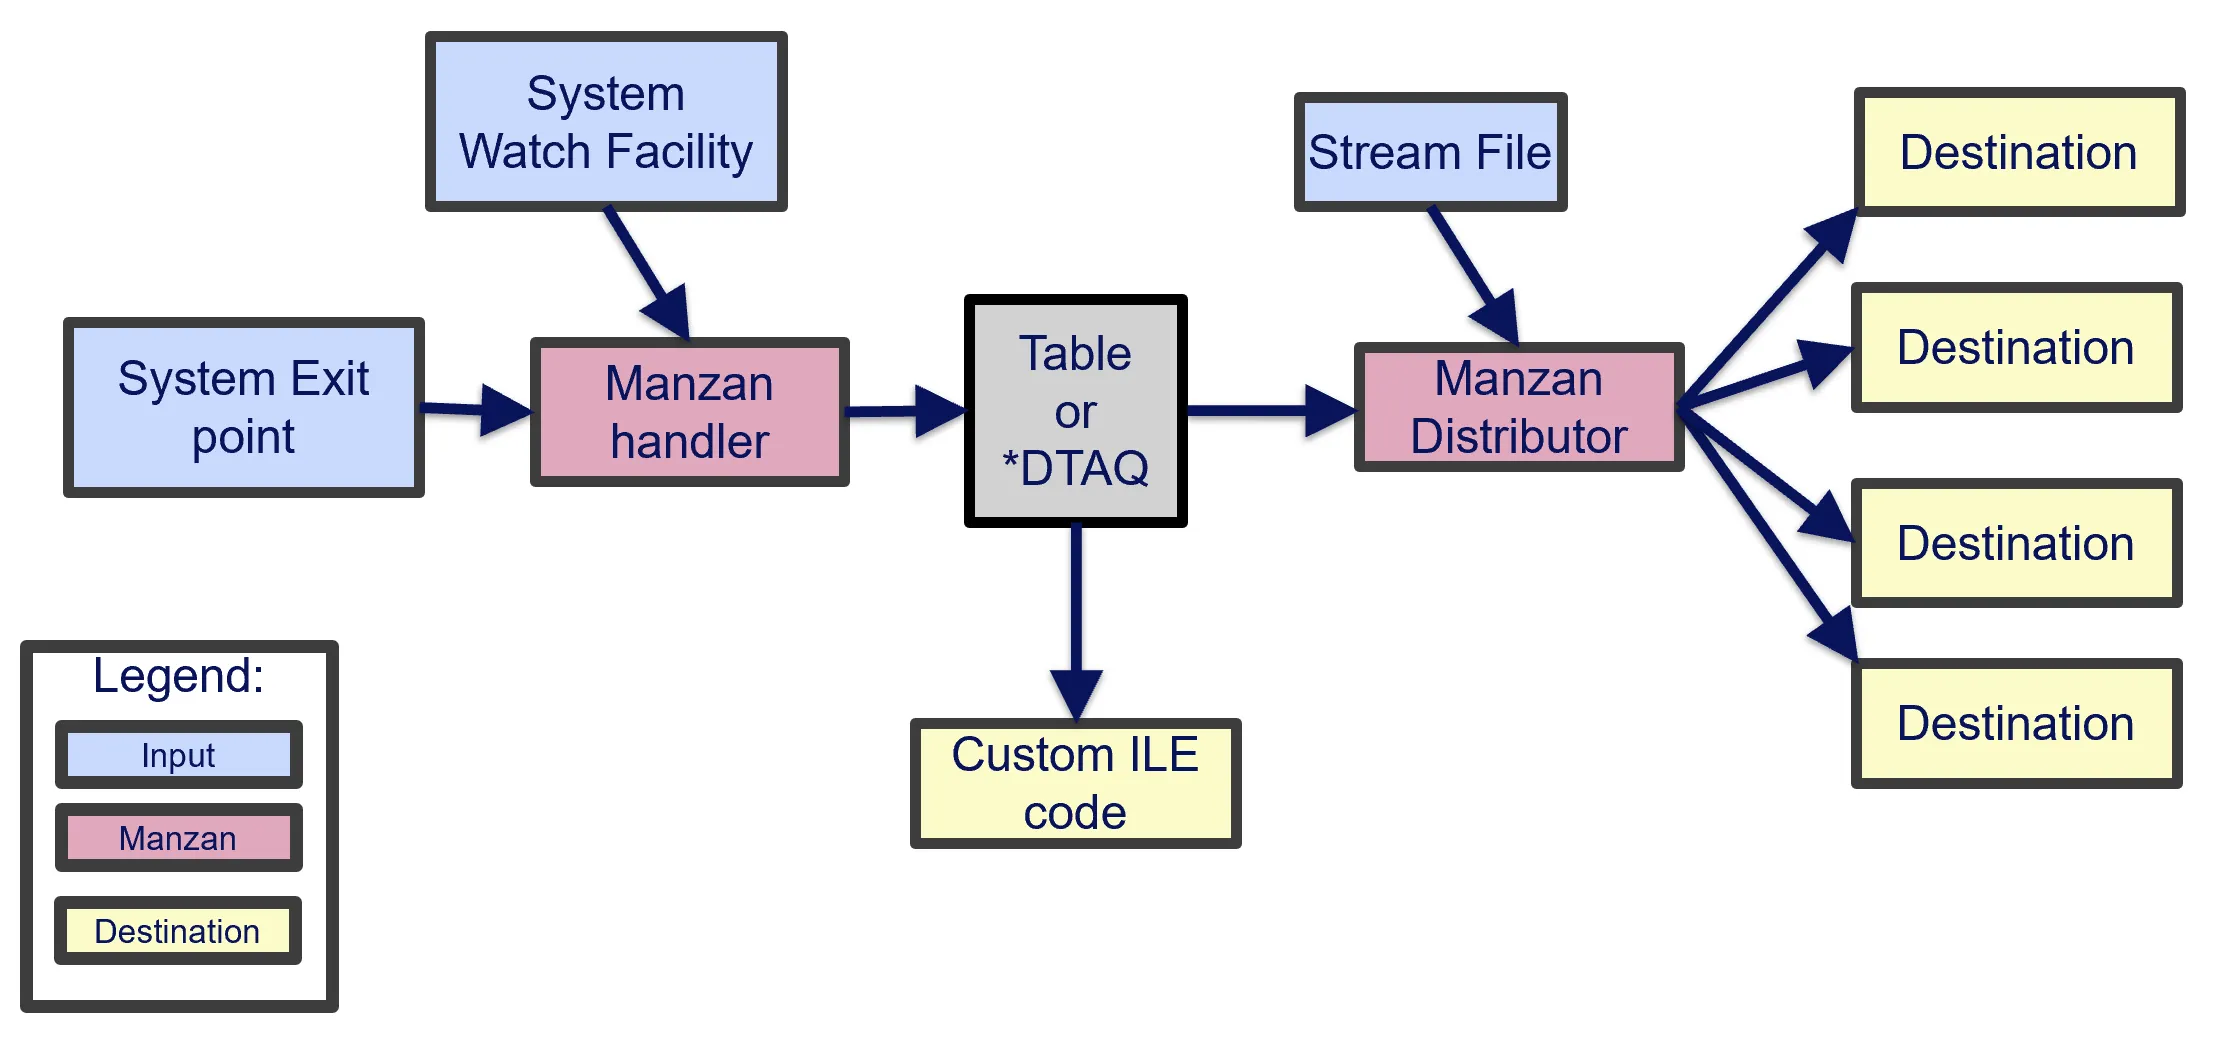
Manzan is the gateway that bridges your inputs and destinations. It itself consists of two core components: Handler and Distributor.
- The handler is what receives and handles your inputs if they are a system watch or exit point event. It does this by first starting all the system watches and then transforming the data into a usable format and lastly placing it on a table or data queue when an event is detected. So how does it know what your inputs are? Well, you will define a configuration file (
data.ini) that contains this information. - The distributor is what sends your data to its ultimate destination using the power of Apache Camel, the swiss army knife of integration. This component will retrieve data off the table or data queue and then feed that to your chosen destinations. Similar to the handler, you will define a configuration file (
dests.ini) that outlines what these destinations are.
Configuring Inputs and Destinations
Configuring Manzan is made easy with the help of a few configuration files that will be located in /QOpenSys/etc/manzan/. These configuration files each follow an ini file format and are structured to make it easy to add and remove both inputs and destinations in minutes. Rather than having to know different protocols for each new tool that you would like to integrate, you will simply need to update these standard files.
-
app.ini: This file will contain some information that specifies the library containing an ILE component necessary for Manzan to function. In most cases, this file can remain untouched. -
data.ini: This file will outline your inputs in a simple format. These will each have a unique ID and a type assigned based on if you are watching a stream file, message queue, etc. This is where you will also mapping your inputs to your destinations.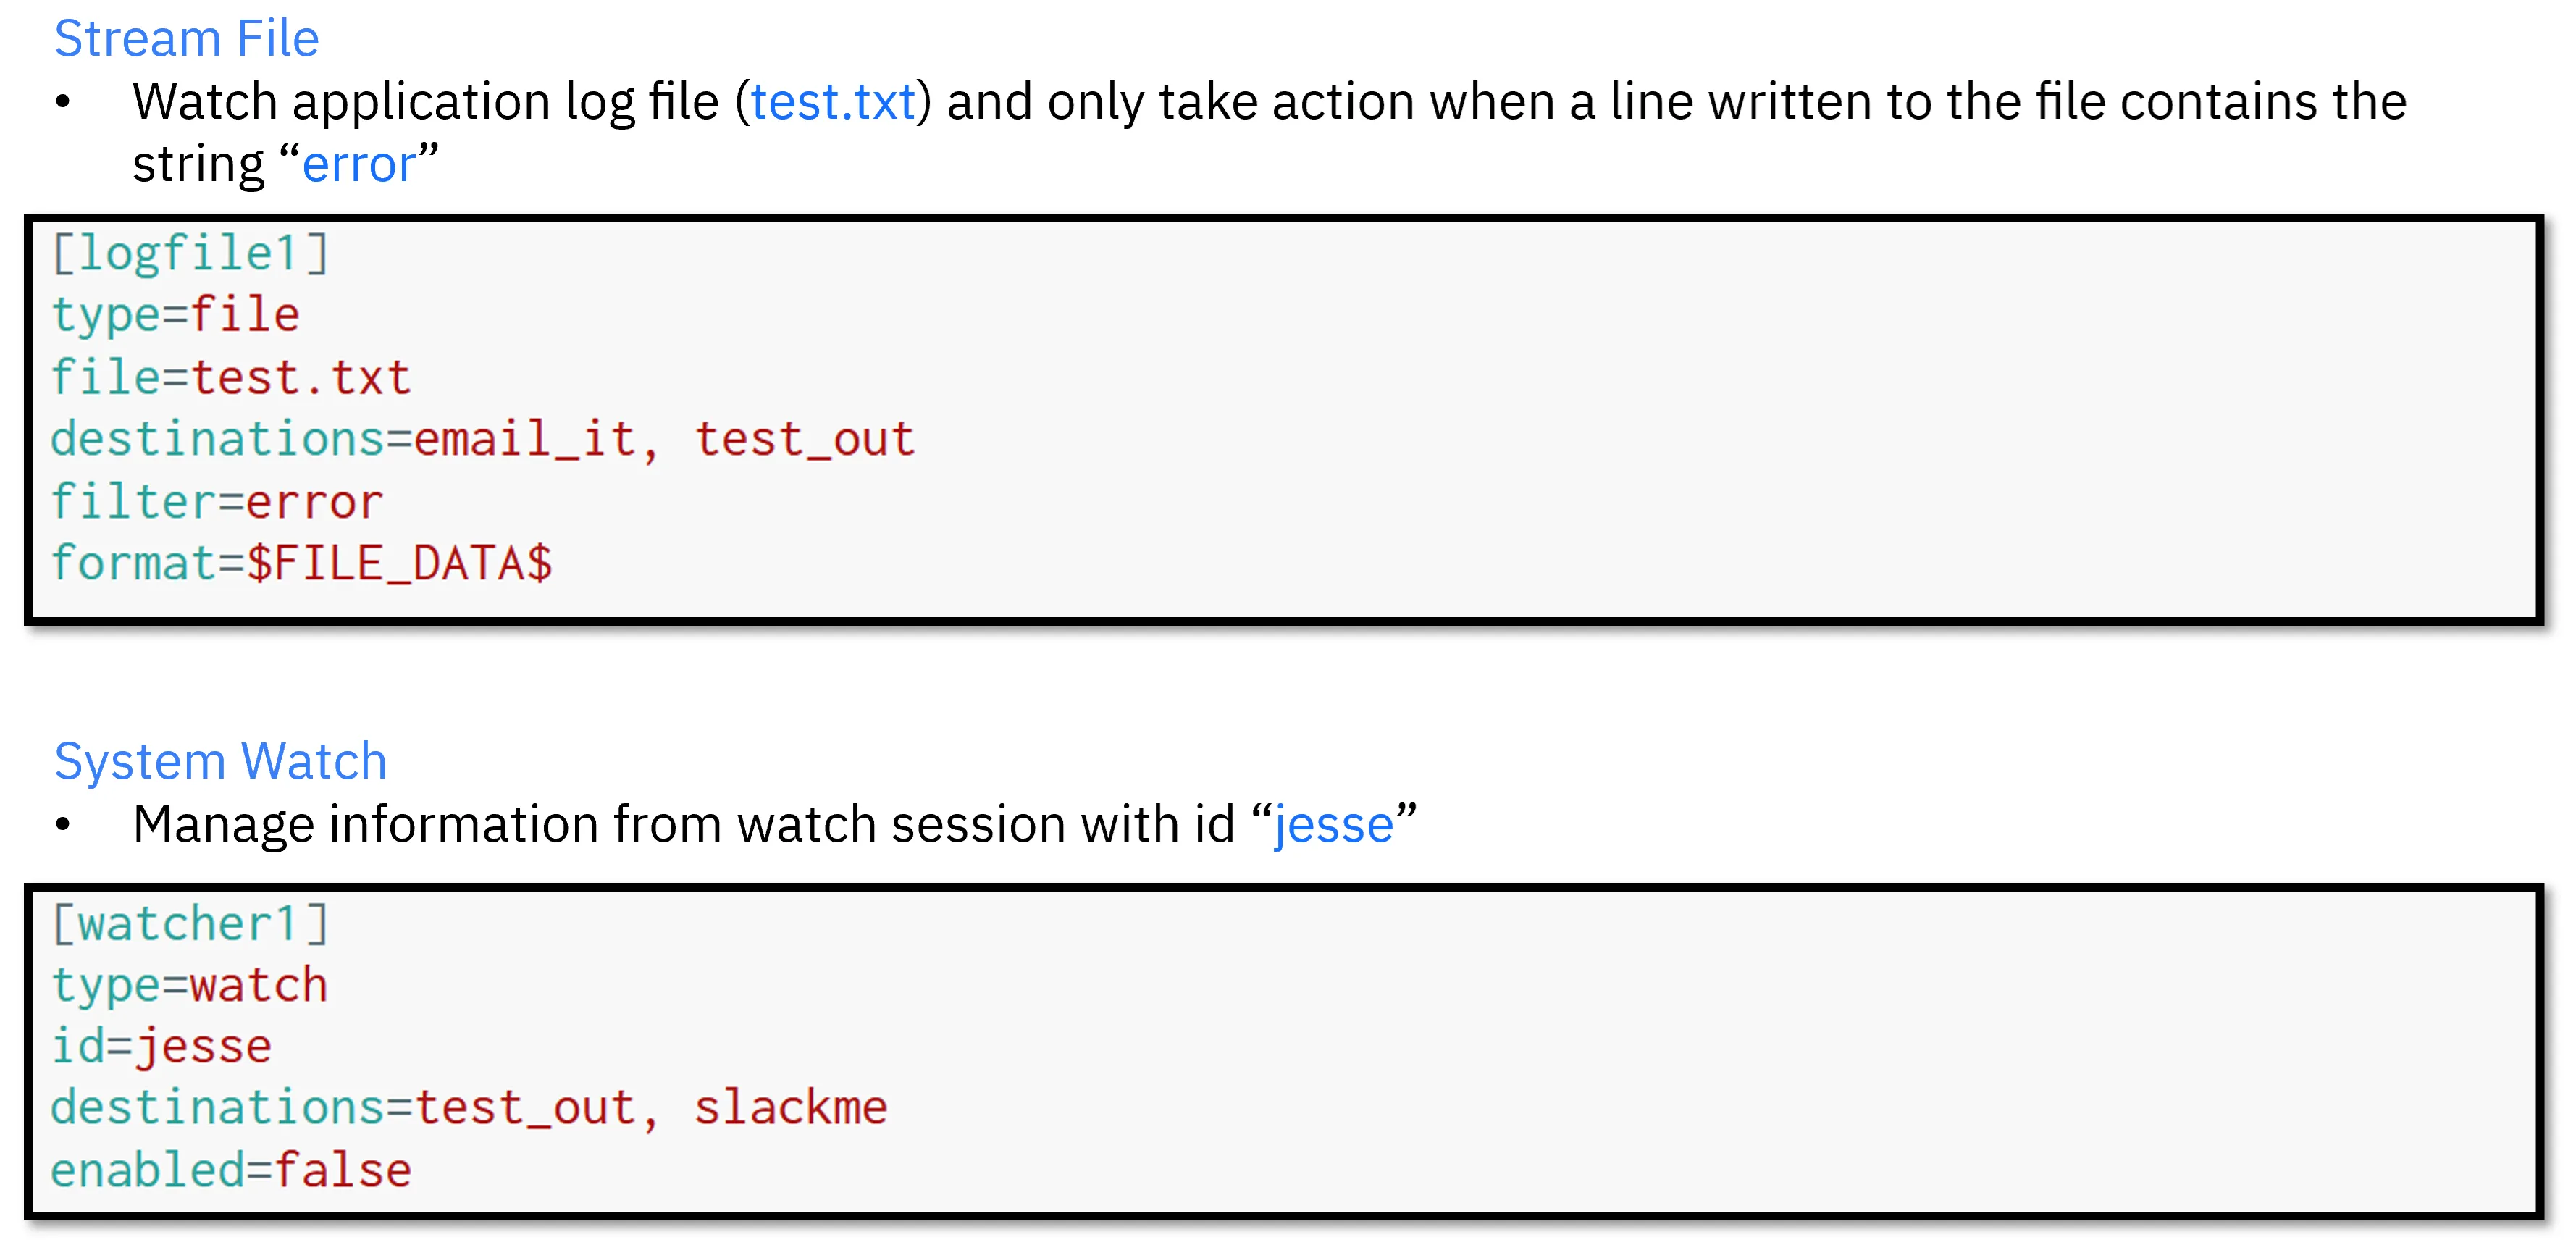
-
dests.ini: This file will outline your destinations also with its own unique ID. Based on where you would like to send your data, you will need to specify some required properties such as credentials.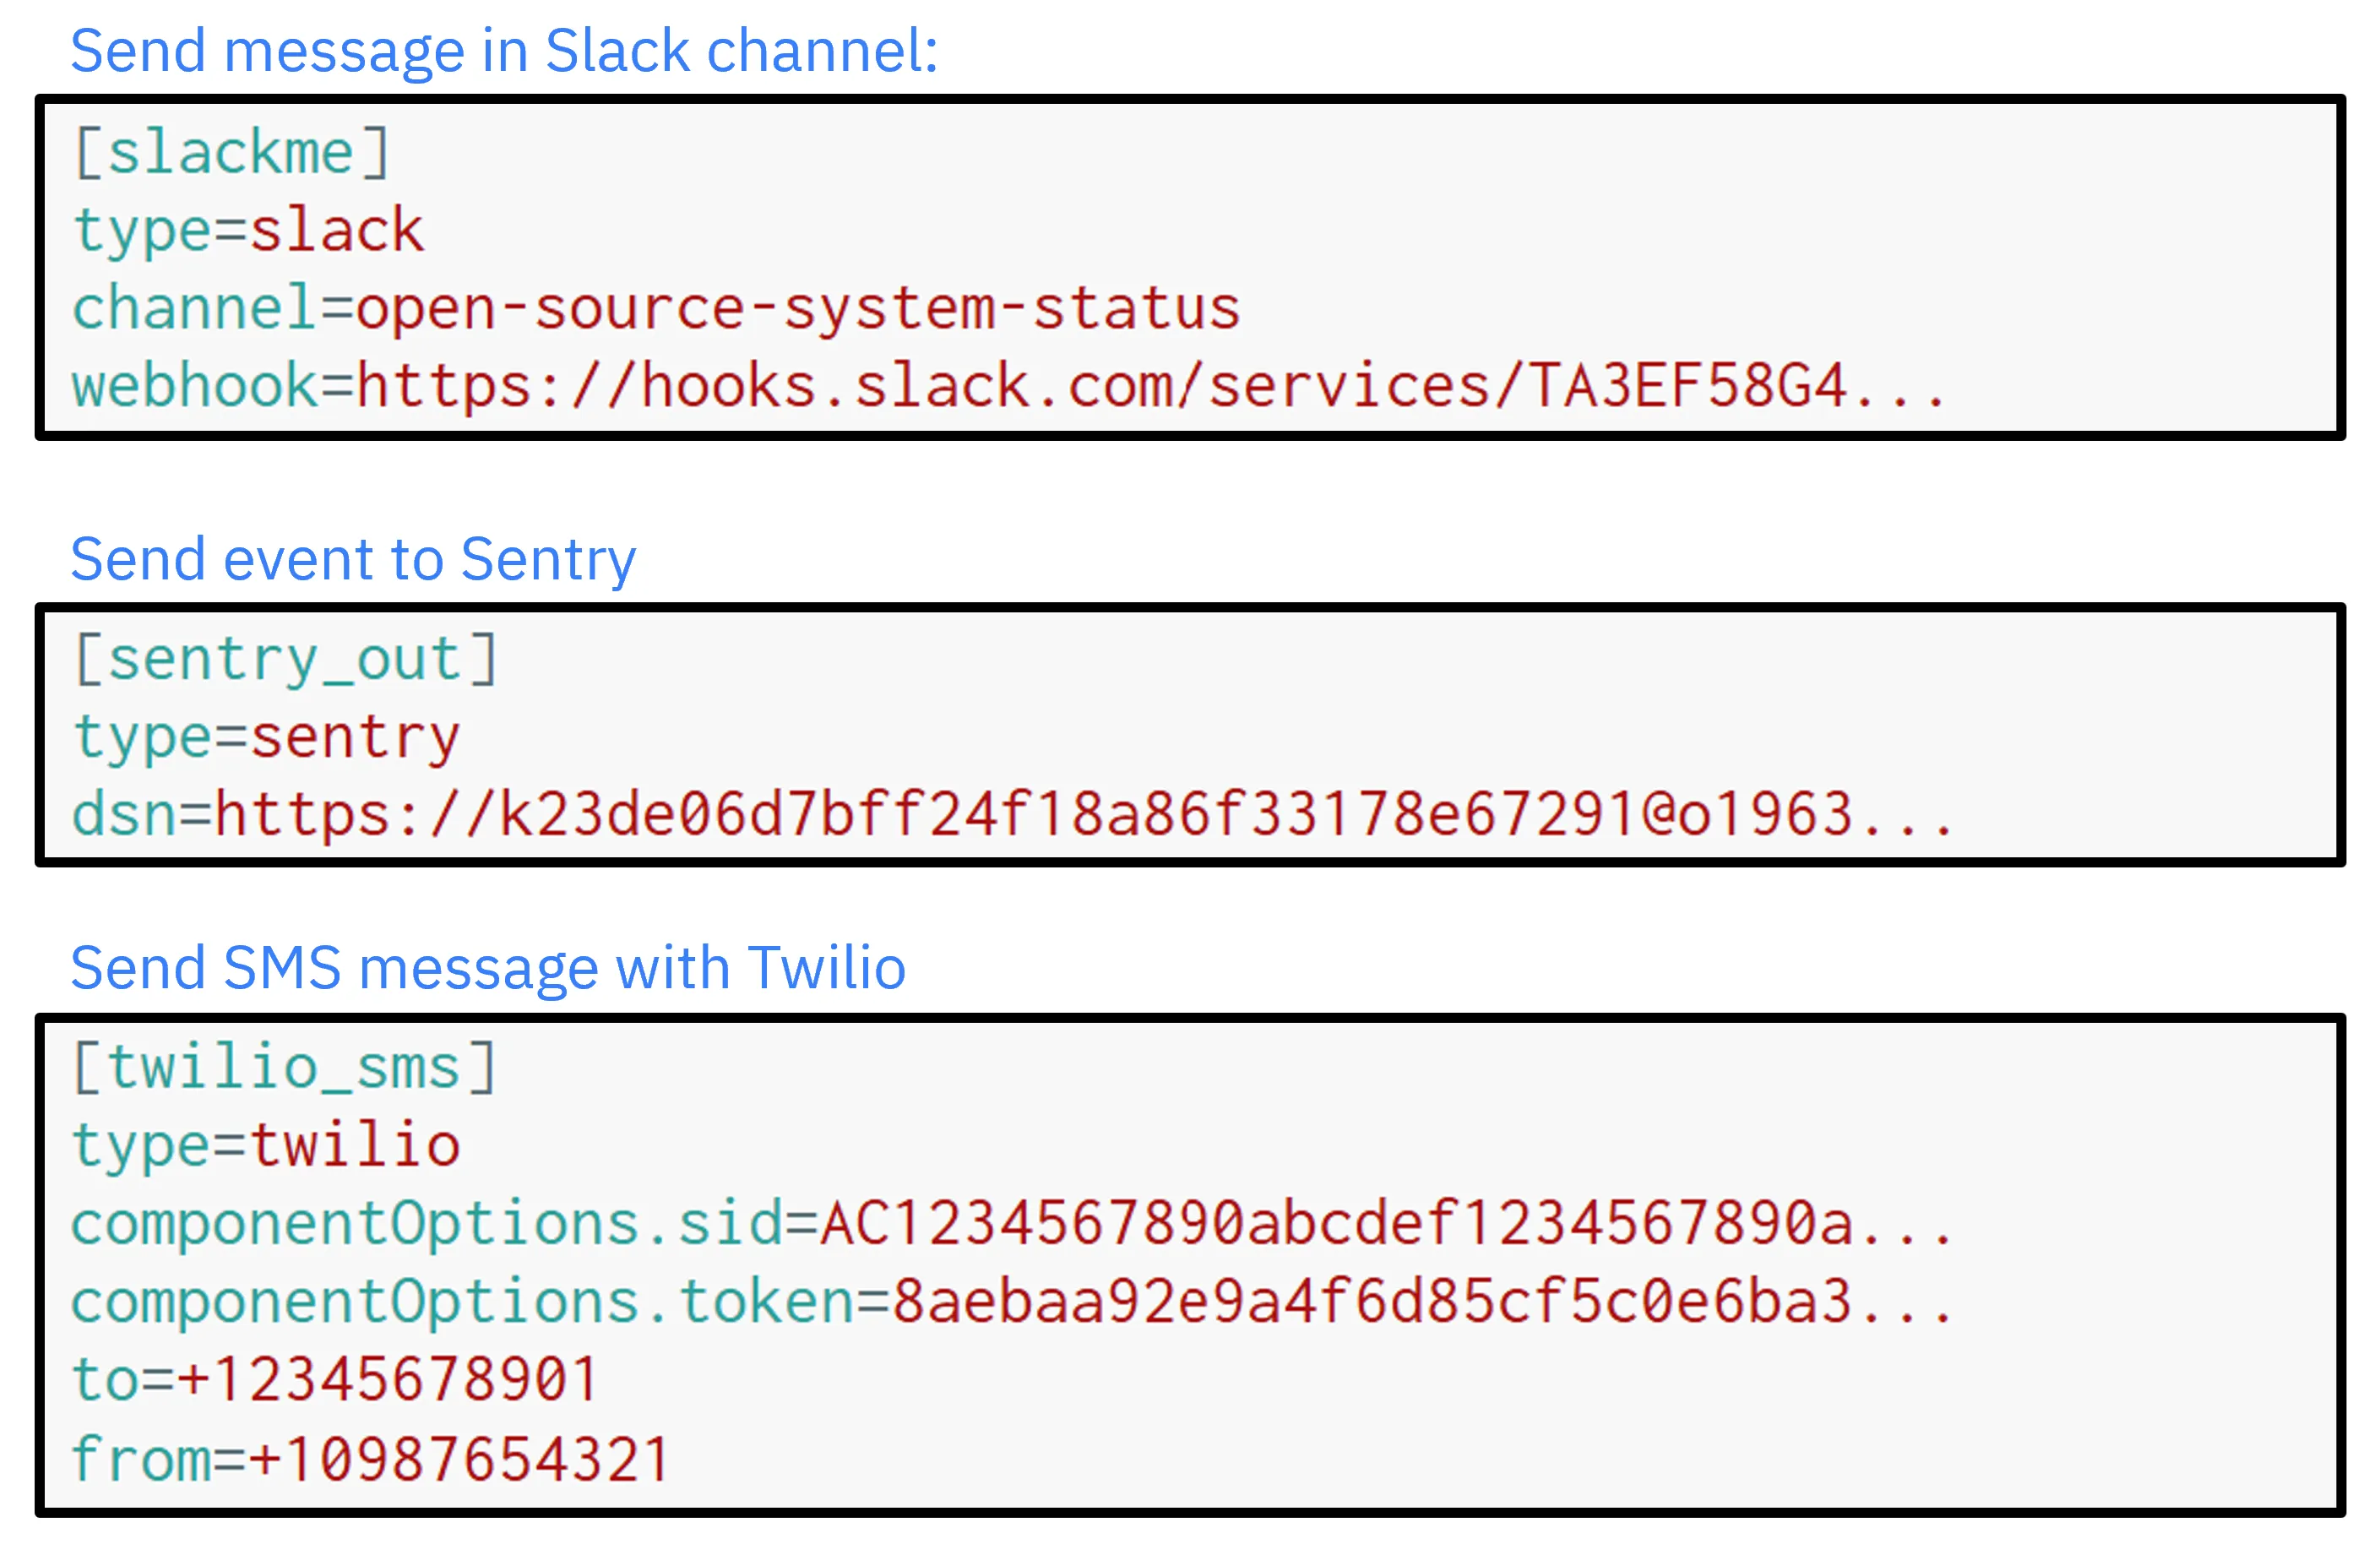
Sending Messages to Slack
Slack is an awesome collaboration tool for keeping teams up to date. With Manzan, this can include keeping them updated on the status of an application running on IBM i. In this first example, let’s take a look at how you can get Slack updates on an IBM i application as it dumps error logs into a stream file.
To be able to send messages into a Slack channel, you will need to first create a Slack app using the following steps:
- Navigate to the Slack Apps website.
- Click
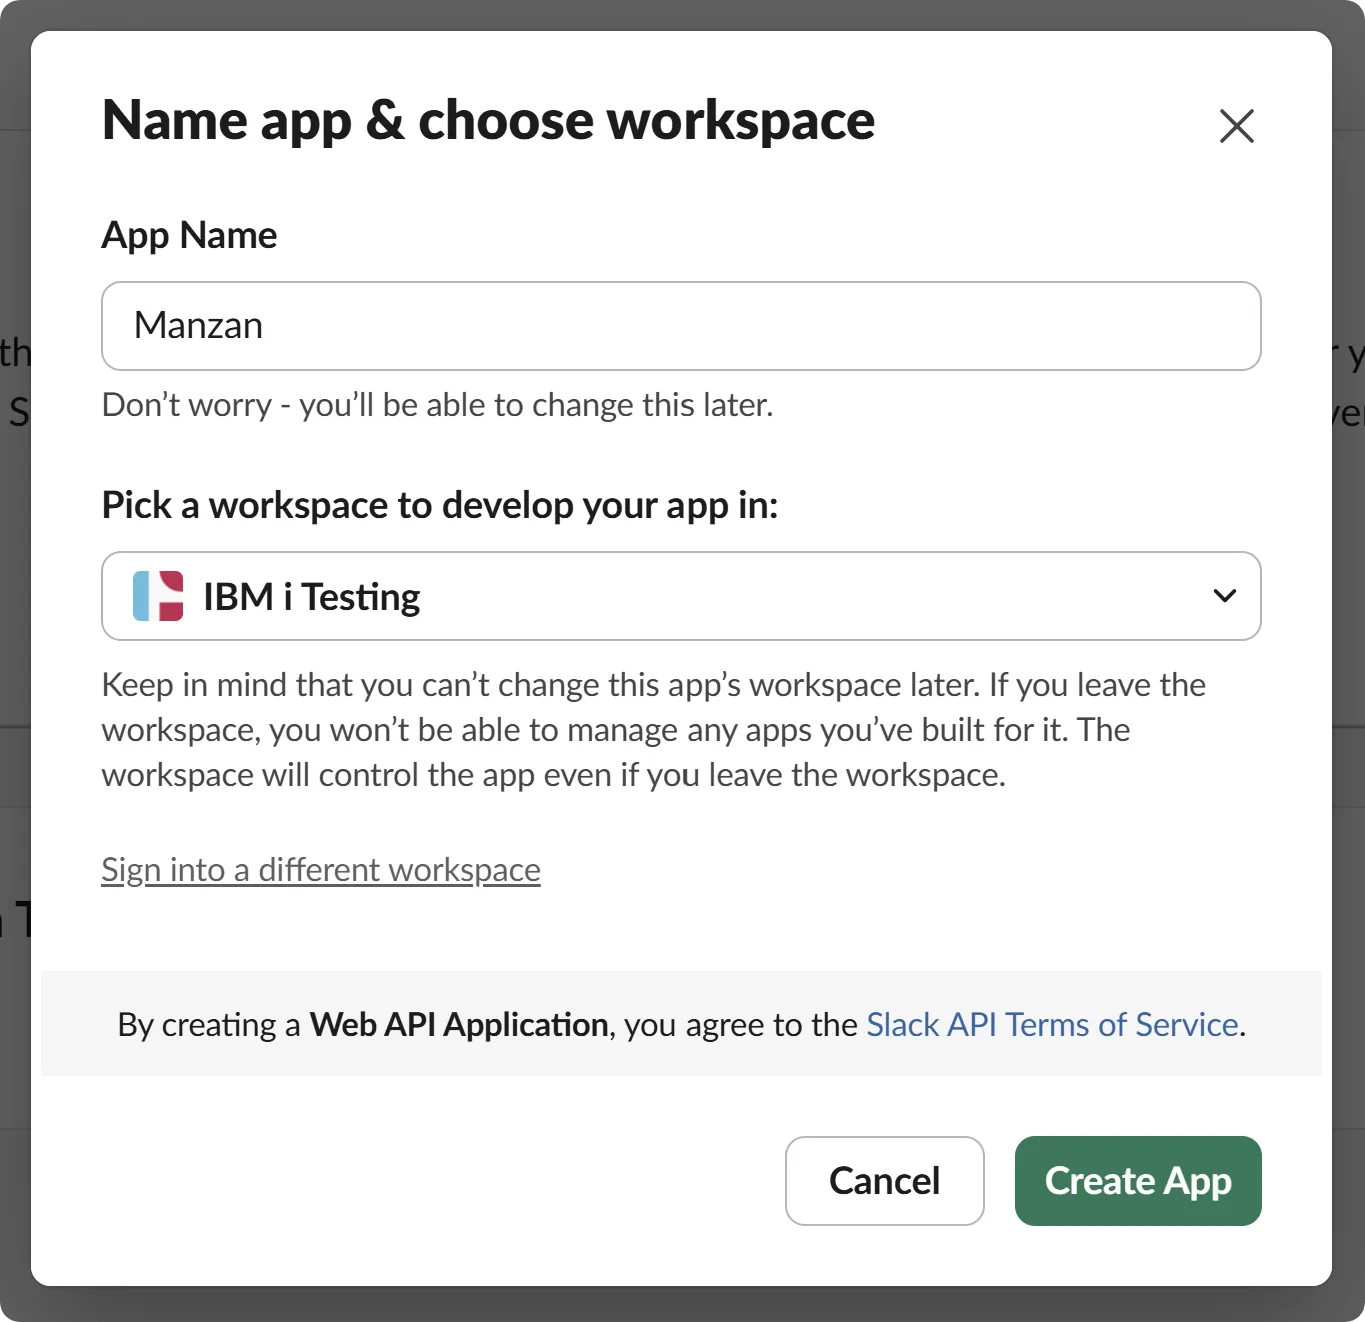
Create an Appand selectFrom scratch. - Give your app a name, select a workspace, and click
Create App.
Next, you will need to create an incoming webhook for your newly create Slack App to post messages into a channel:
- Navigate to the
Incoming Webhookssection under theFeaturesheading. - Toggle the feature on to activate incoming webhooks and click
Add New Webhook to Workspace. - Select the Slack channel you would like to receive updates in and click
Allow. - Copy the generated webhook URL and keep it handy. It will look something like
https://hooks.slack.com/services/....
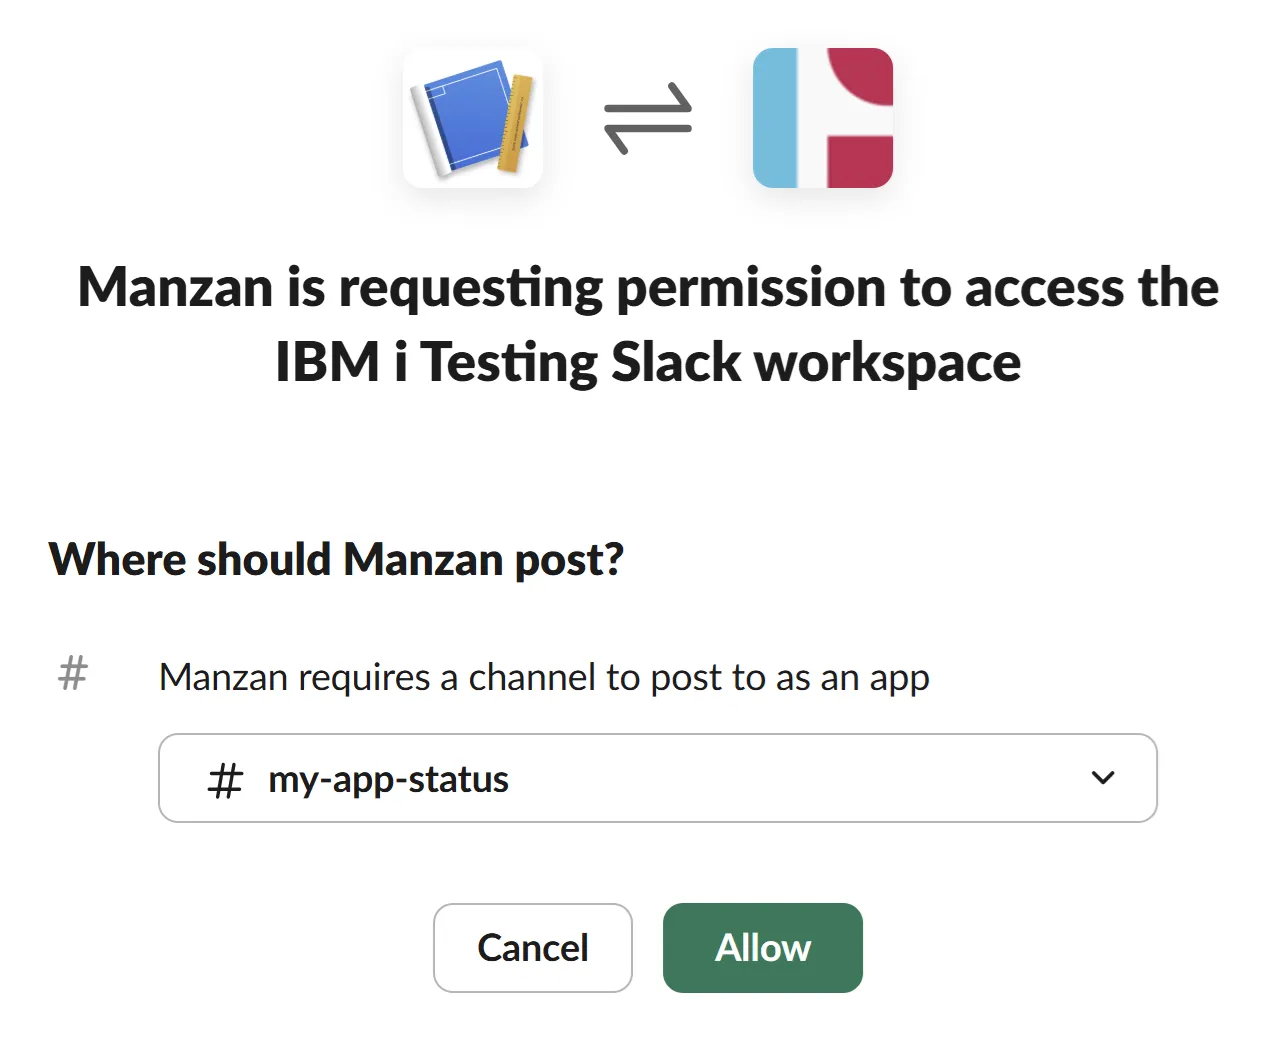
In my case, I created a Slack App named Manzan, gave it access to my IBM i Testing workspace, and gave it access to a channel named my-app-status.
Now that you have a working Slack app, you just need to update the Manzan configuration files for it to start posting messages. Let’s start by adding a new input to the data.ini file:
[file_my_app]type=filefile=/tmp/my-app-log.txtdestinations=slack_outfilter=ERROR:format=$FILE_DATA$So, what exactly did you do here? Well let’s pause and review what each of these lines are doing:
[file_my_app]: Assignsfile_my_appas the unique ID for this input.type: Specifies this input to be of typefilesince you want to monitor a stream file.file: Specifies the path to the file you want to watch. In this case, it is the application’s log file.destinations: Specifiesslack_outas the destination to send this data to. This same ID will be defined intodests.ini.filter: Since you do not want Slack updates for every log message, you can define a filter to only listen for lines that includeERROR:.format: Defines the format in which the data should be sent in. If not specified, all information will be sent. In this case, you are only interested in the log message itself so you can use the special key$FILE_DATA$to get back just the file content. All possible keys are listed here.
Now the last step is to add a new destination to the dests.ini file:
[slack_out]type=slackchannel=my-app-statuswebhook=https://hooks.slack.com/services/...Again, let’s review each of these lines:
[slack_out]: Assignsslack_outas the unique ID for this destination. This is the same ID you used previously in thedestinationsfield ofdests.ini.type: Specifies this destination to be of typeslackwhich is the predefined type for Slack. All possible types are listed here.channel: Specifies the channel which you assigned your Slack app to post in.webhook: Specifies the webhook URL which you generated earlier.
Now you can go ahead and start up Manzan using Service Commander. With Manzan now running, you can observe that whenever a message is added to the application’s log file, it will also post the message in your Slack channel.
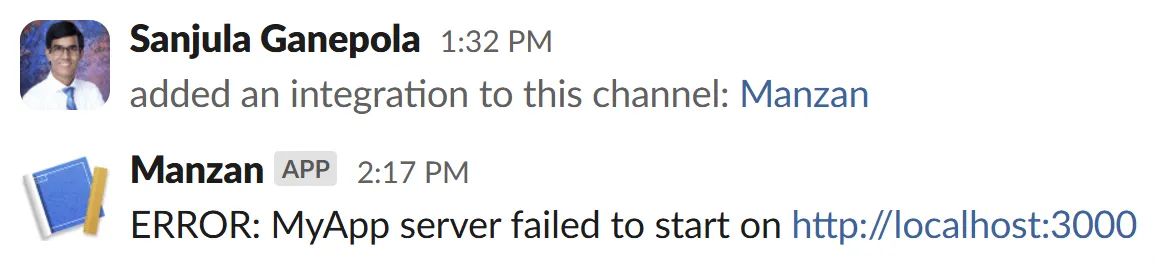
In my case, the Manzan Slack App posted a message in the my-app-status channel when my application logged an error due to failure to start its REST server.
Ingesting Logs into Grafana Loki
Now that we have gone over a basic example, let’s take a look at a more complicated one involving Grafana Loki. Keep in mind that while this example is more involved in terms of setting up Grafana Loki, the steps to setup Manzan itself using the same configuration files are exactly the same.
For those who have not heard of Grafana Loki, it is a log aggregation system used for ingesting logs and processing queries. With these application or IT infrastructure logs, Grafana allows you the ability to query and display them using custom designed dashboards. Let’s have a look at how you can watch for messages being adding to the QHST history log’s message queue on IBM i and ingest this data to Grafana Loki.
The steps below assume you have already created a Grafana Loki instance and have the credentials (
url,username, andpassword) for it on hand.
Just like the previous example, the first step is to add a new input to your data.ini file:
[watch_hstlog]type=watchid=sanjuladestinations=loki_outstrwch=WCHMSG((*ALL)) WCHMSGQ((*HSTLOG))format=$MESSAGE_ID$ (severity $SEVERITY$): $MESSAGE$Let’s review again what happened here:
[watch_hstlog]: Assignswatch_hstlogas the unique ID for this input.type: Specifies this input to be of typewatchsince you want to monitor a message queue.id: Assignssanjulaas the session identifier (SSNID) for this watch. This identifier must be unique across all active watches on the IBM i.destinations: Specifiesloki_outas the destination to send this data to. This same ID will be defined intodests.ini.strwch: Specifies additional parameters for theSTRWCHCL command to describe how the watch should be started when Manzan starts up. In this case, you are trying to listen for all messages being added to the history log’s message queue.format: Defines the format in which the data should be sent in. Unlike the previous example, several keys are used here to include more information.
Now that you have an input defined, you then need to add a new destination to the dests.ini file:
[loki_out]type=lokiurl=<loki_url>username=<loki_username>password=<loki_password>Yet again, let’s review each of these lines:
[loki_out]: Assignsloki_outas the unique ID for this destination. This is the same ID you used previously in thedestinationsfield ofdests.ini.type: Specifies this destination to be of typelokiwhich is the predefined type for Grafana Loki.url/username/password: Specifies the credentials to your Grafana Loki instance.
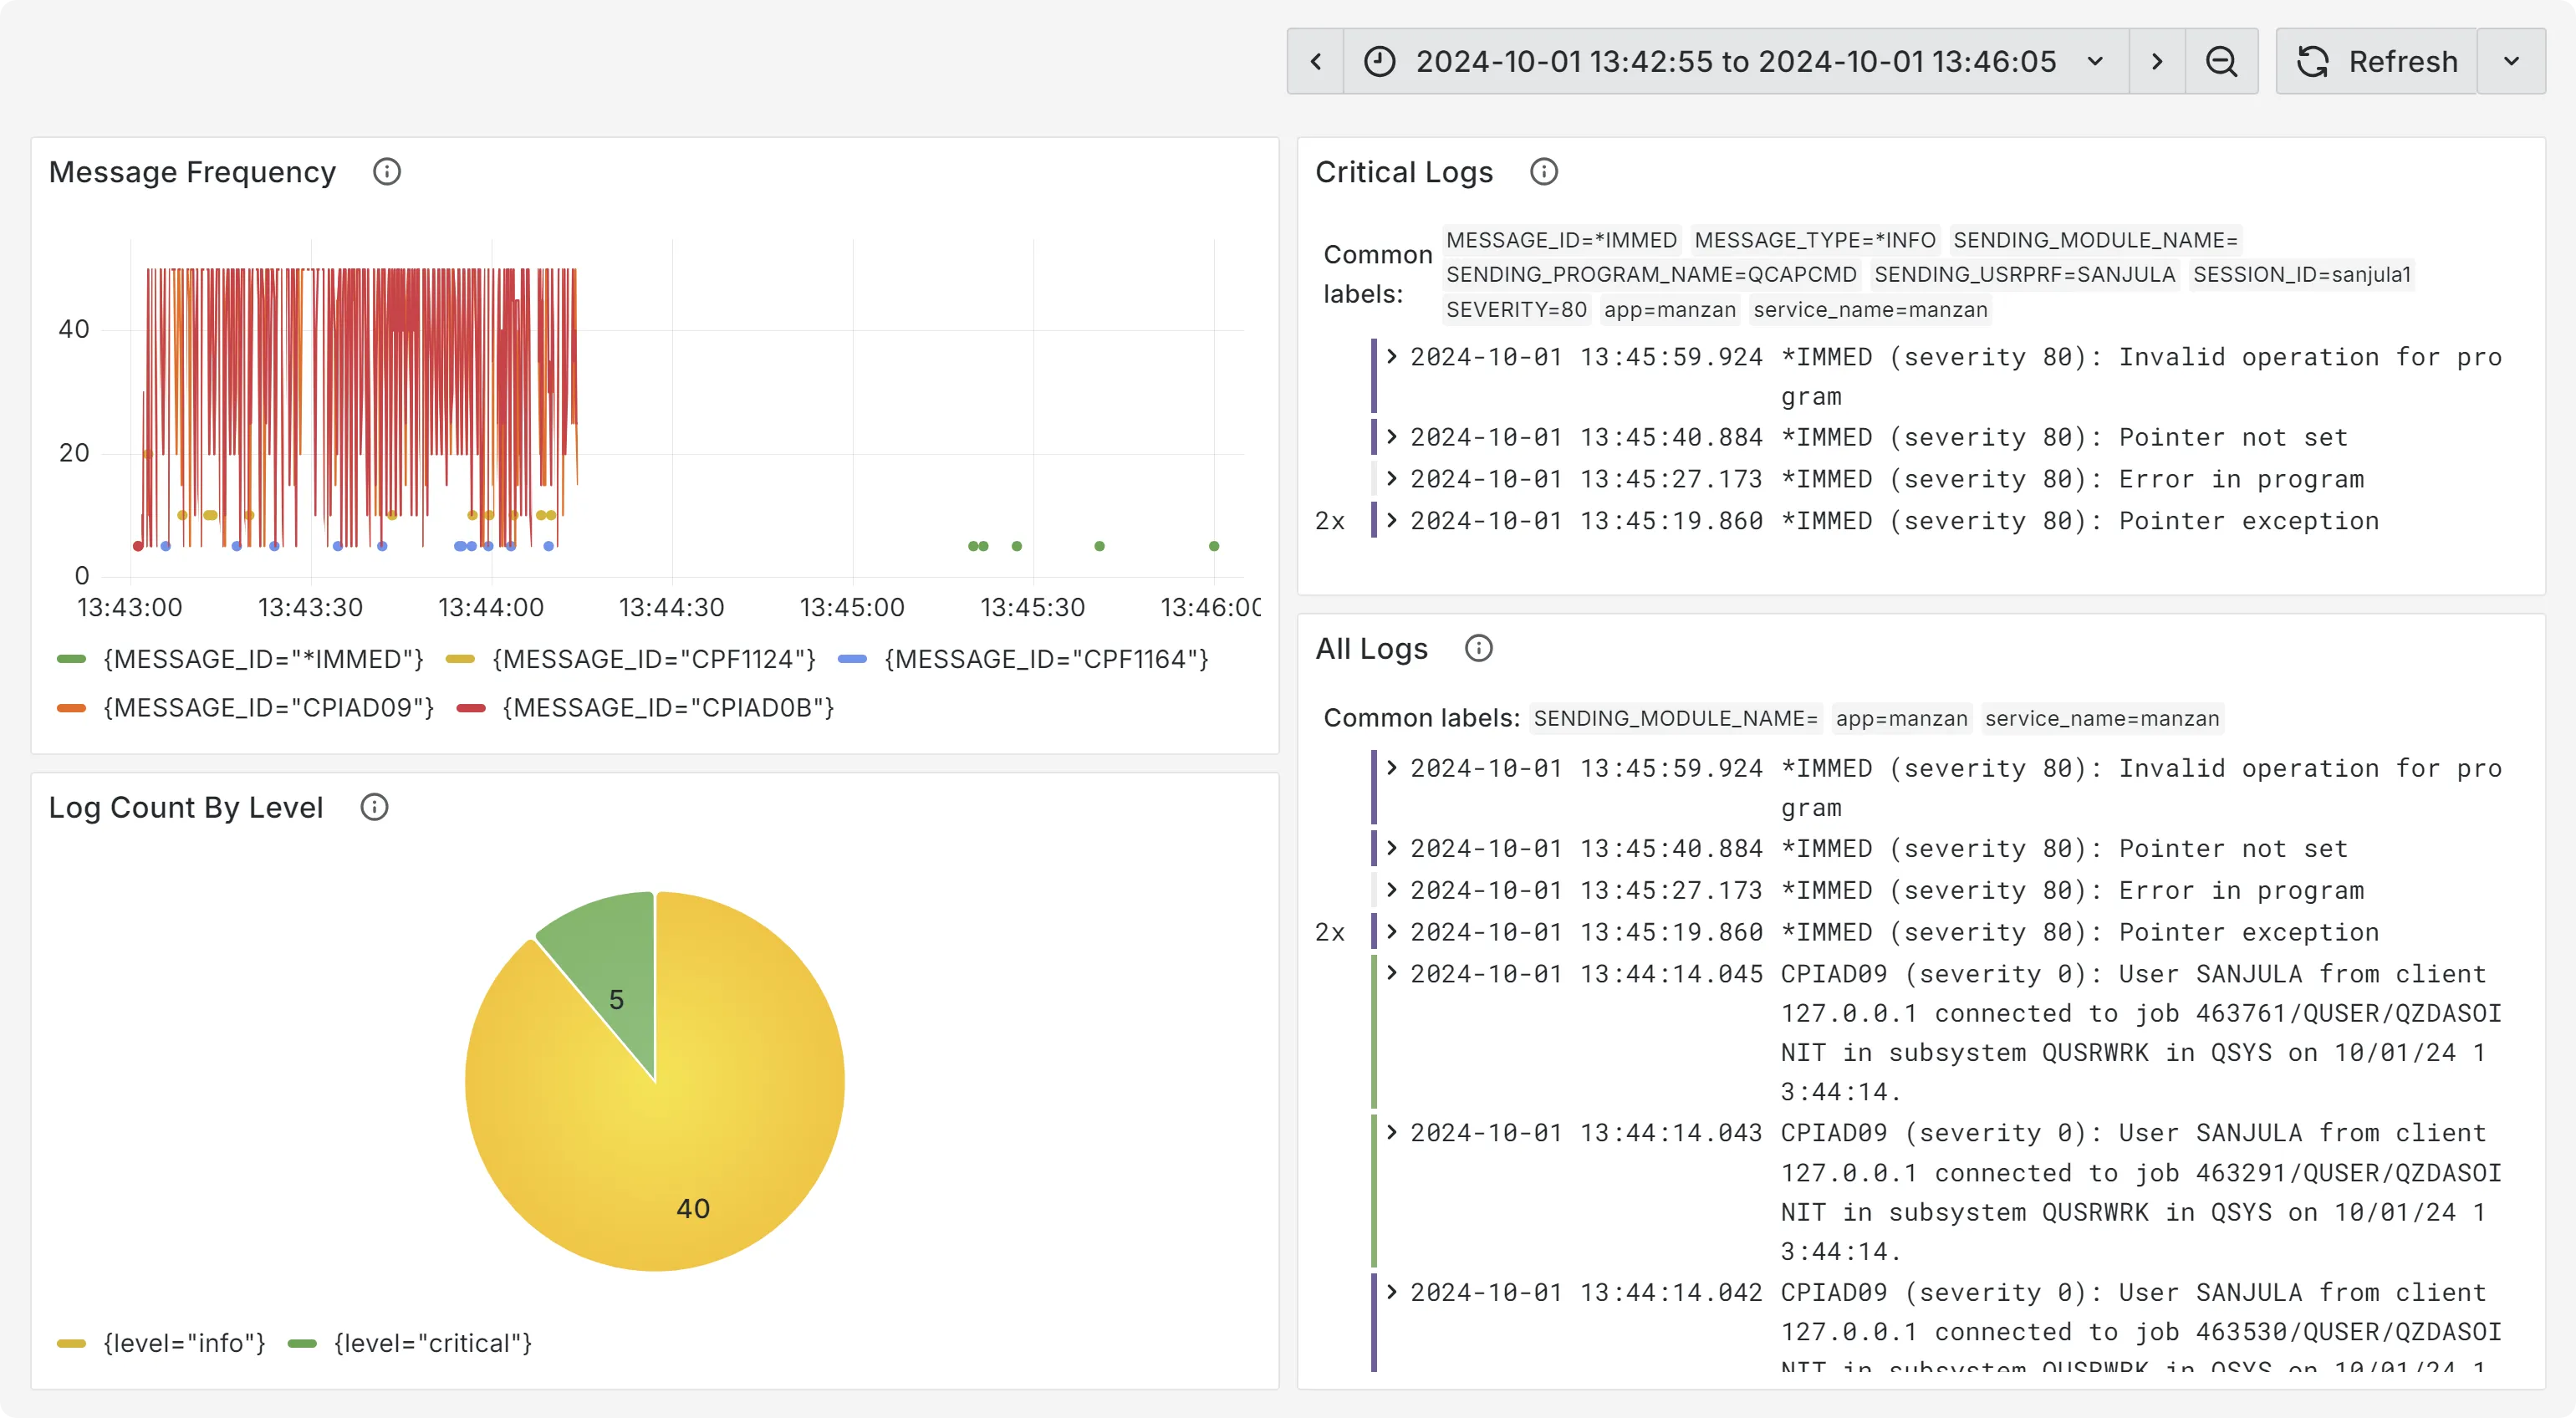
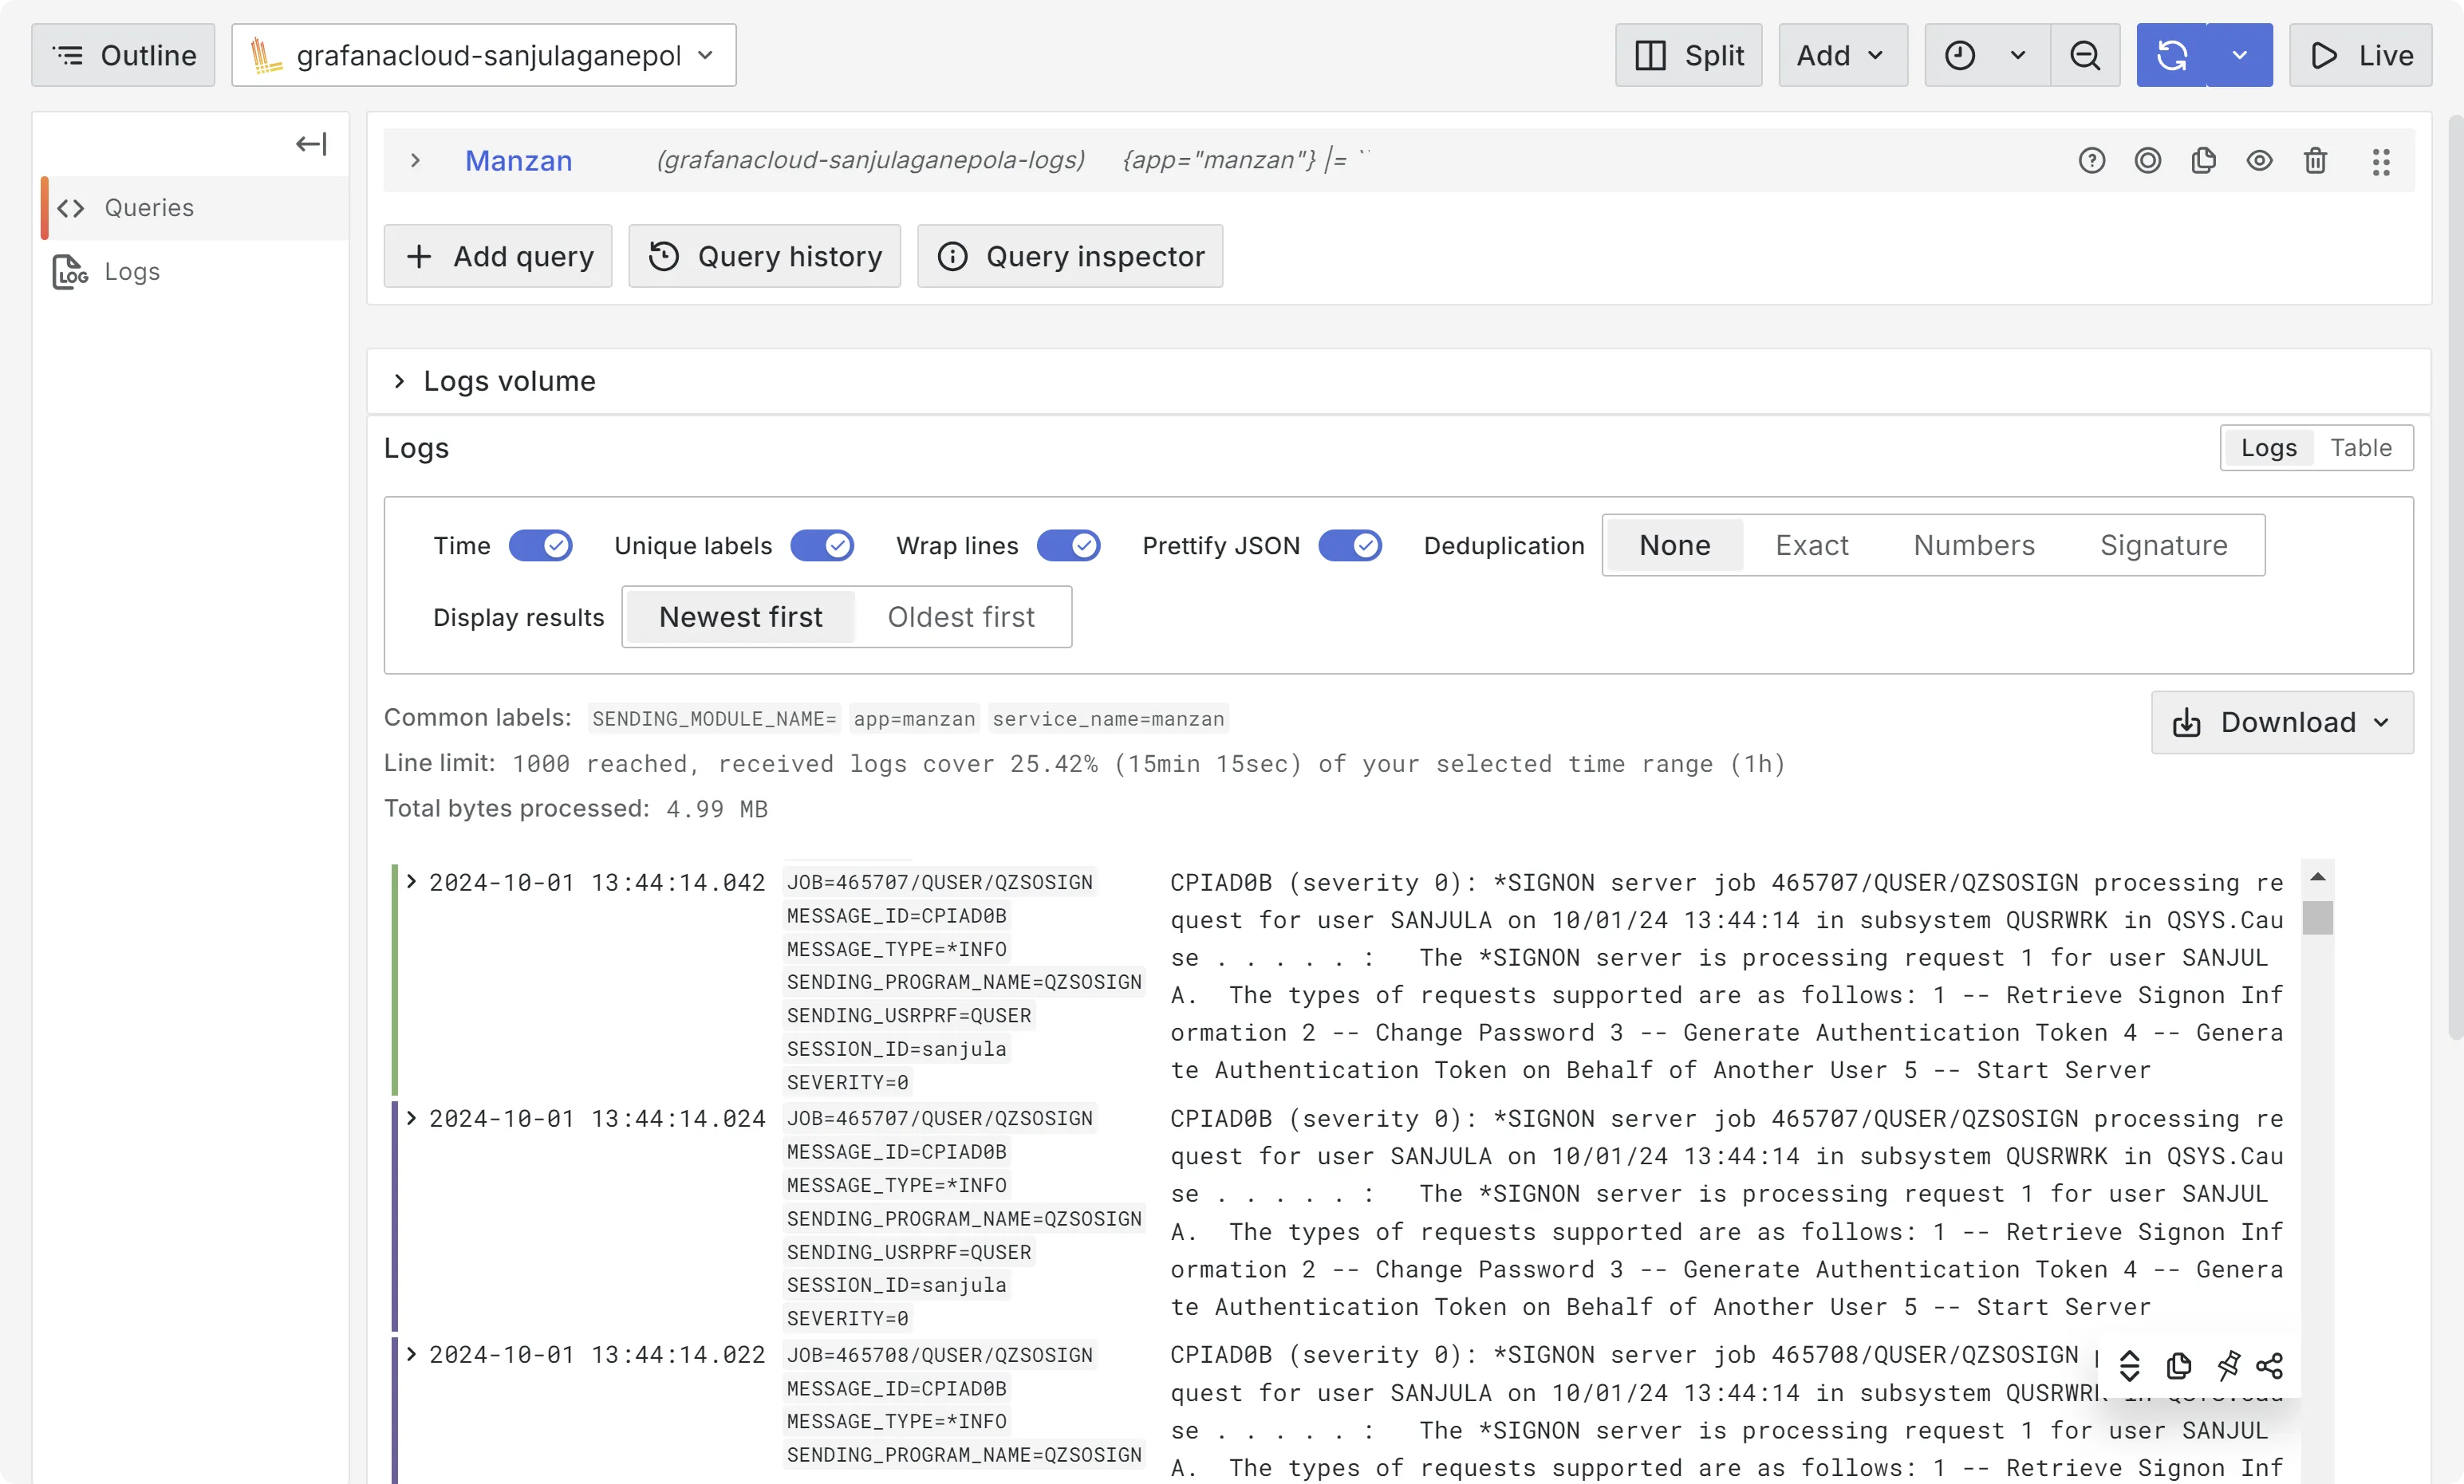
Now you can start up Manzan just like before, but this time observe that whenever a message is added to the history log’s message queue, it is also ingested into Grafana Loki.
Now that you have all these aggregated logs, you can design and build your very own dashboard to visualize this information. The example dashboard below can be used by system admins to quickly monitor message frequency and quickly isolate critical logs.