Environmental-Intelligence-Suite
IBM Environmental Intelligence Suite extension for Custom Geospatial Queries
IBM Environmental Intelligence Suite combines the power of geospatial analytics, alerts and dashboards into a single, modernized user experience. Release 1.0 empowers our customers with basic support for visualizing results of a geospatial query and share their findings operationally through dashboard interactive map.
Action: Contact your IBM representative to get your IBM Environmental Intelligence Suite API_KEY and username | password.
Perform Data Exploration and Experimentation using IBM Environmental Intelligence Suite - Geospatial Analytics Component
Identify Datasets
Log into IBM Environmental Intelligence Suite, navigate to Geospatial Analytics using left-nav menu and use Data Explorer to search for relevant datasets.
Areas of Interest
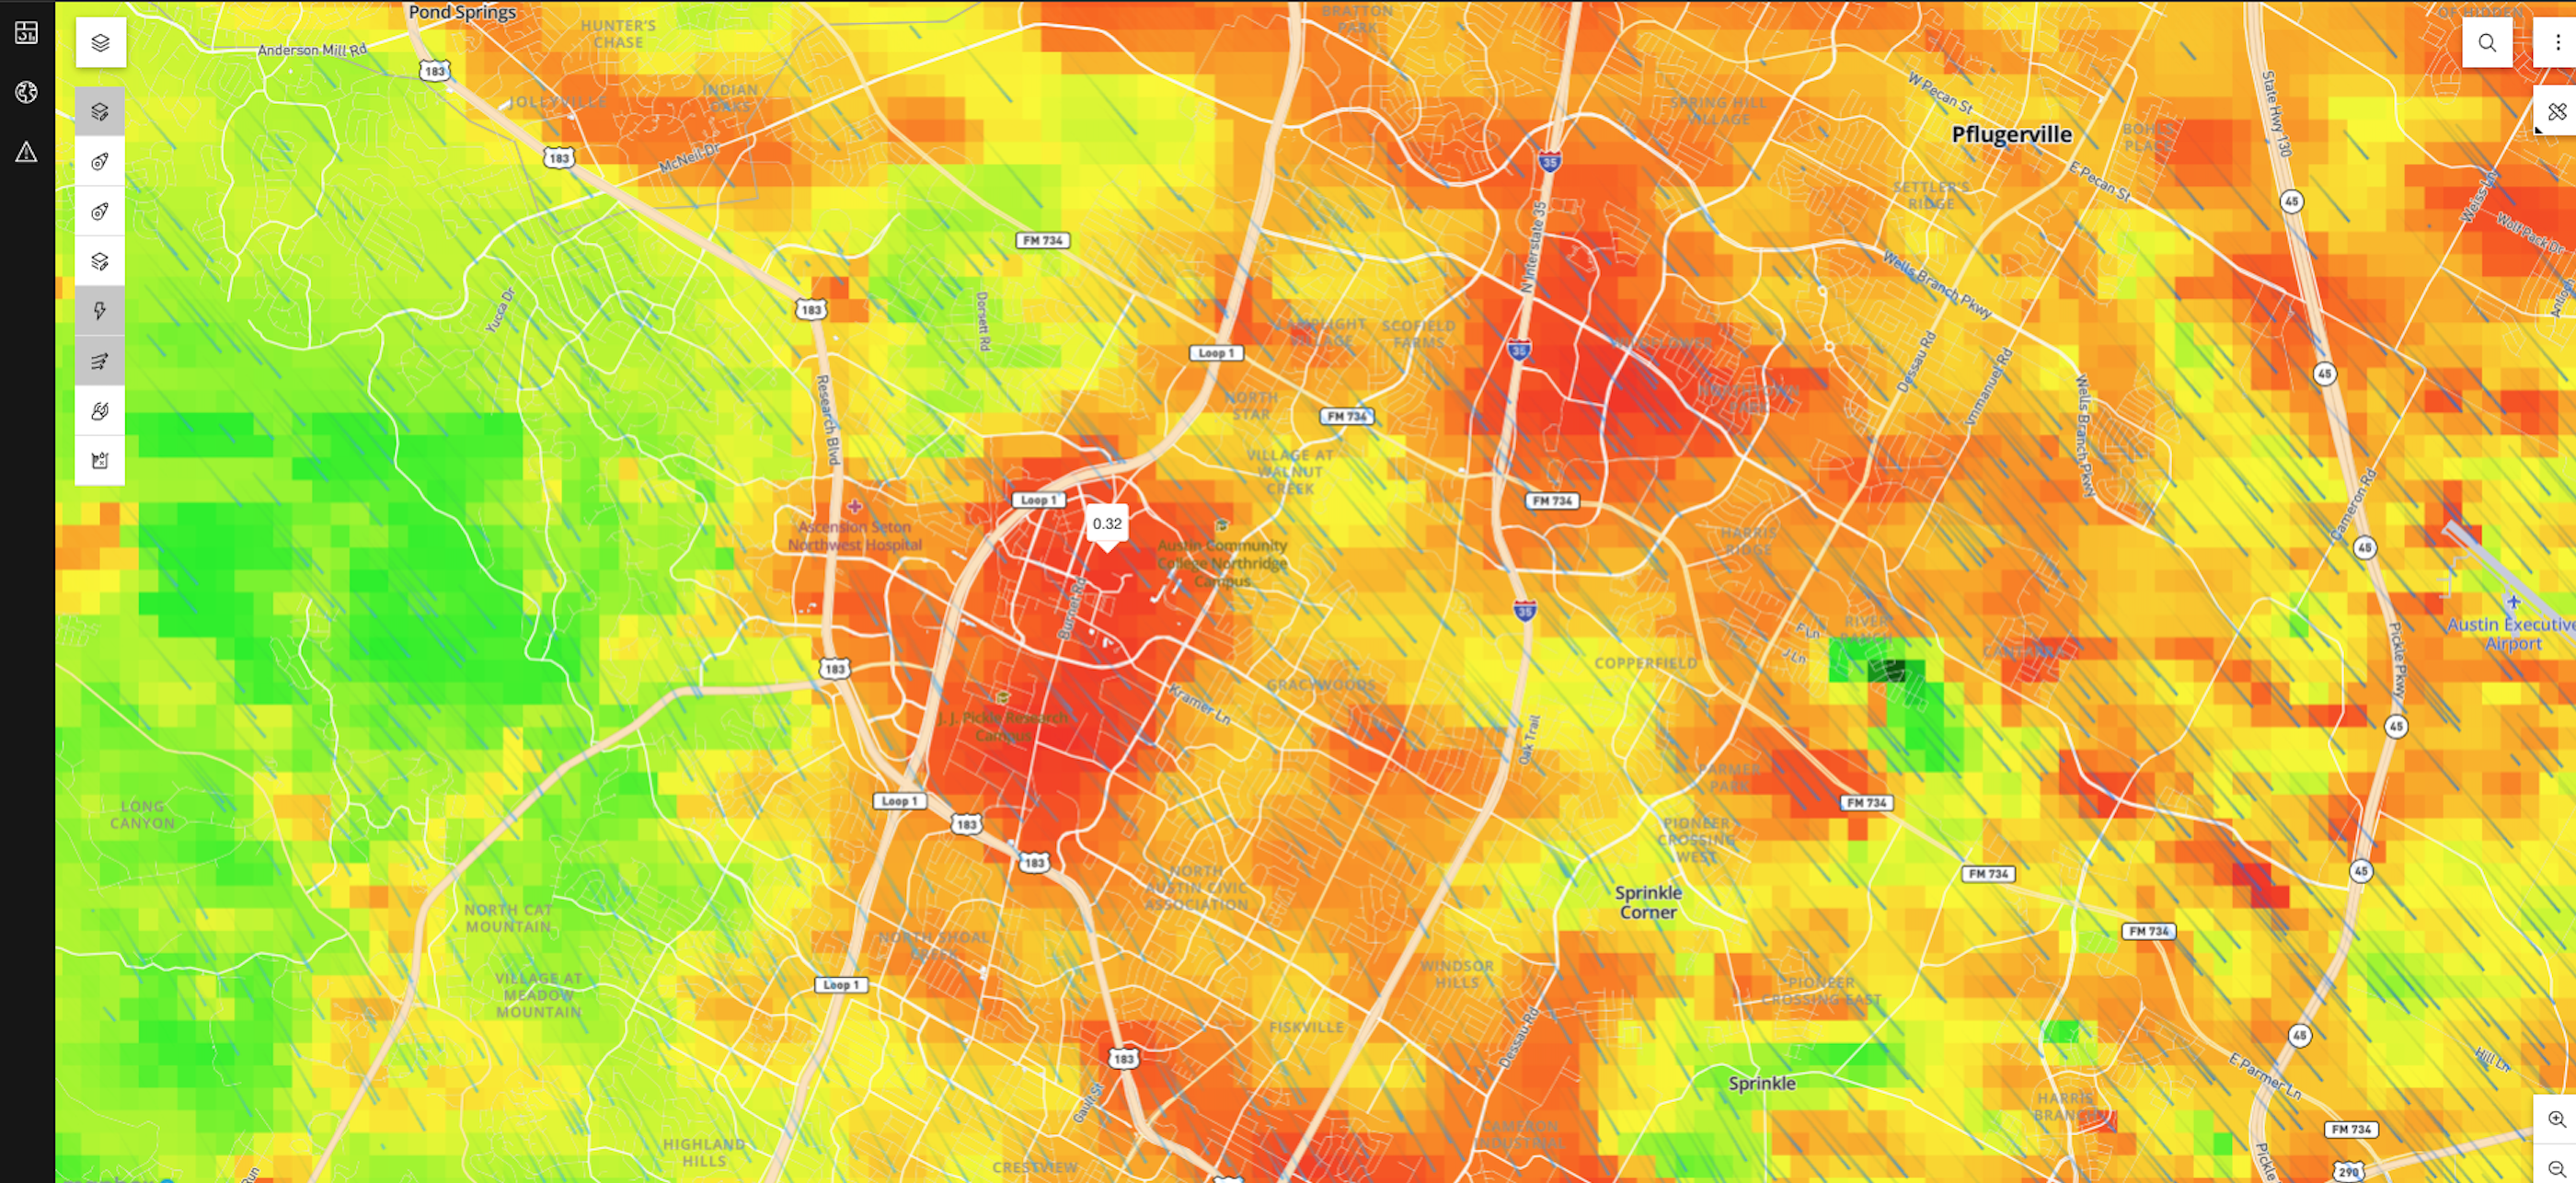
Draw a point/polygon, or look for an area of interest (like “Austin Texas” or “New South Wales”). Select relevant layers, etc and perform experimental queries.
Data Science Experiments
Optionally, create a new project in a data science environment (e.g, IBM Watson Studio), import your business assets and optionally, use one (or more) of the experimental queries from prior step to bring in data from PAIRS into your notebook. Do further experiments, feature selection, model construction/training, execution and persist output of model execution into a PAIRS data layer. Tutorials on how to construct and use geospatial queries are located here - https://pairs.res.ibm.com/tutorial/tutorials/api/index.html
Visualization of data from EIS Geospatial Component (PAIRS)
Once you have identified a specific layer in PAIRS that has the data for the time-interval of your interest, form a query similar to the example shown below, specifying your own spatial:coordinates, temporal:intervals and layers:id. Subsequently, proceed to Day 0 below to operationalize it for viewing within Dashboard Visualization component of EIS.
Example geospatial QUERY_PAYLOAD that is ready to be operationalized :
{
 "spatial": {
    "type":"square",
    "aoi":null,
    "coordinates":[38,-122,39,-121]
  },
 "temporal":{
   "intervals":[{
     "start":"2020-08-01",
     "end":"2020-08-31"
     }]
  },
 "layers":[{
    "id":"51",
    "type":"raster"
  }]
 }
Day 0: Register Analytics for visualization in Environmental Intelligence Suite - Dashboard Visualization Component
Generate JWT token
Get an access token:
- Follow the steps in Geospatial Analytics API - Obtaining an Access Token to obtain the token indicated by
<ACCESS_JWT> - Copy the value corresponding to
<ACCESS_JWT>from the step above to use in the registration API call below.
Registration Part # 1 - Platform metadata
Query registration payload
The JSON body of a query registration request contains the Geospatial Analytics (PAIRS) query. It is expected that the query JSON is:
- Encoded as a string in the
pairsPayloadproperty; - Quotes within the query JSON are escaped e.g.
\"and newlines removed.
Query registration uses the API call /v2/layer/analytics/metadata. Example payload value:
{
  "pairsPayload": "string",
  "analyticsName": "string"
}
The example Geospatial Analytics is shown below in Create the registration payload encoded as a string with embedded JSON quote characters escaped and newlines removed.
1.1 Create the registration payload
Create a JSON file with the query registration payload as shown below.
For example, registration-payload.json
{
  "pairsPayload": "{ \"spatial\": { \"type\":\"square\", \"aoi\":null, \"coordinates\":[38,-122,39,-121] }, \"temporal\":{ \"intervals\":[{ \"start\":\"2020-08-01\", \"end\":\"2020-08-31\" }] }, \"layers\":[{ \"id\":\"51\", \"type\":\"raster\" }]}",
  "analyticsName": "query-registration-ex-pt1"
}
- example query payload above is formatted as described in Query registration payload
1.2 Register the query
Linux, macOS
curl -X POST "https://foundation.agtech.ibm.com/v2/layer/analytics/metadata" \
  -H "accept: application/json" \
  -H "Authorization: Bearer <ACCESS_JWT>" \
  -H "Content-Type: application/json; charset=UTF-8" \
  -d @registration-payload.json
PowerShell2,3,4
curl.exe -X POST "https://foundation.agtech.ibm.com/v2/layer/analytics/metadata" `
  -H "accept: application/json" `
  -H "Authorization: Bearer <ACCESS_JWT>" `
  -H "Content-Type: application/json; charset=UTF-8" `
  -d @registration-payload.json
[
  {
    "analyticsUuid": "1f2d5a9e-39c5-4ca4-bebc-14ac43646960",
    "layerId": "51",
    "baseComputationId": "1607533200_04490762"
  }
]
Registration Part # 2 - Visualization metadata
2.1 Create the layer config payload
For example, layer-config-block.json
{"VIEWERSHIP_ROLE" : "ALL", "CONFIG_BLOCK": {
    "id": "customQuery-staging-test01",
    "modelRegistryId": null,
    "displayName": "Staging Test - Custom Query 01",
    "provider": null,
    "layerType": "grid",
    "isSelected": false,
    "isActive": false,
    "enableValidity": false,
    "lastUpdatedUtc": null,
    "coverageArea": "Custom",
    "dataAttributes": {
      "url": "https://foundation.agtech.ibm.com/v2",
      "uuid": "1f2d5a9e-39c5-4ca4-bebc-14ac43646960"
    },
    "menuIconUrl": null,
    "legendUrl": "",
    "styleProperties": {
      "palette": {
        "COLOR_STEPS": [
          { "step": -1, "rgba": [ 0, 0, 8, 255 ] },
          { "step": 0, "rgba": [ 11, 0, 251, 255 ] },
          { "step": 0.2, "rgba": [ 236, 0, 34, 255 ] },
          { "step": 0.4, "rgba": [ 250, 93, 7, 255 ] },
          { "step": 0.6, "rgba": [ 250, 249, 0, 255 ] },
          { "step": 0.8, "rgba": [ 0, 239, 0, 255 ] },
          { "step": 1, "rgba": [ 1, 49, 1, 255 ] }
        ]
      },
      "unit": "C",
      "isInterpolated": true,
      "extendMinimumColor": false,
      "extendMaximumColor": true,
      "invalidDataValue": -9999
    }
  }}
Before making the sample request below:
- Modify the
idto be something unique - Set the desired
displayName - Substitute the correct
dataAttributes.uuidusing theanalyticsUuidvalue from the response above - Substitute
<ACCESS_JWT>(Obtaining an Access Token).
Adjust styleProperties:palette and unit as appropriate. Contact your IBM representative or Expert Labs to discuss adjusting additional properties relevant to your specific geospatial analytics use-case.
2.2 Add Interactive Map (IMAP) custom layer
curl -L -X PUT 'https://api.auth-b2b-twc.ibm.com/api/v1/IMAP/put-layer-config-block' \
     -H "Authorization: Bearer <ACCESS_JWT>" \
     -H "Content-Type: application/json" \
     -d @layer-config-block.json
PowerShell2,3,4
curl.exe -L -X PUT 'https://api.auth-b2b-twc.ibm.com/api/v1/IMAP/put-layer-config-block' `
         -H "Authorization: Bearer <ACCESS_JWT>" `
         -H "Content-Type: application/json" `
         -d @layer-config-block.json
Example response:
Response: 200
Block Added.
Navigate to IBM Environmental Intelligence Suite - Dashboard Visualization
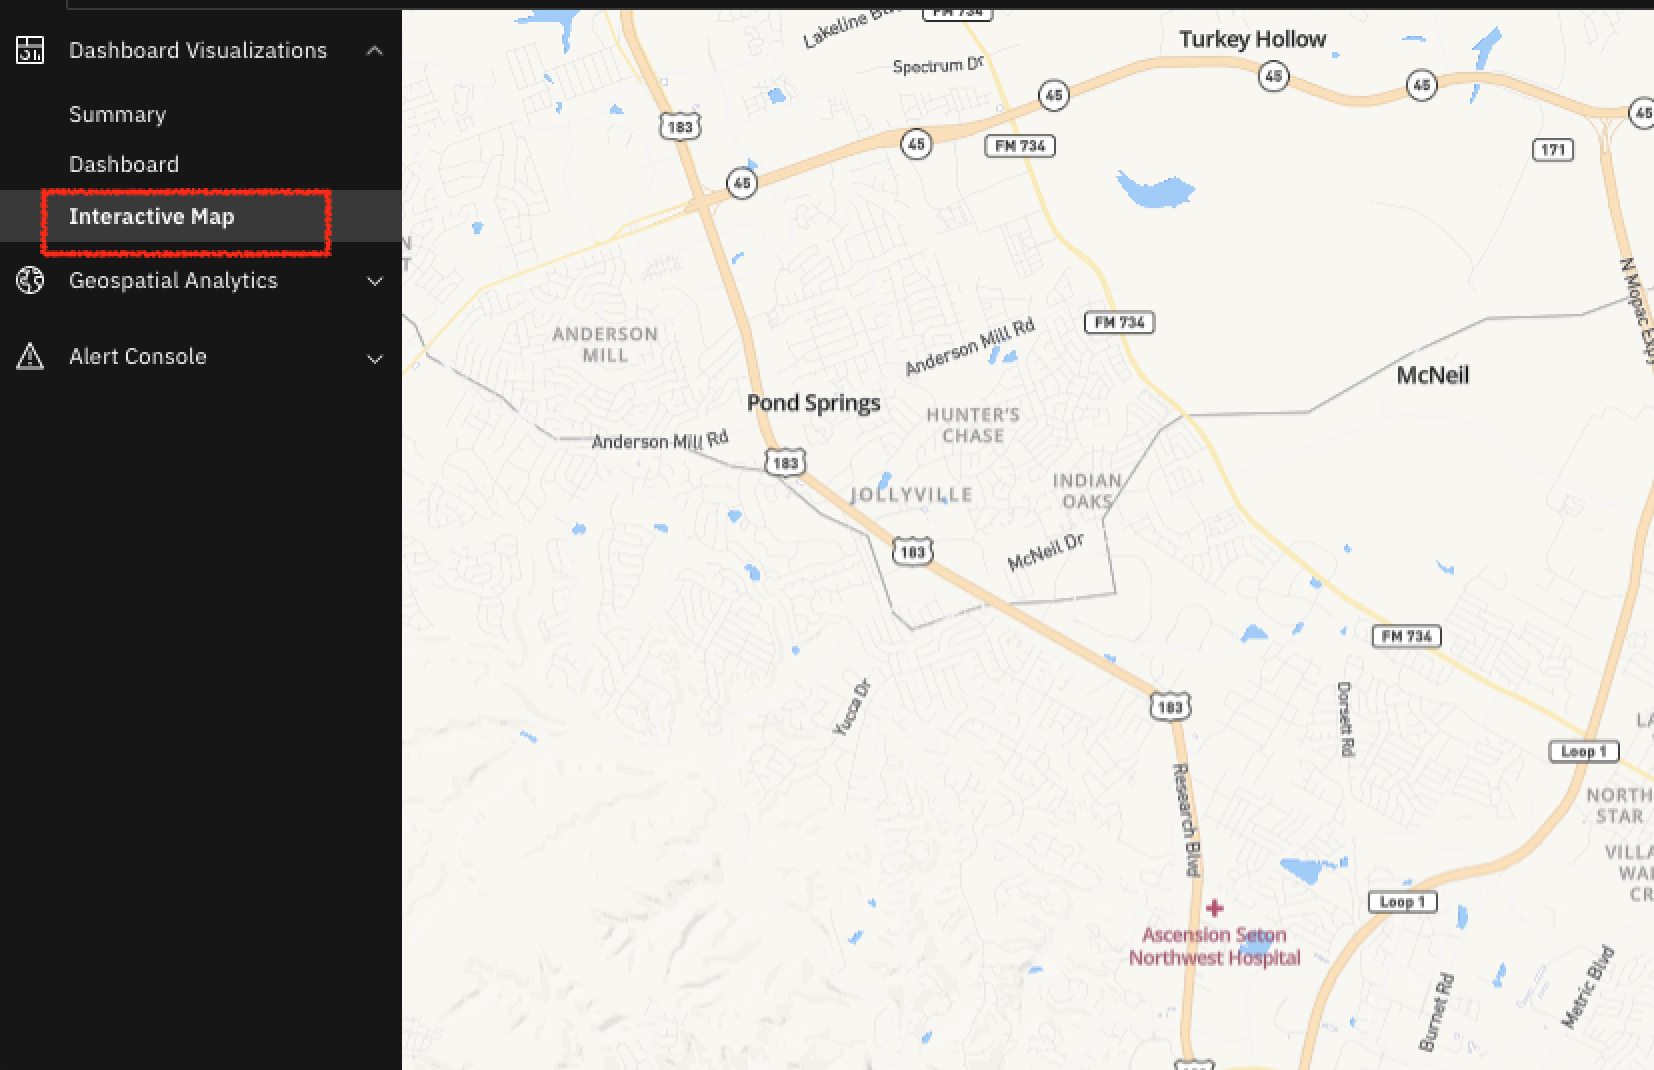
- Login to IBM Environmental Intelligence Suite with your username and password by launching https://environmentalintelligencesuite.ibm.com/ - and navigate to Dashboard Visualization -> Interactive Map
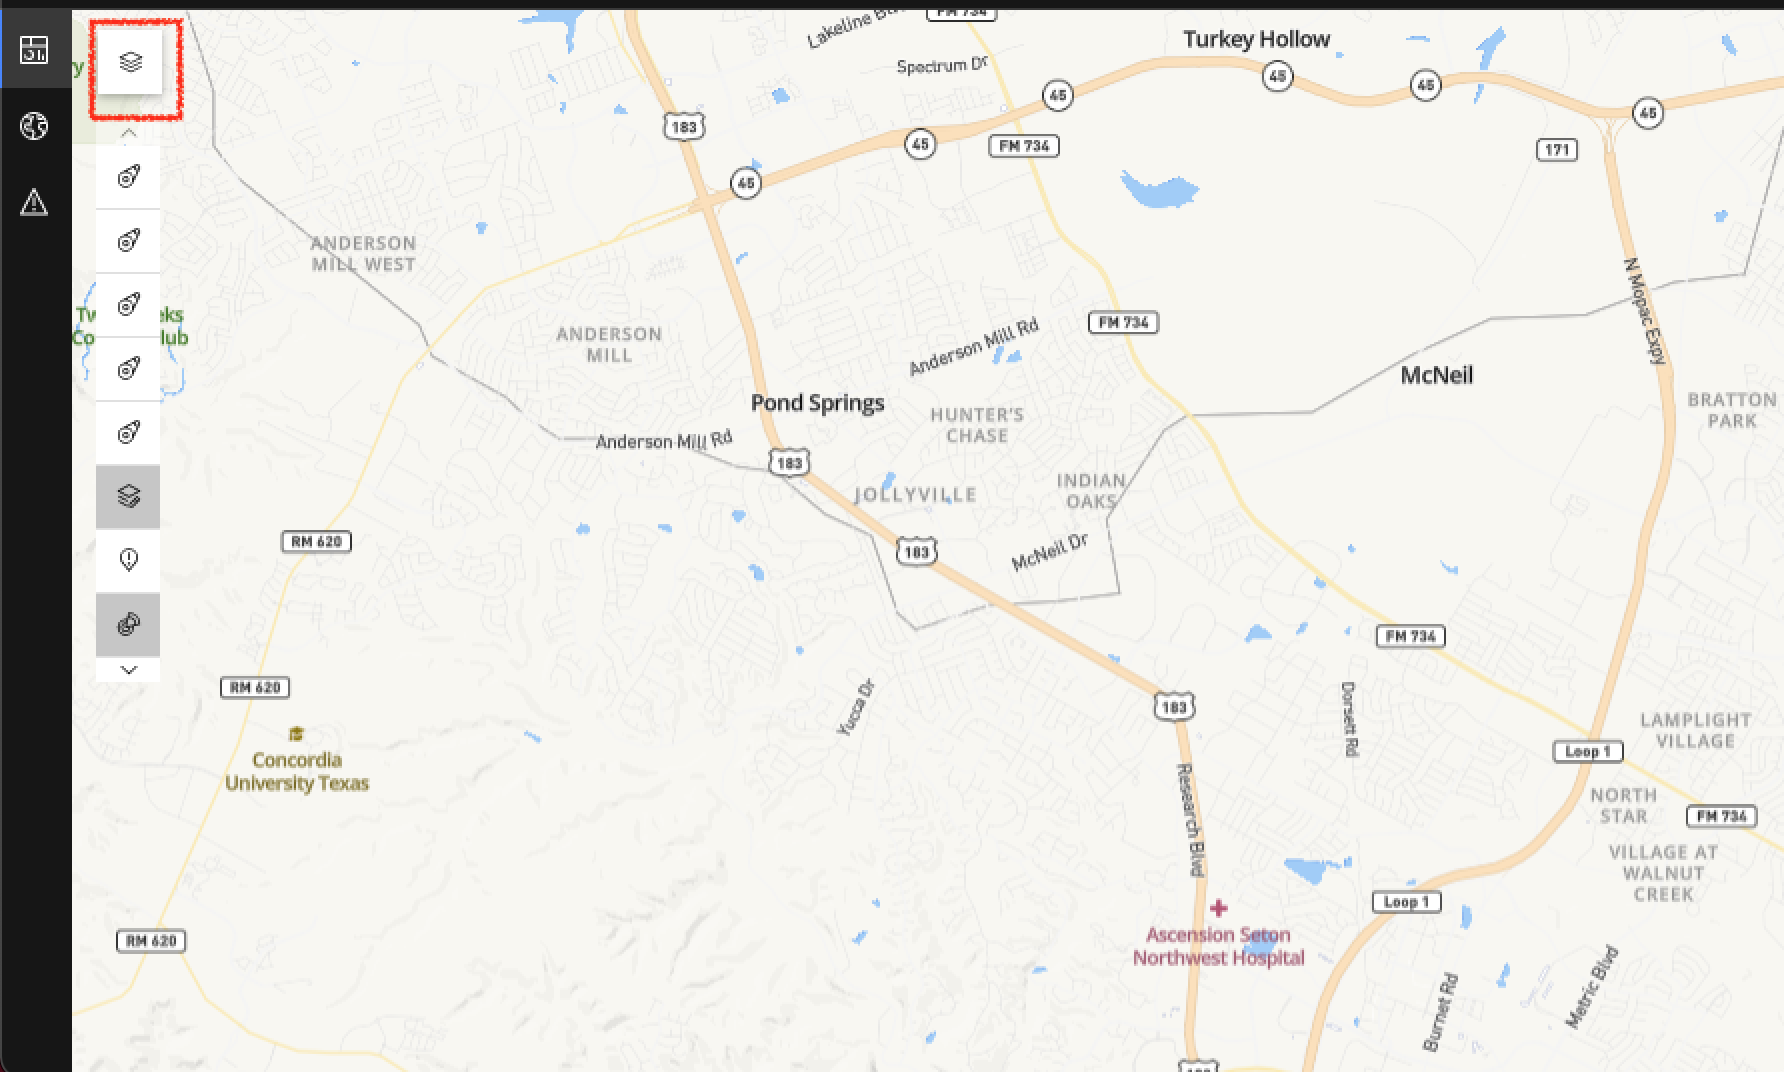
- Click on Map Layers and Overlays:
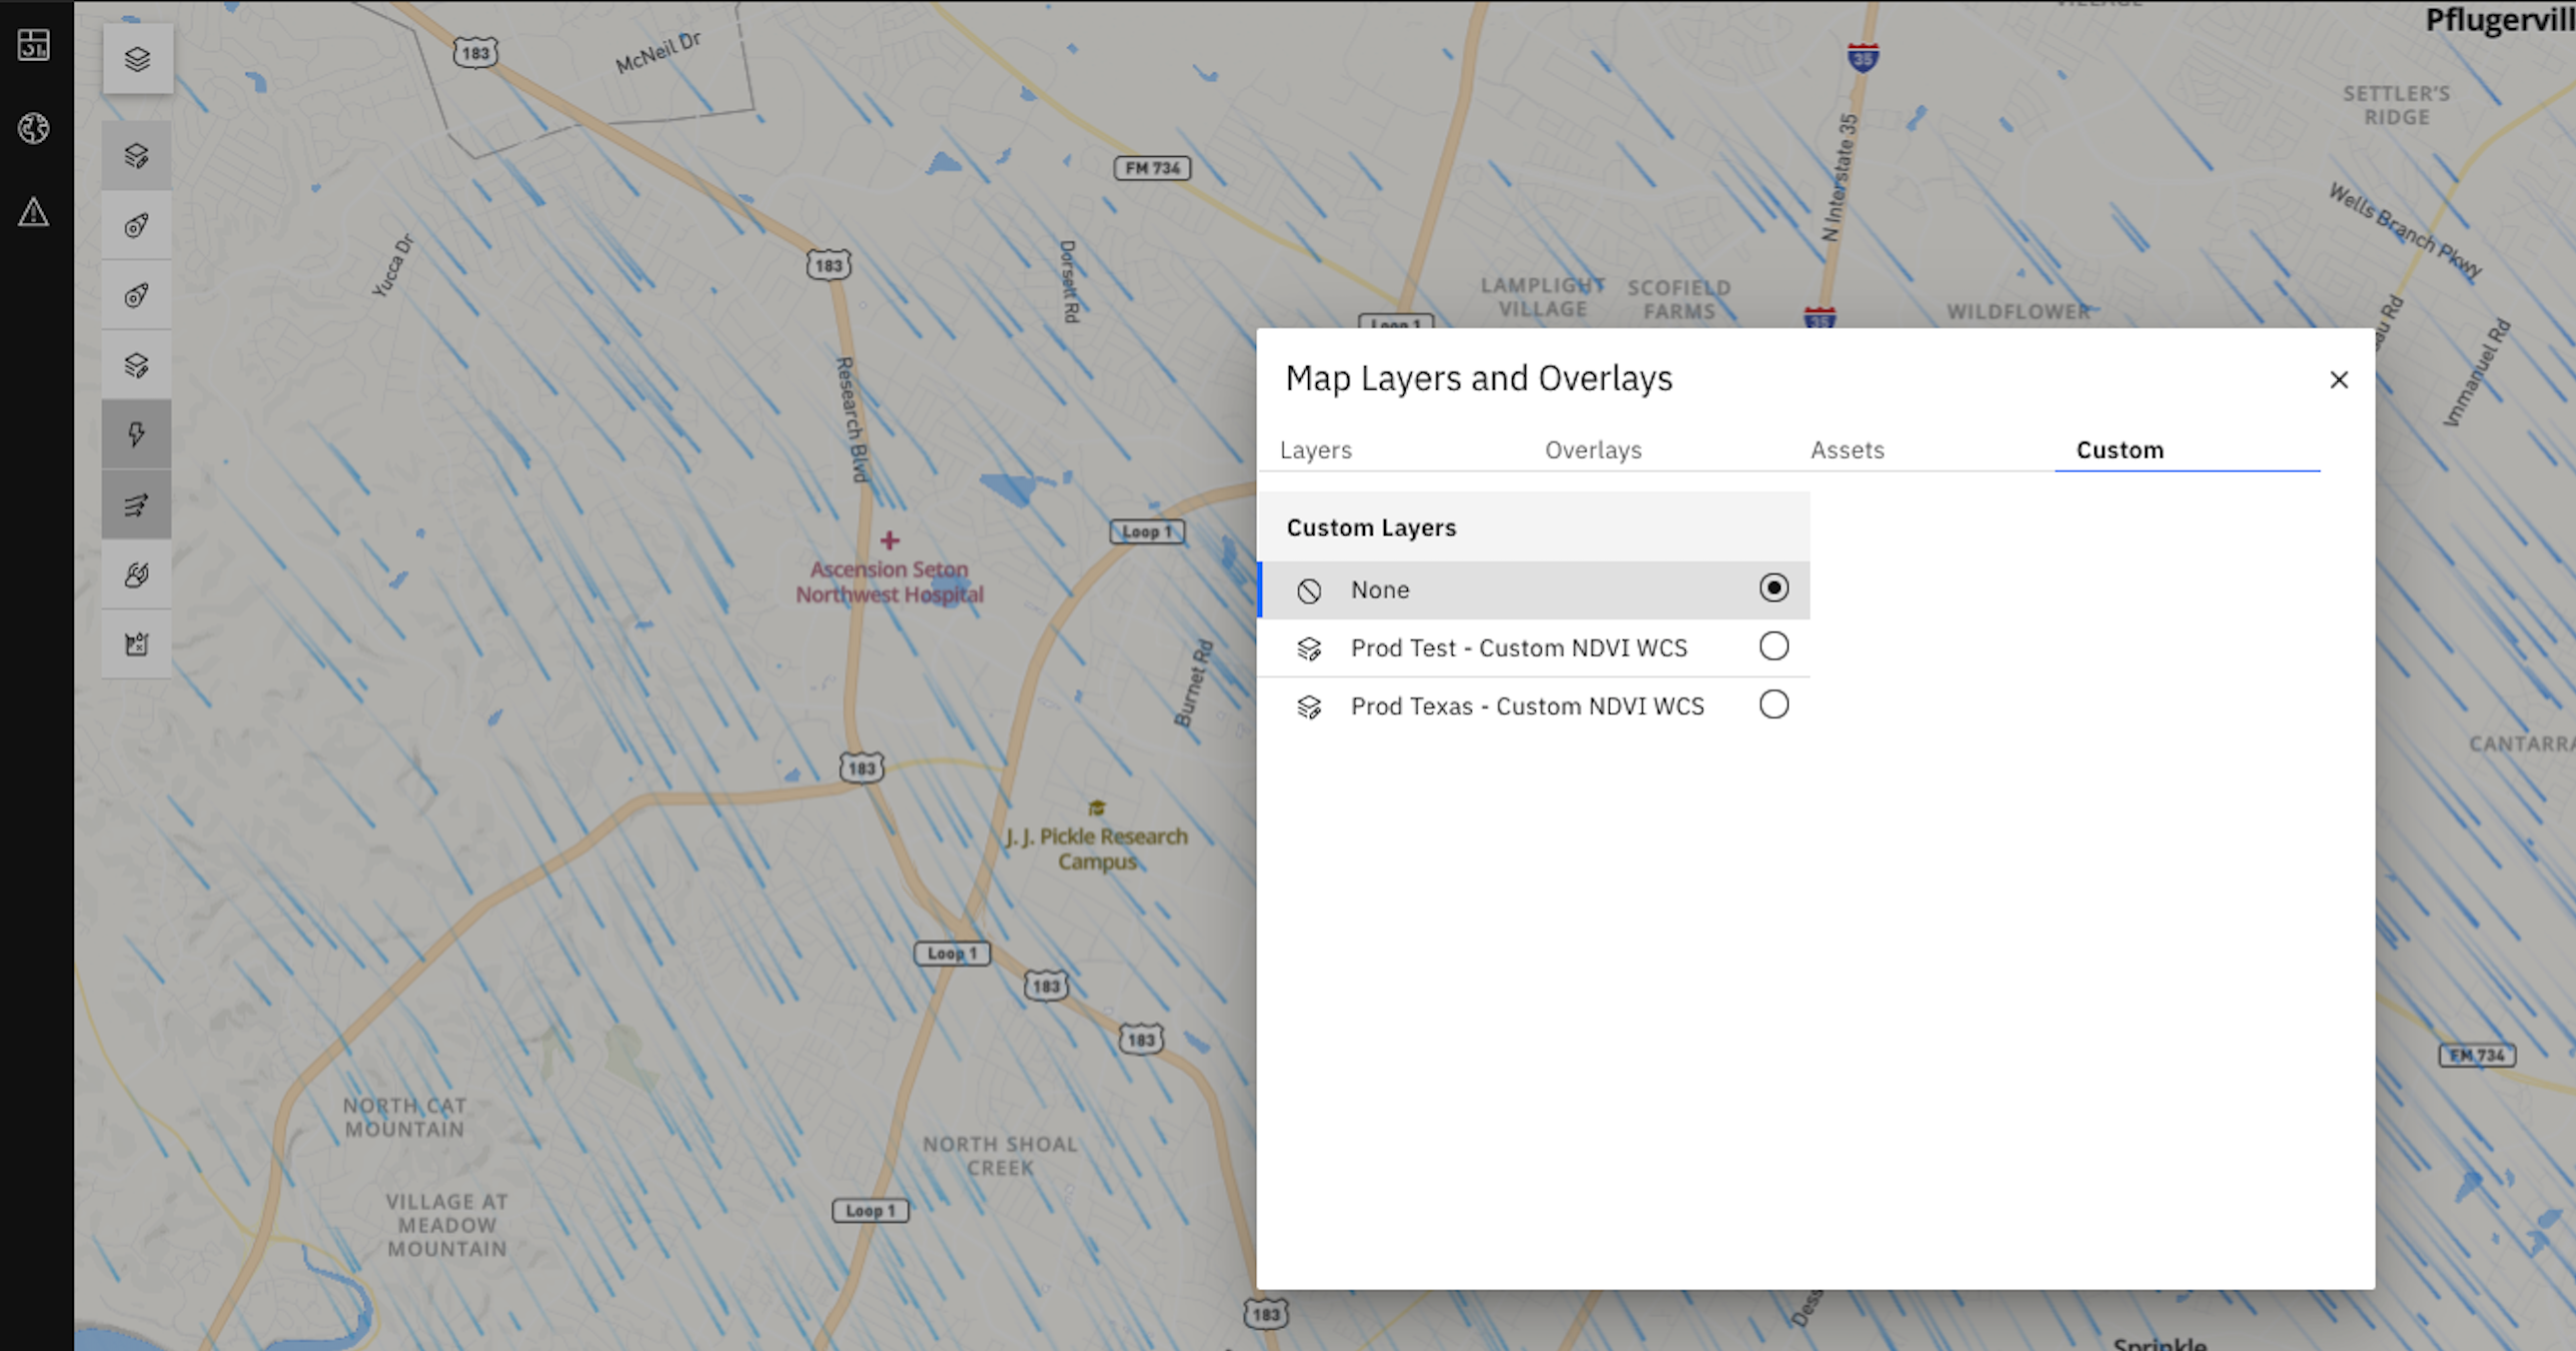
- Select the Custom Layer under “Custom” tab in Map Layers and Overlays:
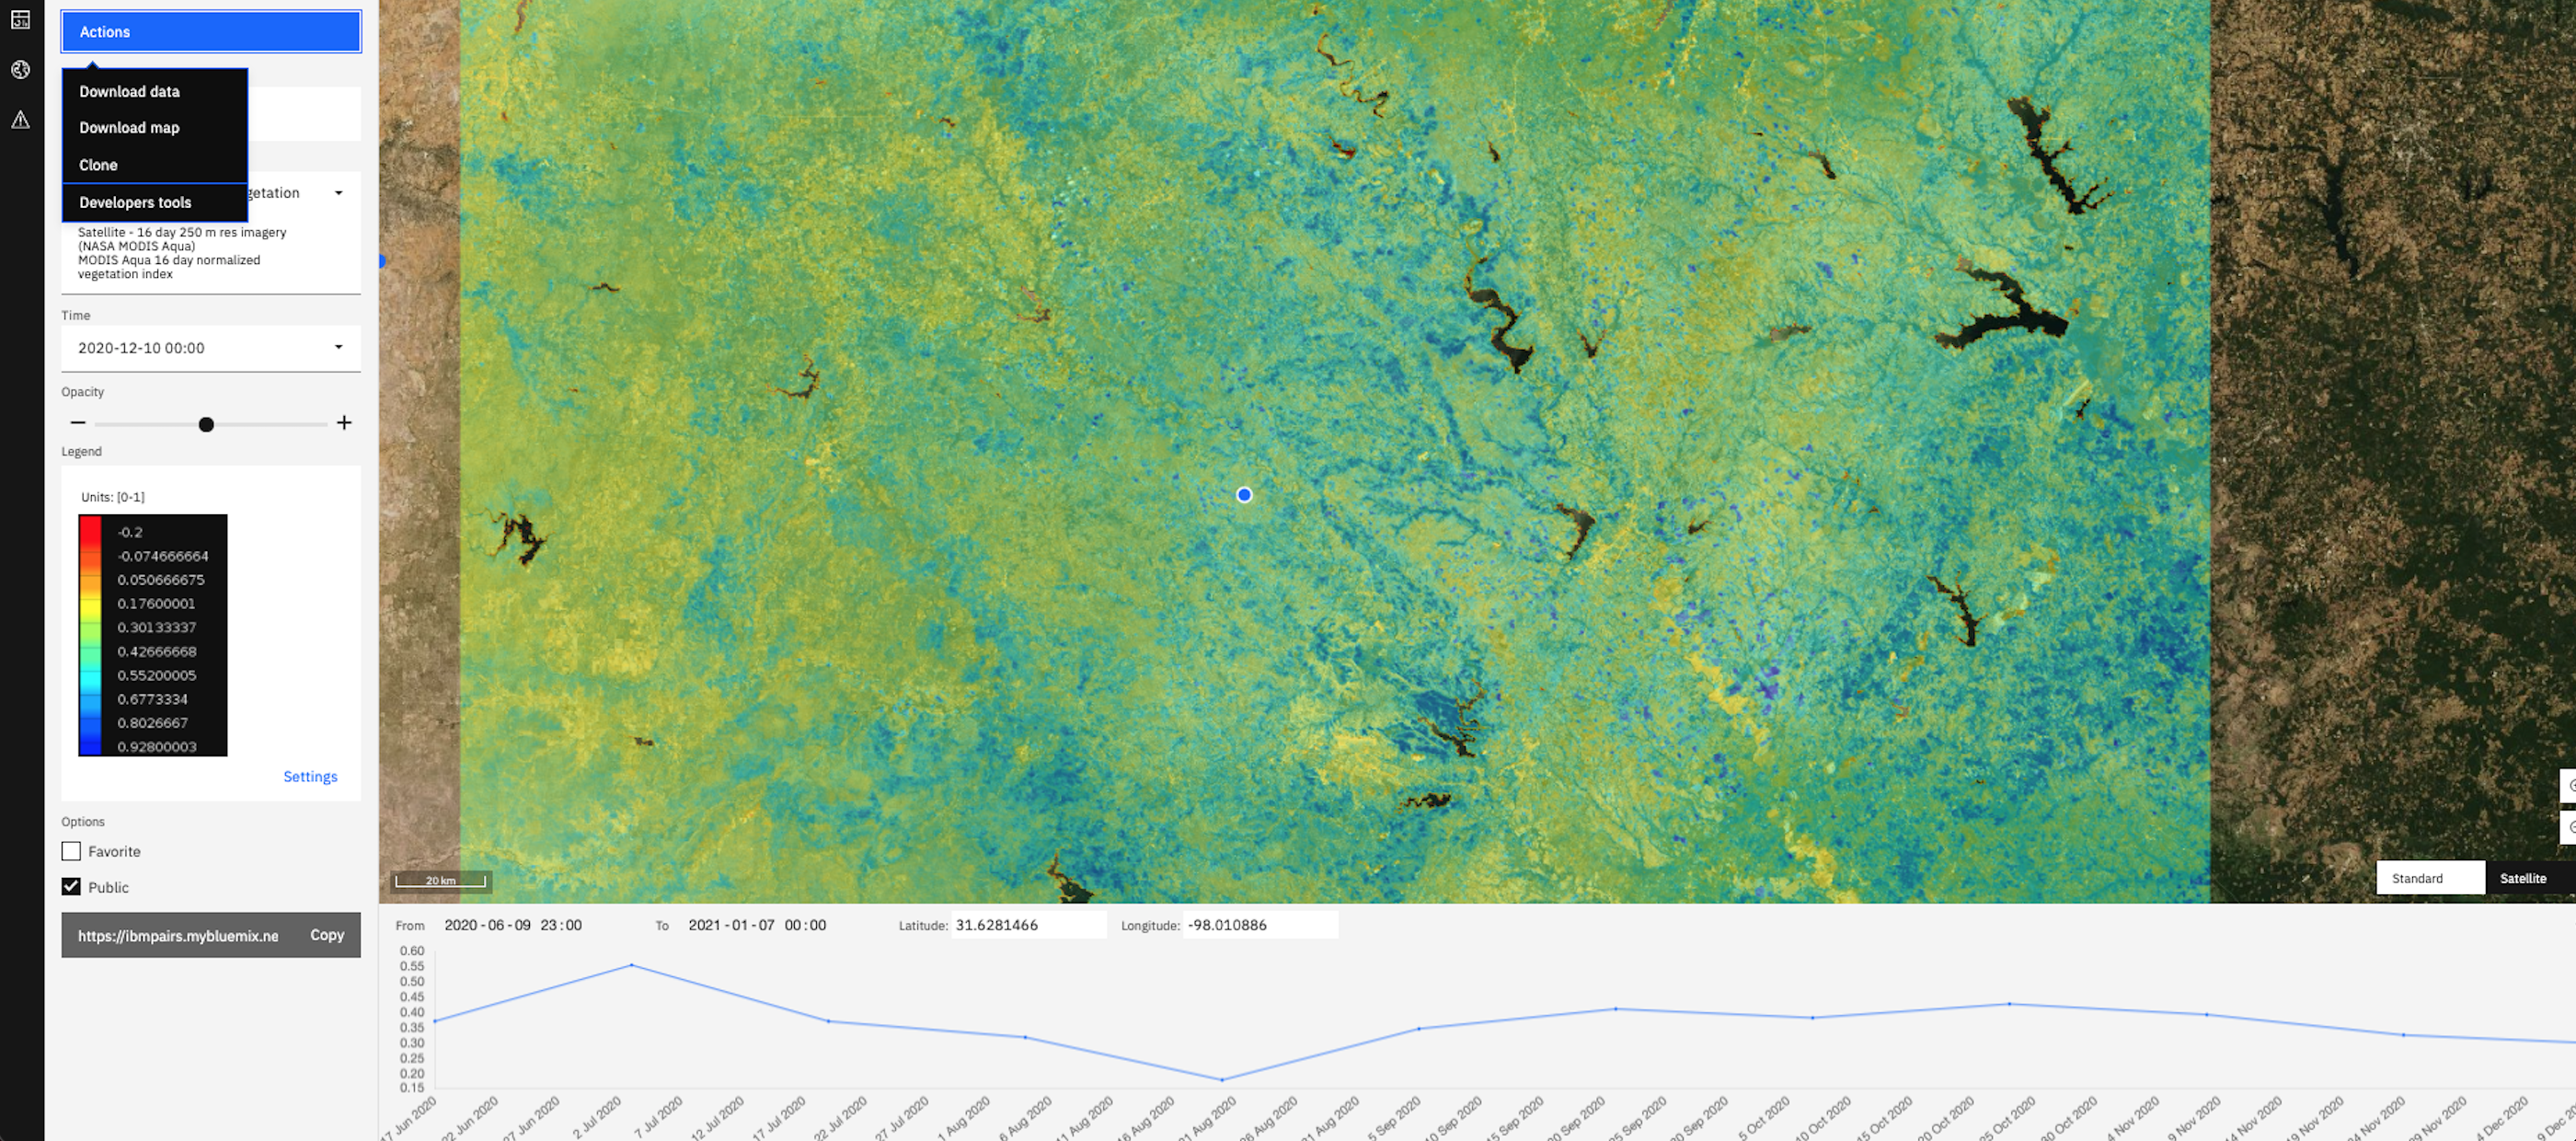
- Visualize and interact with the query results:
Day 1 and beyond
For a subsequent query run, the query temporal interval could change (for instance to 2020-09-01 to 2020-09-30)
1. Create query payload
query-payload-temporal-update.json
{
    "spatial": {
        "type": "square",
        "coordinates": [
            38,-122,
            39,-121
        ]
    },
    "temporal": {
        "intervals": [
            {
                "start": "2020-09-01",
                "end": "2020-09-30"
            }
        ]
    },
    "layers": [
        {
            "id": "51",
            "type": "raster"
        }
    ]
}
2. Submit the query and keep the query job id
Linux, macOS
curl -L -X POST 'https://pairs.res.ibm.com/v2/query' \
-H "Content-Type: application/json" \
-H "Authorization: Bearer <ACCESS_JWT>" \
-d @query-payload-temporal-update.json
PowerShell2,3,4
curl.exe -L -X POST 'https://pairs.res.ibm.com/v2/query' `
-H "Content-Type: application/json" `
-H "Authorization: Bearer <ACCESS_JWT>" `
-d @query-payload-temporal-update.json
{
    "id": "1607533200_04577287"
}
Merge the new job with original baseComputationId from Day 0 - Registration Part # 1 above
curl -L -X PUT 'https://pairs.res.ibm.com/v2/queryjobs/1607533200_04490762/merge/1607533200_04577287' \
-H "Authorization: Bearer <YOUR API KEY>"
PowerShell2,3,4
curl.exe -L -X PUT 'https://pairs.res.ibm.com/v2/queryjobs/1607533200_04490762/merge/1607533200_04577287' `
-H "Authorization: Bearer <YOUR API KEY>"
As a consequence of the above operation, the output in Dashboard Visualization component would reflect computation from Sept 2020 (Day 1) rather than the original one from Aug 2020 (Day 0).
Navigate to Environmental Intelligence Suite and verify that the query results reflect computational change due to temporal movement from Day 0 to Day 1.
1 JSON Web Token
2 Backtick/Backquote ` PowerShell Quoting Rules
3 When pasting from the clipboard into PowerShell, double quotes (") should be escaped (\")
4 Tar and Curl Come to Windows!