Configuration
Configure Quote of the Day Application to use MQ & ACE
The "Quote of the Day" application has been installed for you . For more information about the Quote of the Day application, you can go to this GitLab location: https://gitlab.com/quote-of-the-day/quote-of-the-day (It is not necessary to go there, but you might be interested in learning more about the application.)
For the containerized portion of the application, some technologies are automatically instrumented for monitoring. In addition, the load generation tool is continuously running transactions against the application.
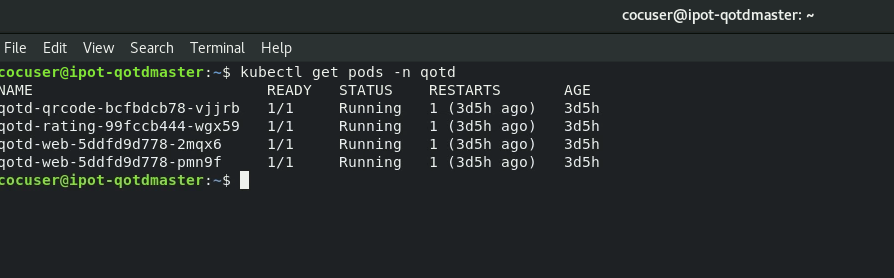
Let's verify that things are running. Issue the kubectl get pods command against the qotd namespace/project.
kubectl get pods -n qotd
You should see results similar to this:
The next step is to start the MQ and the ACE servers on the ipot-mqace node. The Quote of the Day application uses external ACE and MQ servers that are used by the engraving service which makes a REST API call to ACE and ACE subsequently calls MQ and puts a message on a queue. All the necessary configurations have been made except except starting the ACE server
You can do this by opening a secured shell session from the bastion to the ipot-mqace host and then executing the startscript as the root user.
You will need to enter the cocuser password
ssh -p 2022 cocuser@169.62.62.188

sudo /etc/init.d/middleware.sh start
Now you can navigate to the QotD application web page and try executing an engraving order
QotD runs at: http://169.62.62.174:32000
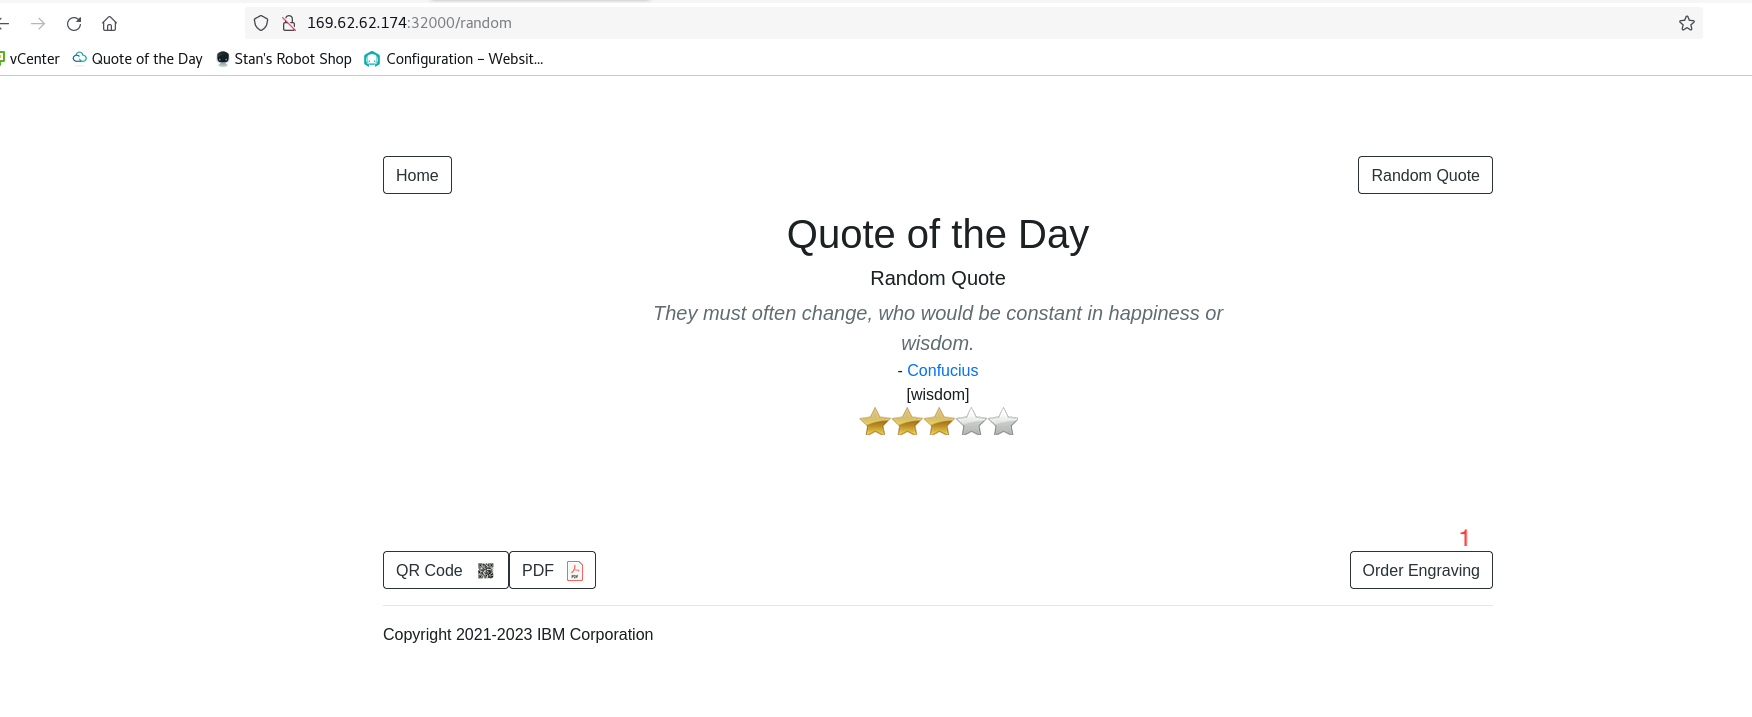
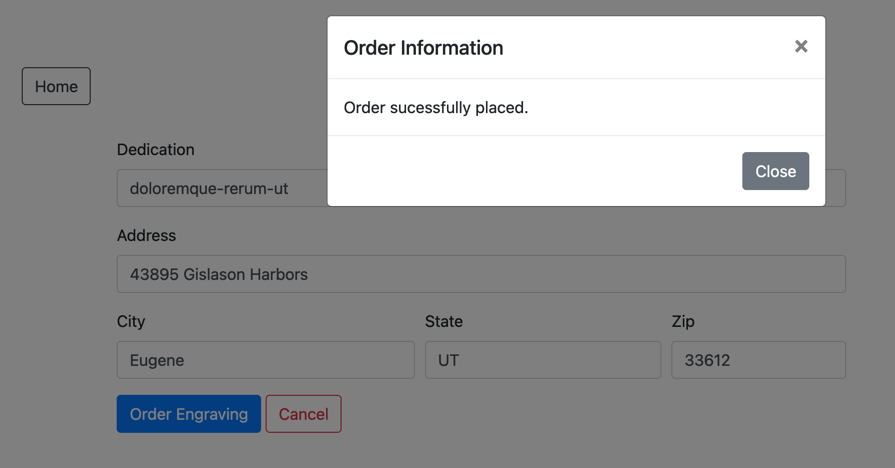
The order details are filled in automatically. Click on the Order Engraving button. You should see a confirmation telling you the order was placed successfully
Configure ACE and MQ for Resource Monitoring
This section is here for informational purposes. There are no steps to execute.
This section of the lab will help you understand how IBM MQ and IBM App Connect Enterprise (ACE) need to be configured for monitoring. There are certain configuration settings within MQ and ACE that are required in order to get the monitoring KPIs. The key KPI's that need to be enabled are Resource Stats and Flow Stats. The requirements are documented in the sensor configuration guide that is online. You'll see links to those guides further down in this document.
Typically, these steps are performed by the MQ and ACE admins, so you don't need to know the step by step procedure. But, you do need to tell the MQ/ACE admins what the monitoring requirements are.
Verify the ACE configuration
The "Resource Monitoring" KPIs are already enabled in most customer
environments. But it is worth validating the configuration. For example, you can
use the ACE mqsireportresourcestats and mqsireportflowstats commands to view
the configuration for ACE.
Become root user on mqace node:
sudo -i
To run the following commands you have to source the mqsiprofile:
. /opt/ace-11.0.0.11/server/bin/mqsiprofile
In the commands listed, BK1 is the Integration Node name and would be different if the Integration Node had a different name
Here are example commands that you can issue to see the ACE configuration:
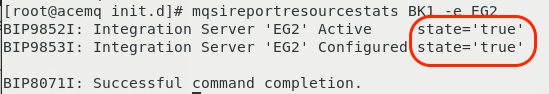
mqsireportresourcestats BK1 -e EG2
You will see results similar to those shown below. Notice that the "state" is set to "true" indicating that "Resource Stats" are enabled.
To see the configuration of the "flow" stats, issue the following command:
mqsireportflowstats BK1 -s -e EG2
You will see results similar to those shown below. Notice that the "state" is "active", and the outputFormat is "json". This indicates that the "Flow Stats" are enabled. The product requires that the output format be set to json vs. XML.

Verify the MQ configuration
There are fewer requirements for MQ. The sensor will work with the default settings. However, you can have the sensor automatically use thresholds/Events that are setup within the MQ server. If you want to use the built in MQ Events, then you need to set CHLEV (Channel Events) and PERFMEV (Performance Events) to ENABLED. To check those settings, you can issue the following commands.
Become root user on mqace node:
sudo -i
HINT: To run the following commands you have to source the setmqenv and
specify the queue manager name (QM1):
. /opt/mqm/bin/setmqenv -m QM1
You first need to run the "runmqsc" command.
/opt/mqm/bin/runmqsc QM1
The runmqsc command won't prompt you with a cursor. That's okay. Just start typing the commands.
Within the runmqsc command prompt you can issue other MQ commands. Type the following commands:
Then:
display QMGR PUBSUB CHLEV
display QMGR CLUSTER PERFMEV
These commands will give outputs similar to what's shown below.
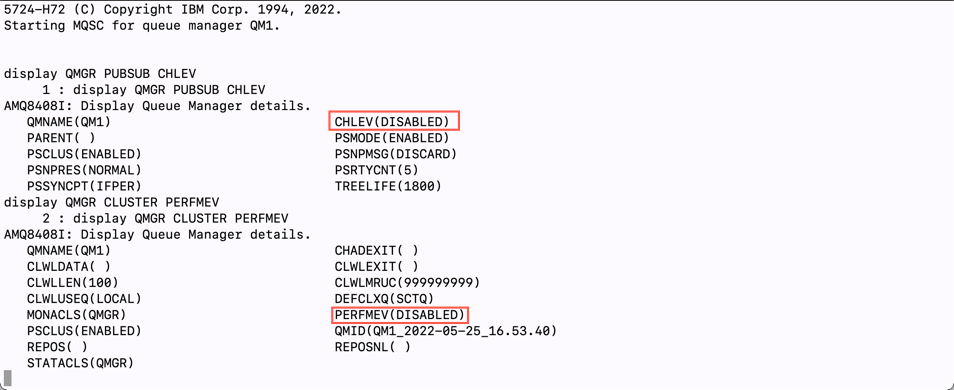
In the output, you can see that the CHLEV (Channel Events) and PERFMEV (Performance Events) is set to disabled.
To enable run the following commands:
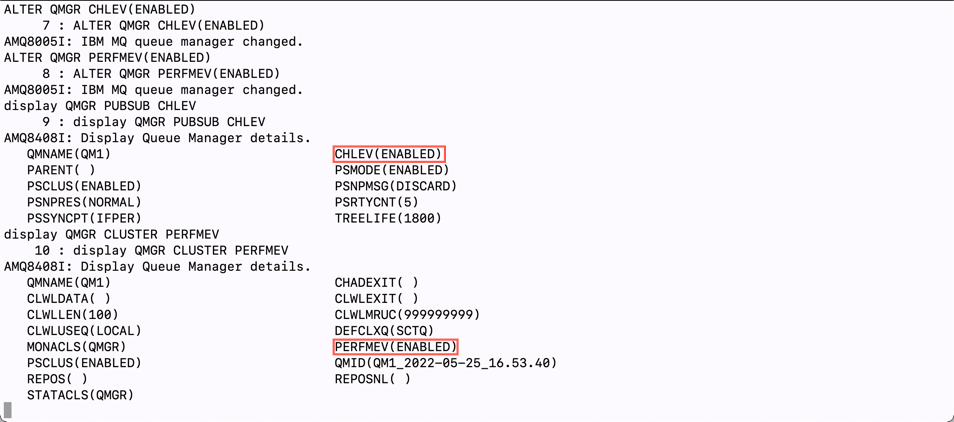
ALTER QMGR CHLEV(ENABLED)
ALTER QMGR PERFMEV(ENABLED)
Re-run the display command to verify that configuration was changed
Type "quit" to exit the runmqsc command prompt.
quit
Configure ACE and MQ for Tracing
This section is here for informational purposes. There are no steps to execute.
In addition to the "Resource Monitoring" KPIs, additional settings are required to enable Tracing within IBM MQ and ACE. It is important that you understand this process since Tracing is typically not enabled by default in most IBM MQ and ACE environments. In this section, we've documented the steps.
Typically, these steps are performed by the MQ and ACE admins, so you don't need to know the step by step procedure.
This section is simply going to describe the process. The procedure is well documented within the Instana online documentation. You will find a Tracing section within the sensor documentation.
For ACE, you perform the following steps
- Download a small TAR file from IBM Fix Central. There are links within the Instana documentation.
- Extract the tar file into the /var/mqsi/shared-classes directory
- Stop the ACE server
- Run the following command to "Install" the User Exit: mqsichangeflowuserexits BK1 -o -x /var/mqsi/shared-classes
- Start the ACE server
- Activate the User Exit by typing: mqsichangeflowuserexits BK1 -o -a ACEOpenTracingUserExit
The MQ procedure is similar.
- Download a small TAR file from IBM Fix Central. There are links within the Instana documentation.
- Extract the tar file to /var/mqm/exits64
- Edit the /var/mqm/mqs.ini file
- Add a small section within the /var/mqm/mqs.ini file. The content can be copied and pasted from the Instana documentation.
- Restart the Queue Manager
In the lab environment, these steps have already been performed. If you want, you can examine the files and directories specified above.
Even though the TAR files for ACE and MQ look similar, they are unique for each middleware component.
Further Configuration (Optional)
First, let's change the Zone name within the file. This is similar to the
Zone that you specified when installing the Docker and OpenShift monitoring
Agents. Scroll down until you see the section titled "Hardware & Zone".
Uncomment the 3 lines of text starting with
com.instana.plugin.generic.hardware. By default the "availability-zone"
parameter is set to "Datacenter A /Rack 42". Change the value to ACE and MQ
The section of the configuration.yaml file should look as follows:
# Hardware & Zone
com.instana.plugin.generic.hardware:
  enabled: true # disabled by default
  availability-zone: "ACE and MQ"
In addition to configuring the Zone name, you can specify tags within the configuration.yaml file. Search for the section within the configuration.yaml file titled Host. Within that section, you see a section for tags. By default this section will be commented out. Uncomment the com.instana.plugin.host section and specify some tags. For example, add a production tag to indicate that this system is a production server. And, add a QOTD tag to indicate that it supports the Quote of the Day application. Add a Dallas tag to indicate the the server resides in Dallas, Texas.
Add production, QOTD, and Dallas as tags. The configuration.yaml section should look as follows:
com.instana.plugin.host:
  tags:
    - "production"
    - "QOTD"
    - "Dallas"
It is possible to specify tags for the Docker and OpenShift versions of the Instana Agent, but we are not going to cover that in this lab.
Zones and Tags can be used for a number of purposes within instana:
- Search for systems within the UI or via the APIs
- Assign thresholds to systems with a specific tag or zone name
- Build custom dashboards using the tags or zone names and more...
By default, Instana will monitor key processes that are related to the applications/middleware that are being monitored. It will also monitor processes that are consuming large amounts of CPU or Memory. Sometimes, customers want to ensure that specific processes are monitoring. Let's edit the configuration.yaml file to specify some key processes on this ACE/MQ server. Search within the configuration.yaml file for com.instana.plugin.process
The section will be commented out by default. Uncomment the section and specify the following processes for monitoring (crond, amqzmgr0, runmqlsr). One process is the cron daemon, which customers frequently want to monitor. The other two process are related to IBM MQ. The section should look like this:
com.instana.plugin.process:
  processes:
    - "crond"
    - "amqzmgr0"
    - "runmqlsr"
There is also a section in the configuration.yaml file where you can specify processes that you want to ignore. Search for com.instana.ignore.
Save and exit the configuration.yaml file. In "vi", type ":wq" to save and exit the file.
As soon as you save your changes to the file, Instana will detect those changes and will start to implement what you have configured.
At this point, we recommend that you navigate to next section of this tutorial Explore Instana.
In the Explore Instana section, we'll begin by confirming that the ACE and MQ monitoring are working properly. If they are not, come back to this section and double check your configuration.yaml settings and check that there are no obvious errors in the log file.
The main install log file is /opt/instana/agent/data/log/agent.log
Summary
You learned how to configure the Instana sensor for IBM App Connect Enterprise (ACE) and IBM MQ. This includes customization such as defining tags, defining a zone, and identifying specific processes to monitor.
Now, proceed to the next section where you will explore Instana.