Explore Instana
Follow the tutorial below to explore some key Instana capabilities including monitoring of Kubernetes, monitoring of applications, and monitoring of infrastructure.
Explore Kubernetes
Open the browser tab for the Instana user interface.
On the left navigation, select Platforms and then Kubernetes
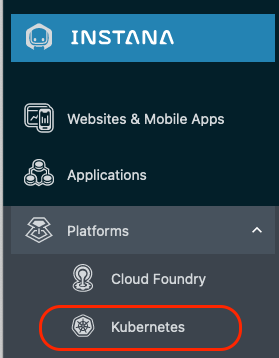
When you select Platforms in the classroom environment, you will only see kubernetes and Cloud Foundry. But, there are additional feature flags that can be enabled to add in other technologies like VMware, Power HMC, and Z HMC. You saw the feature flags for those technologies when you performed the Instana server installation.
You will see a list of Kubernetes clusters. Look for the Cluster name that you chose when you installed the Instana Agent.
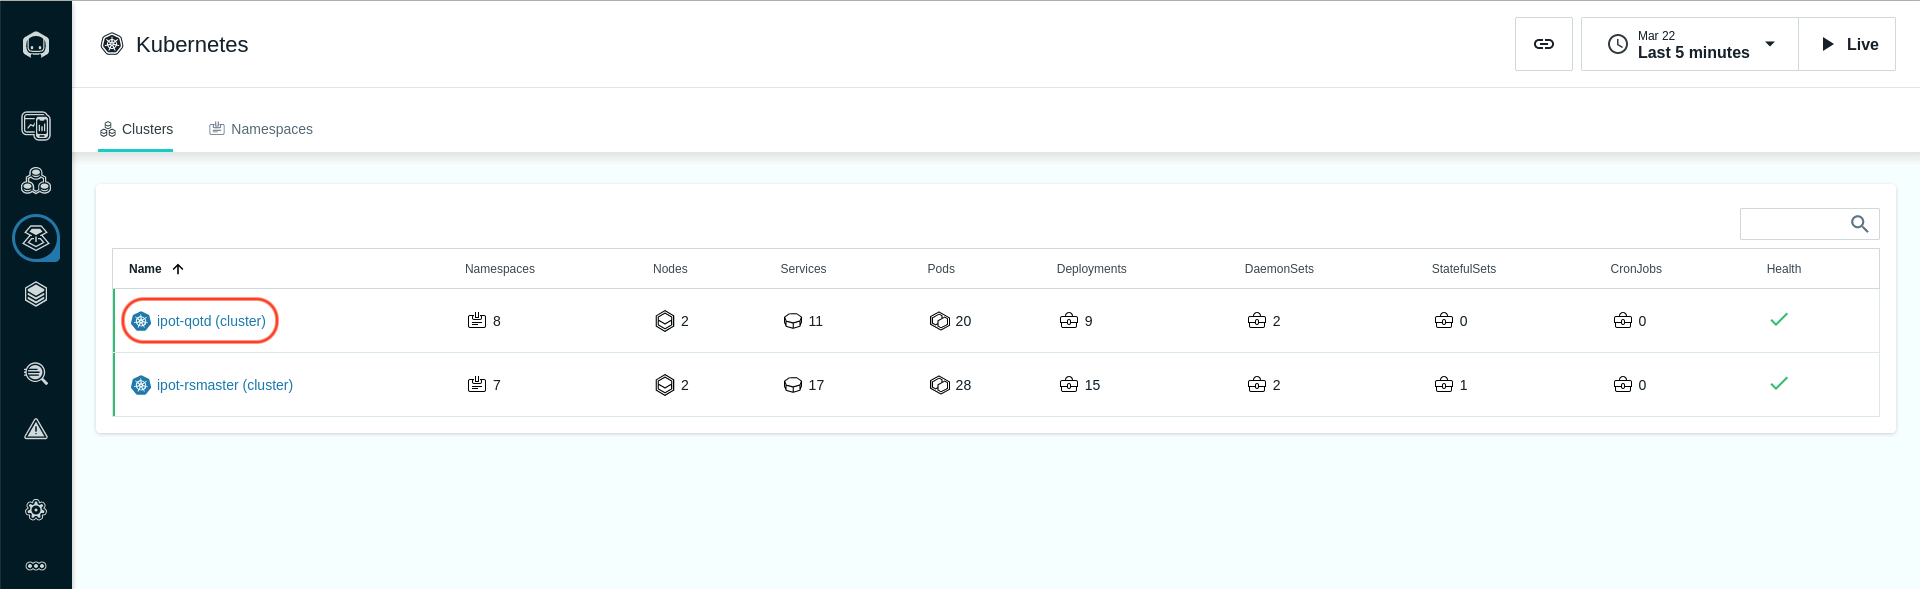
Here we selected the cluster named ipot-qotd
Assuming that your cluster shows up properly, click the cluster name to open the dashboard.
You should see a screen similar to the one below where you can see overall utilization of the Kubernetes cluster.
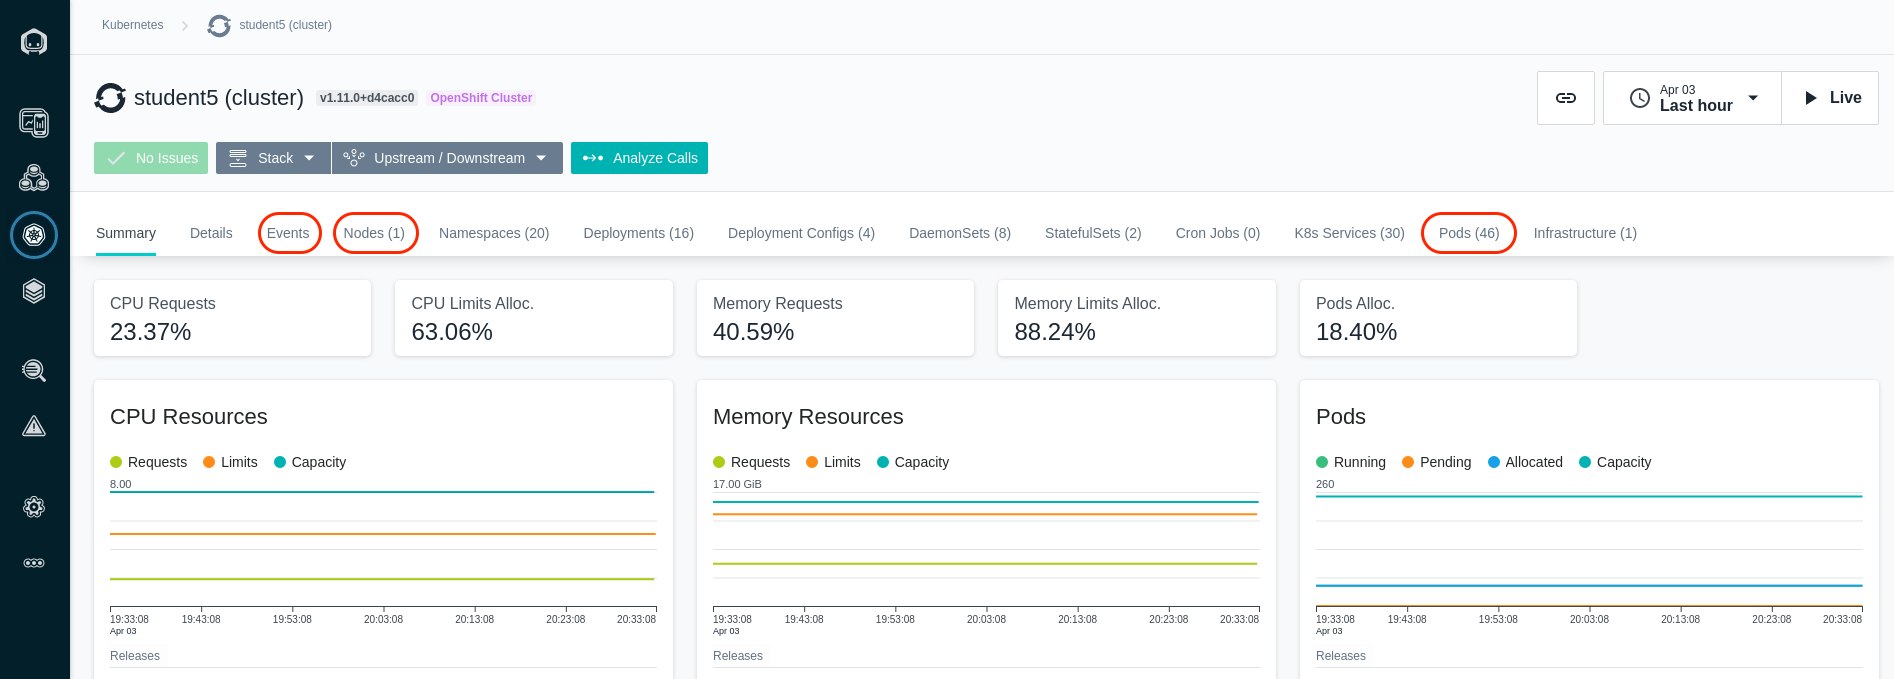
Select some of the other tabs to explore the Kubernetes monitoring. We recommend you look at the Events, Nodes, and Pods tabs. When you select the pods tab, you will see a list of all pods running within the cluster.
In the upper right corner, add qotd into the search widget. You'll notice that
it will filter the list to the pods related to the Quote of the Day application.
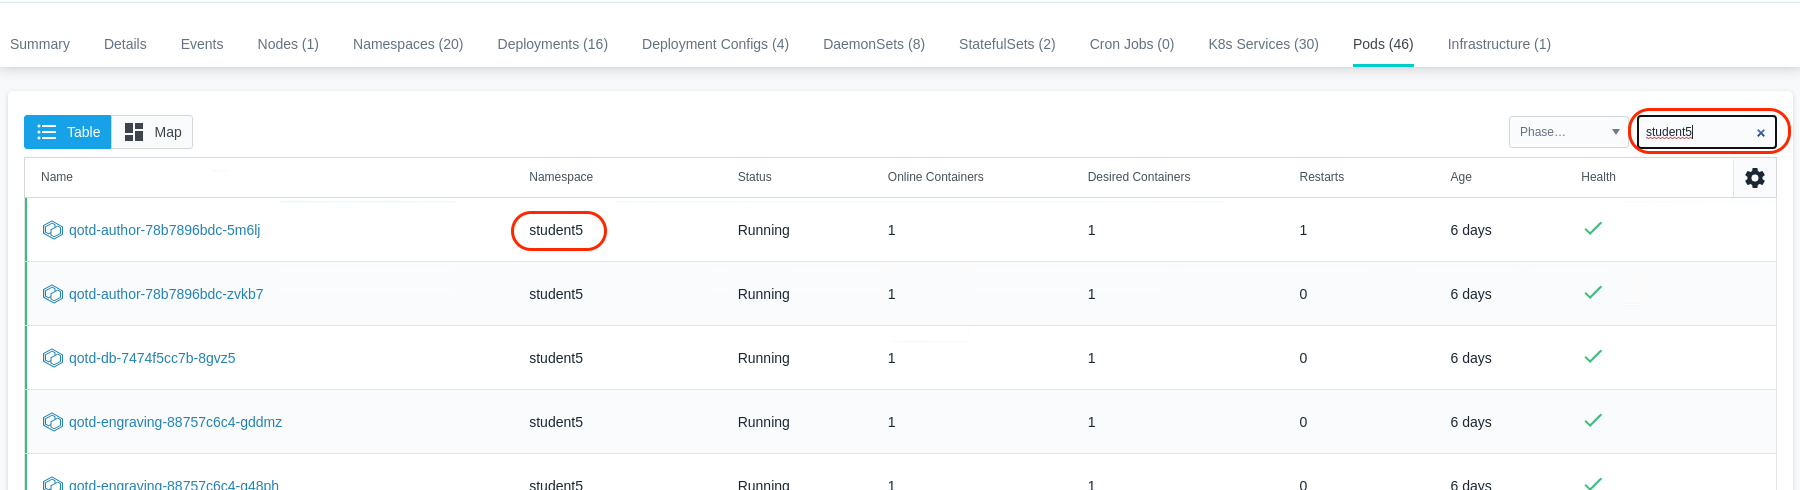
Click on one of the links on the left side and drill into the pod utilization details.
Explore the Infrastructure View
Next, explore the Infrastructure view. To do this, click on the "Infrastructure" icon on the left side.
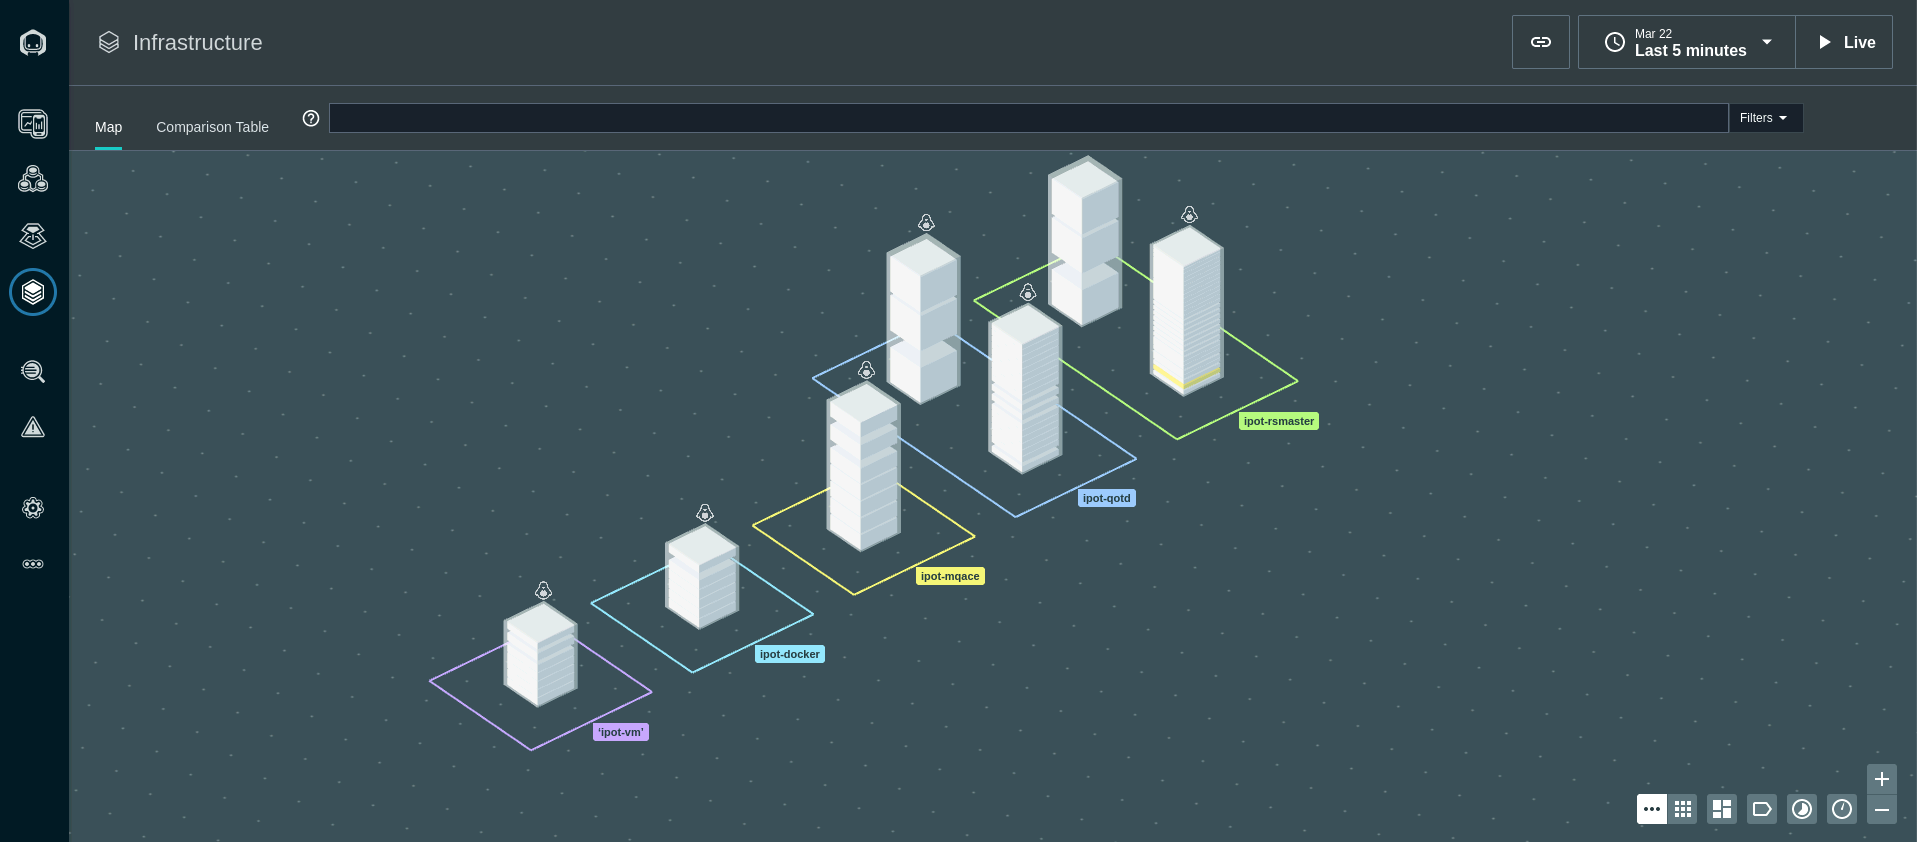
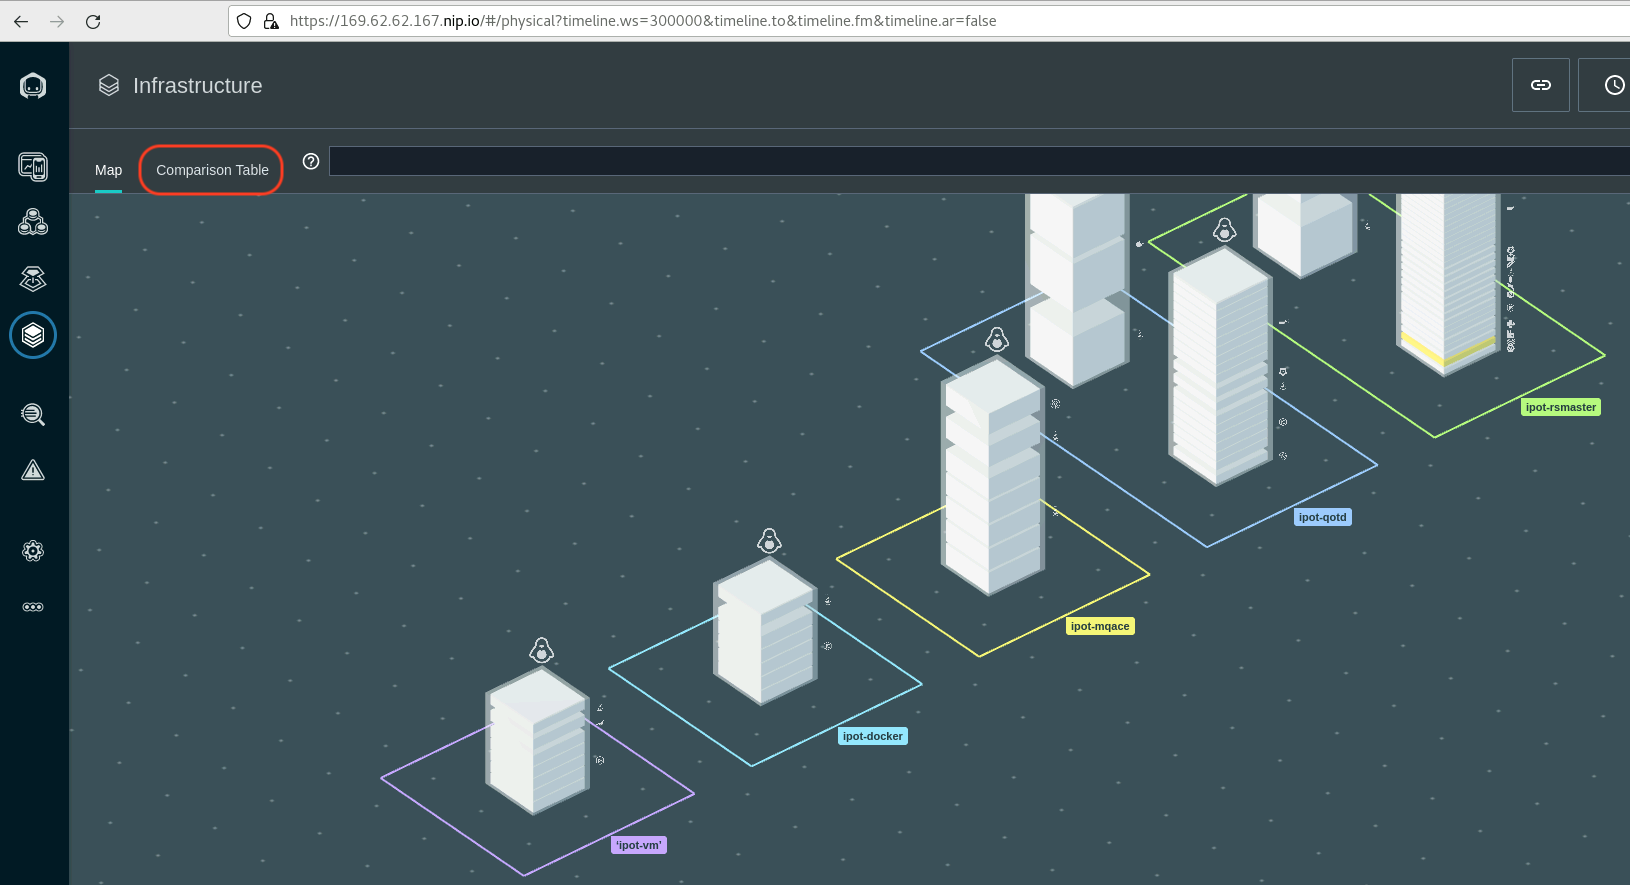
You'll notice that there is a square surrounding the "towers" with the zone names that you specified. The square is a "zone". If you recall, you specified a zone name when you performed the install of the Instana Agent. The QoTD application has components that are distrubuted across different zones and on different platforms. Refer to the architecture diagram in the Overview section to know more about the landscape
You should see a total of 5 hosts(7 hosts if you have also configured the Robot Shop cluster).There should be 2 k8s nodes for QoTD (zone:ipot-qotd),the ACE/MQ server(zone:ipot-acemq), 1 application vm node(zone:ipot-vm) and 1 appplication docker node(zone:ipot-docker) . If you see a host show up in the Undefined Zone, it means that you did not specify a zone name in the Agent configuration. If you cannot see 5 hosts (7 if you have the Robot Shop cluster) in your zones, then one of the Agents is not connecting properly.
In a large environment, it can be difficult to find the server or zone that you are looking for. Fortunately, there are a number of ways that you can search for things within the Infrastructure view.
In the bottom right corner, click on some of the icons and explore different ways of organizing and filtering the Infrastructure view.

Or, you can use the lucene query language in the filter/search bar at the top of the page. Before beginning the search, flyover one of the towers and identify the hostname of one of the servers. For example jam-stack-dal10-01-mqace.<fully qualified hostname>
- Click in the filter bar and select "Entity"
- A list will popup. Start typing host and you will see the list filtered to "host". Once you see the single entry, select host.
- Once you have select "Host", another list will popup. Select name.
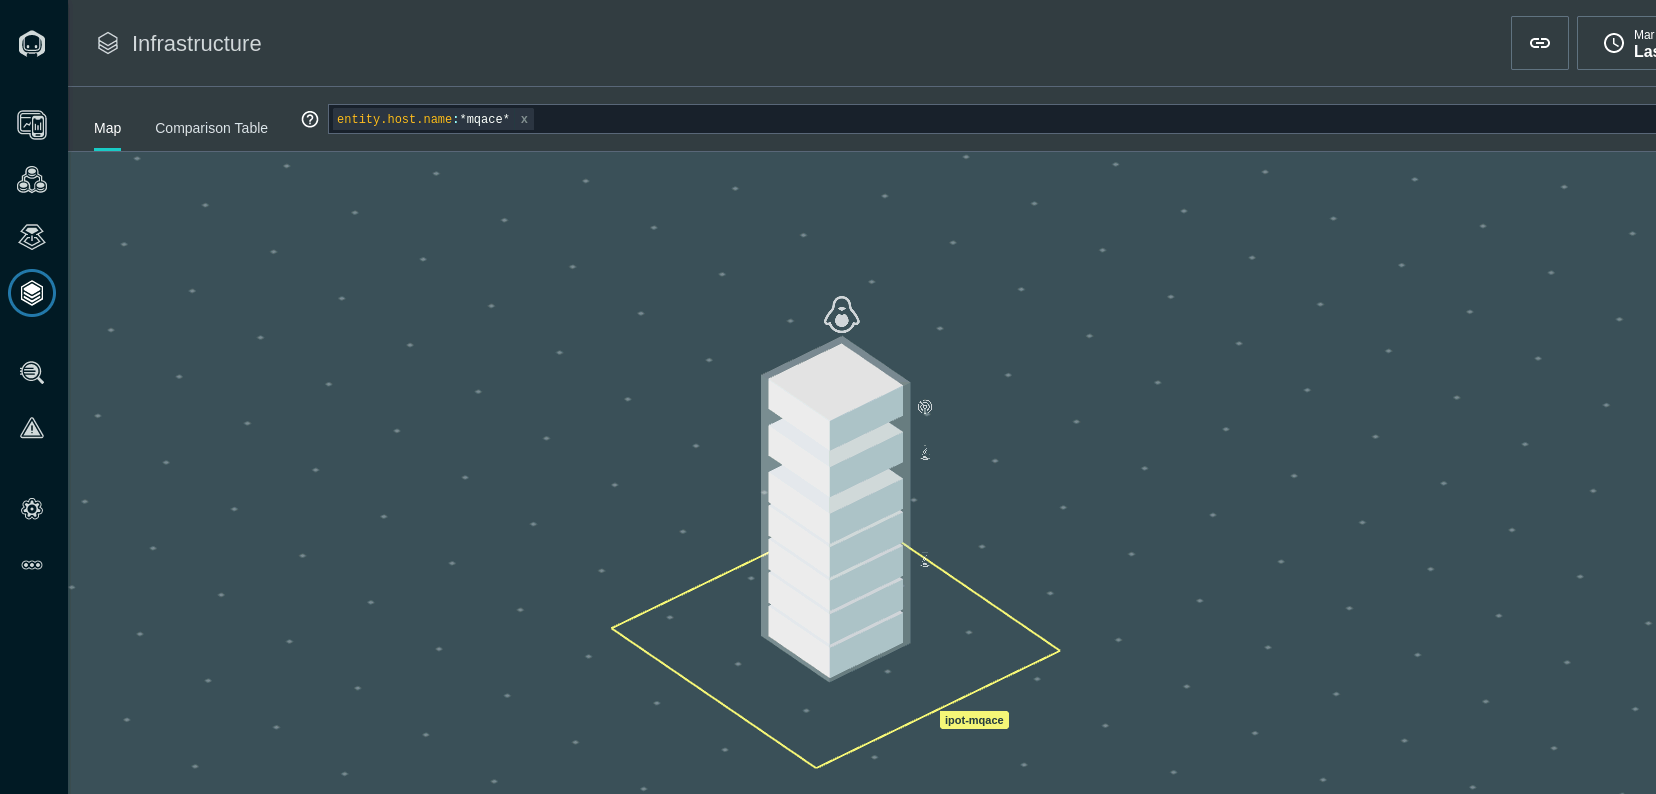
- Now, you will see "entity.host.name:". After the ":", you can do a wildcard search. For example "entity.host.name:*abc*". Type in a wildcard string that matches the beginning of the hostname you found earlier. In my example, I could specify "entity.host.name:*mqace*" to filter on the MQ/ACE server.
One you have specified the filter, you'll see that the infrastructure view is filtered to just a single server that matches your search.
There are many other types of queries that can be executed using the filter/search bar. For example, you can specify AND, OR, and NOT conditions. You can find detailed information on the lucene query language in the product documentation found here: lucene query language
Clear the filter at the top of the page by clicking on the X
Next, flyover the tower that represents the QoTD master node (HINT: Its one of the nodes in the zone ipot-qotd). These two towers are taller. They are taller because there are more discovered entities running on those servers.
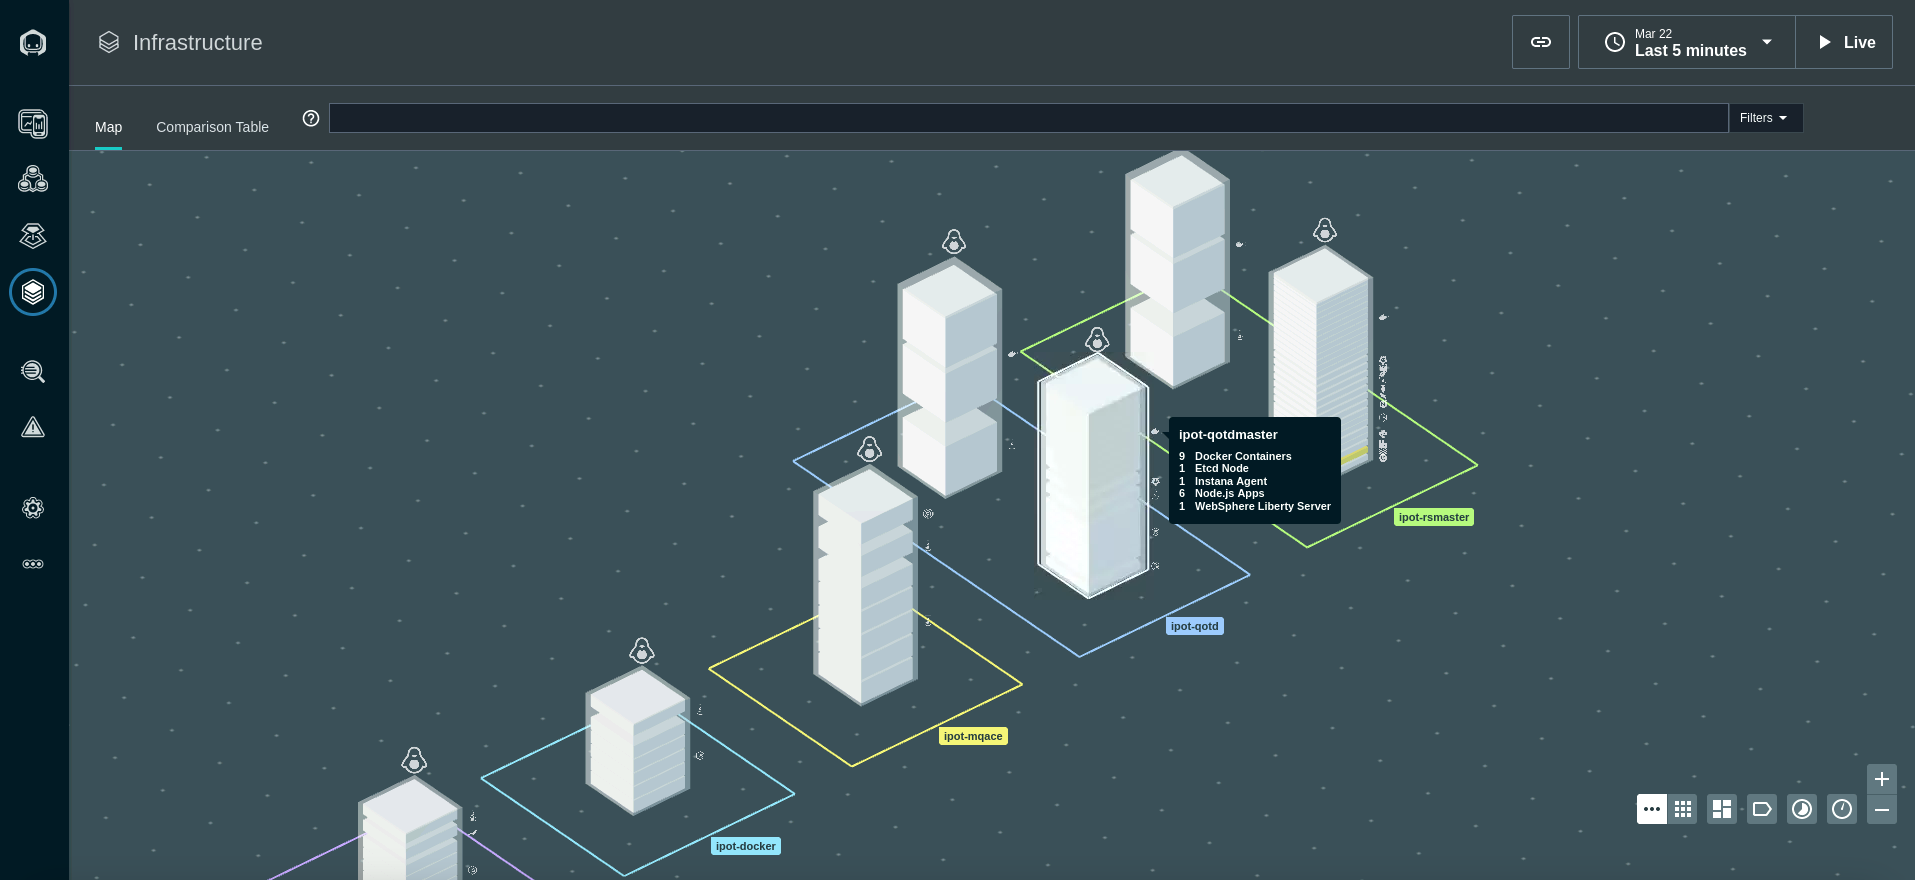
You'll notice that a number of components were automatically discovered and are instrumented for monitoring.
Next, flyover the ACE/MQ tower.
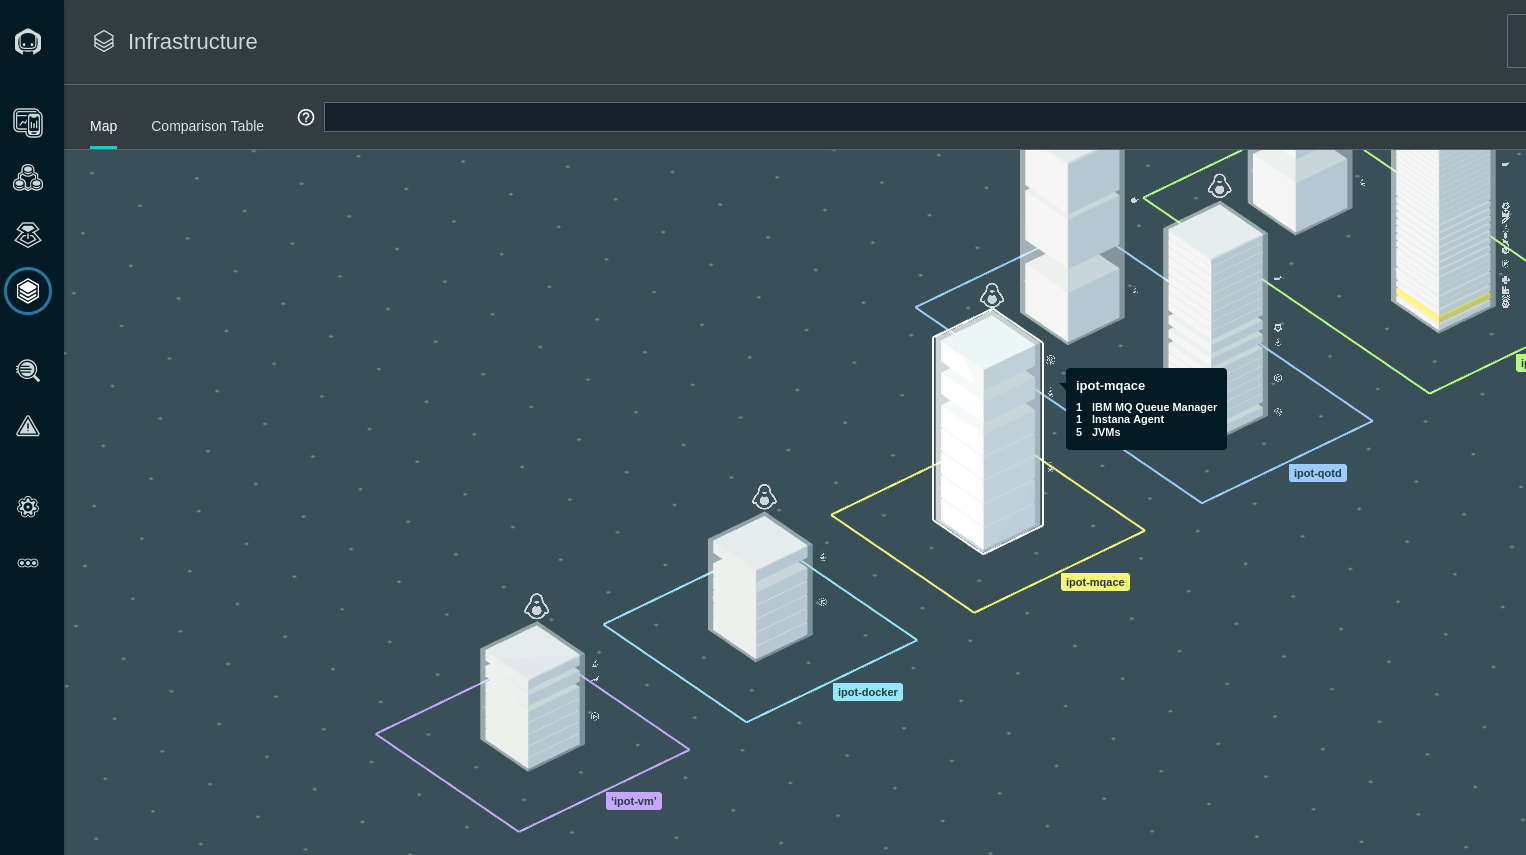
This is the ACE and MQ server. You can see the MQ and ACE components along with a discovered JVM, and more.
Next, click on the "Comparison Table" near the top of the page.
This table shows a sortable and searchable list of the Hosts that make up this environment. You can quickly find hosts consuming high CPU, high memory, or have poor health.
In addition, if you select where is says "Hosts", there is a dropdown list that allows you to see lists of JVMs, containers, etc.
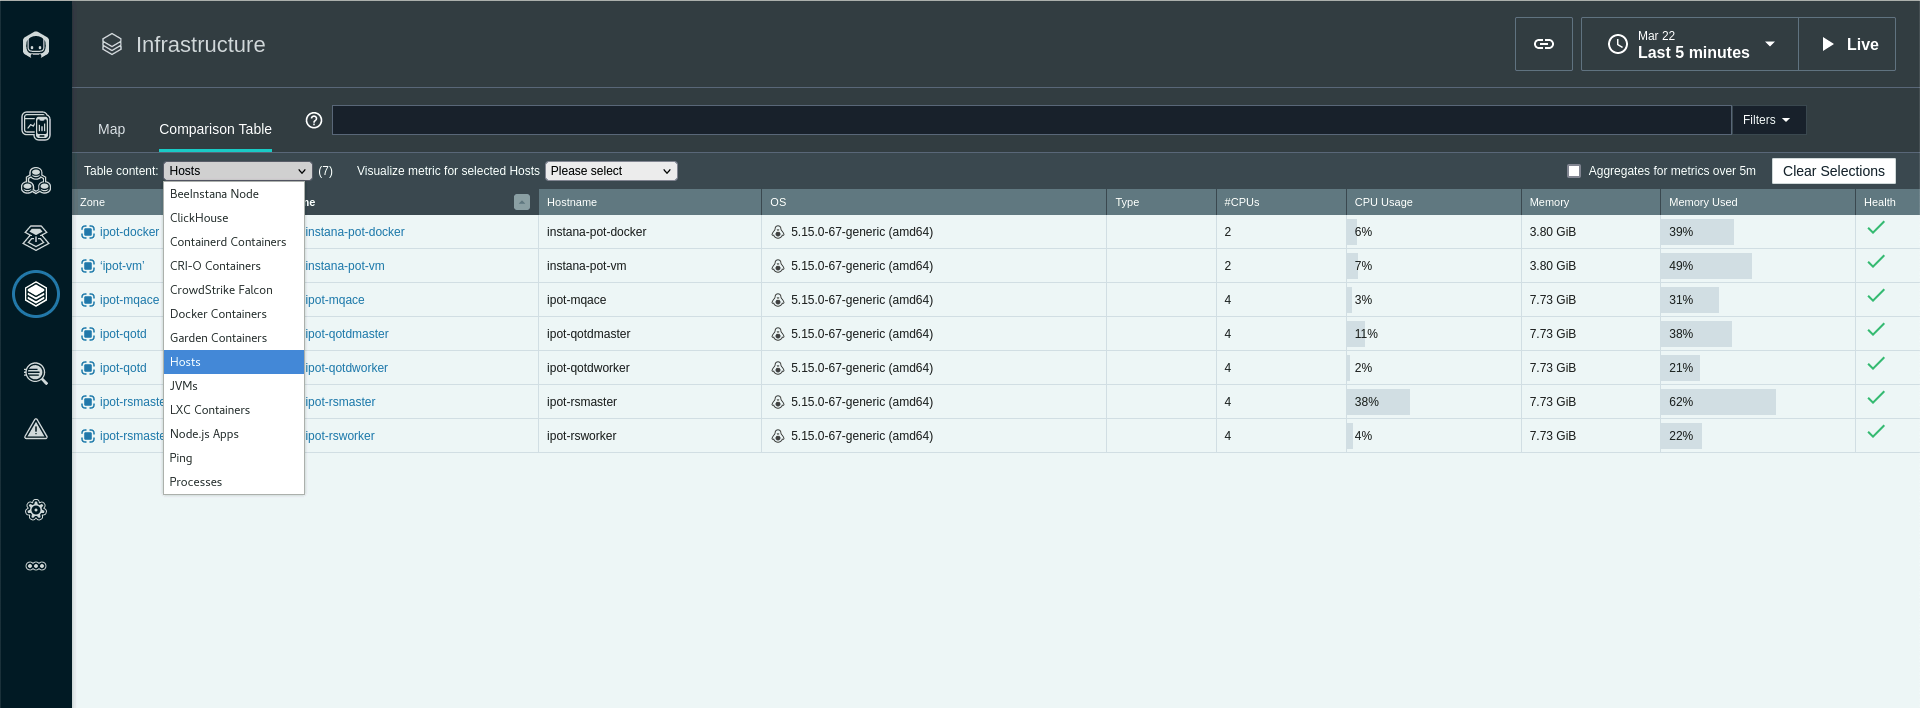
Change from "Hosts" to "Docker Containers" in the dropdown list and you'll see a complete list of containers and their utilization and health.
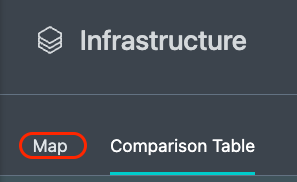
Switch back to the Map view by clicking on "Map" near the upper left corner.
Zoom in with the plus sign in the bottom right corner.

You'll notice that each tower is actually comprised of multiple pizza boxes. Each one represents an "Entity" such as an MQ Queue Manager or an ACE Integration Node.
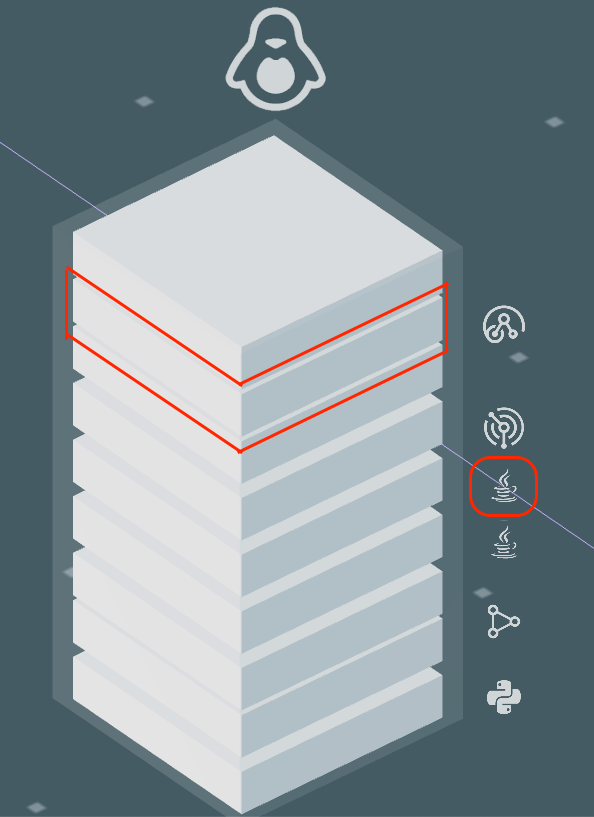
Flyover the ACE/MQ server again until you see a list of all discovered Entities. If you only see 1 entity, move your mouse to one of the corners of the tower. Once you see all of the entities, click your mouse. You'll see a dialog open
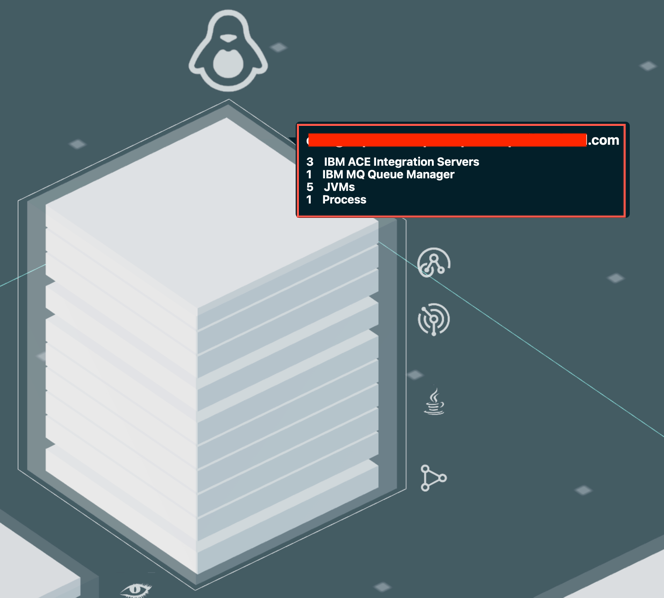
Use the scroll bar to scroll down. You'll notice that you see each of the types of Entities that were discovered. Expand the MQ entity type and you'll see the Queue Manager that was discovered.
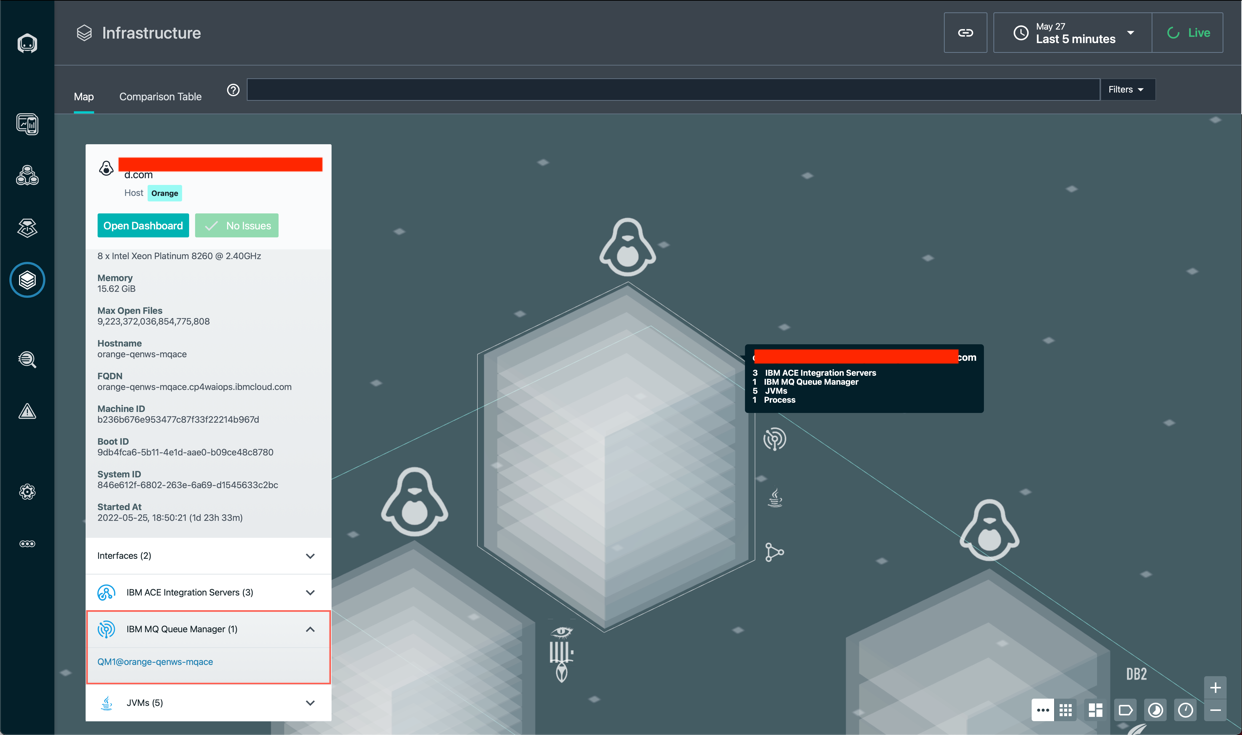
It is possible to click on either the "Open Dashboard" button or the links for the individual entities. If you clicked, you could navigate to either the Host operating system metrics or the specific middleware entity.
Click on the "Open Dashboard" button and we'll examine the Host Agent dashboard.
After you click on the button you'll see a screen that looks like this:
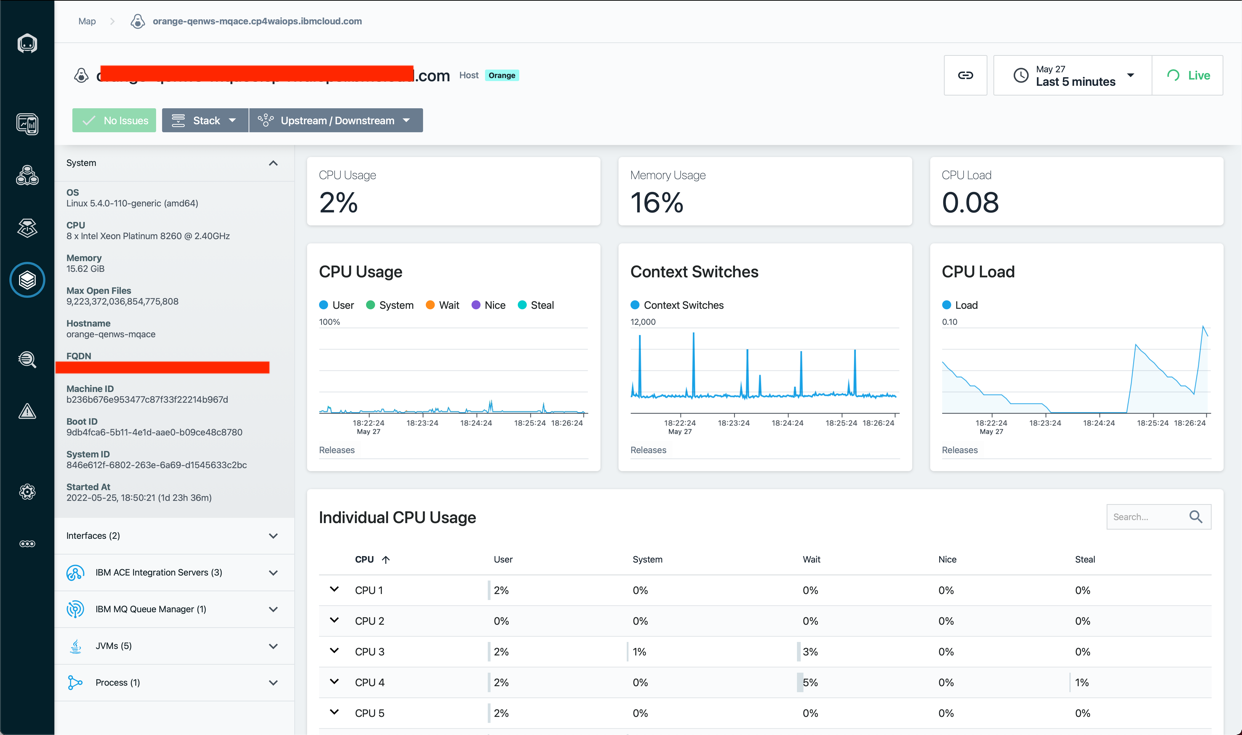
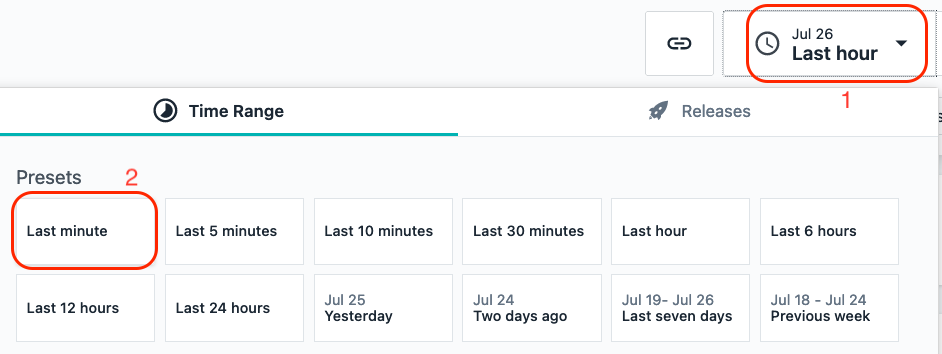
You can see fine grained metric data for the Host operating system. Most metrics are gathered at 1 second granularity. This can be very valuable in diagnosing problems. To see the 1 second metric data, let's shorten the time interval on the screen. Click on the time range dropdown in the upper right corner and select last minute. This will filter the data to the last minute of metric data.
Now, click the Live button in the upper right corner. This will show you Live data as it is streaming into the Instana server in near-realtime.

After examining the data, click the time range dropdown and select Last Hour to look at a more typical view within Instana.
Scroll down and explore the other metrics on the page.
As you scroll down the page, you'll notice a section on the left side of the screen that contains a list of Entity types that were discovered. This is the same list that you saw earlier on the Infrastructure view. By placing these links in context and leveraging the relationships that are discovered by Instana, it makes it easier to diagnose problems.
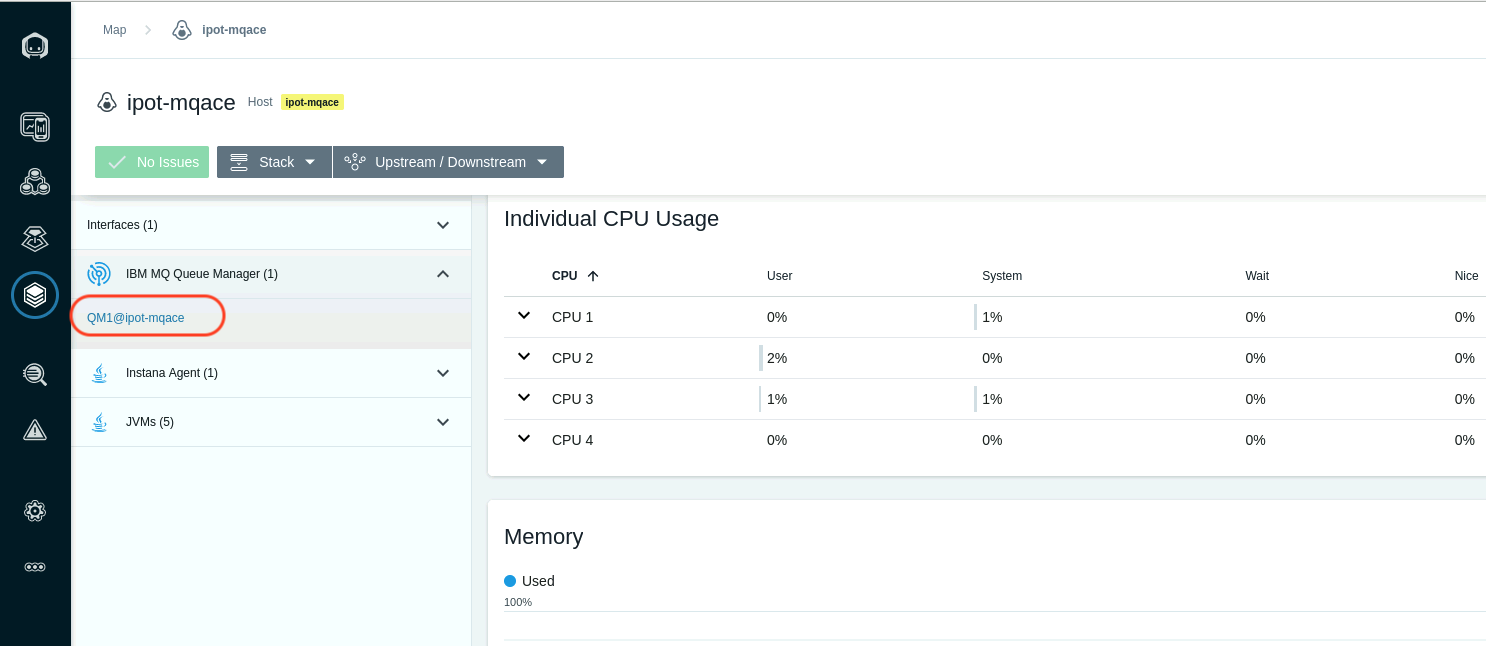
Expand the IBM MQ Queue Manager section and select the link for the QM1@<your-mqace-server> queue manager
You will navigate to the dashboard for the MQ Queue Manager. Scroll down the page and examine the metrics. There are many tables that contain links that would allow you to drill into the listener, topics, queues, channels, and more. Let's focus on the Channels. Scroll down to the table labeled "Channels".
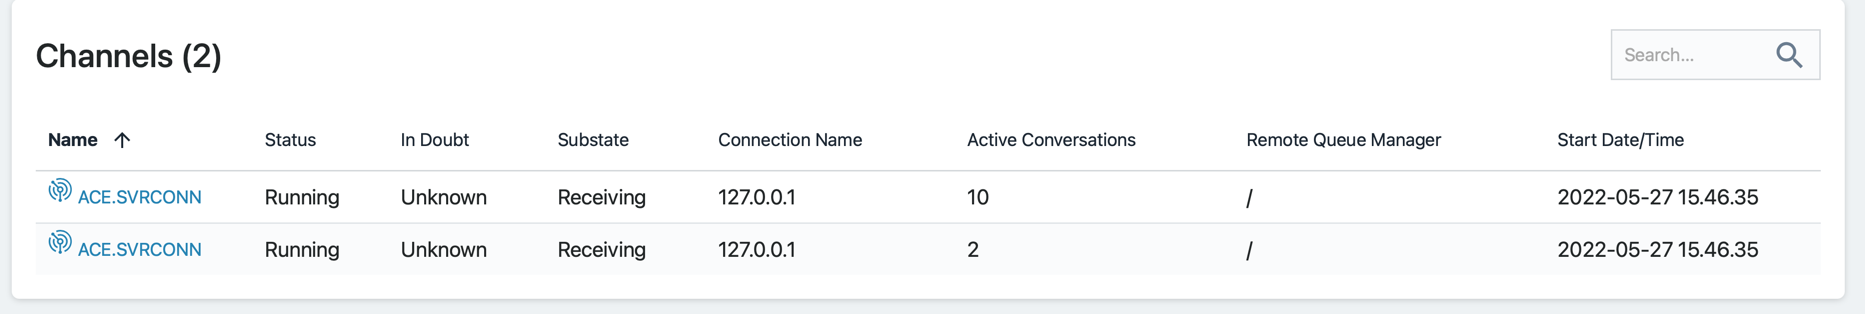
Click on the blue text on the left to drill into the Channel. Examine the Channel metrics on the page.
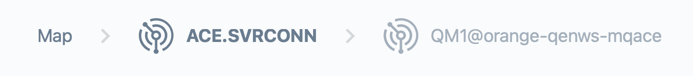
Next, look at the top of the screen. You'll notice that this is a breadcrumb that allows you to navigate back to where you were earlier in your navigation. It is also possible to use the back button in your browser.
If time permits at the end of the lab, you can explore some of the other elements within the MQ sensor or other middleware such as ACE.
Create an Application Perspective for QOTD
Before we can investigate Applications within Instana, we need to create an Application Perspective. This section describes how to define the Application Perspective for the Quote of the Day application.
Application Perspectives allow you to group together a number of different services and endpoints into dashboard that shows the health and performance of a business application. In this section, you will create and Application Perspective for the Quote of the Day application.
On the left hand navigation, select "Applications". You will see a screen open up that contains a list of all applications that are defined in the environment. Initially, this list maybe almost empty showing just All Services generic bucket.
The next thing you are going to do is define an application. You will see an "Add" button in the bottom right corner.

Click the "Add" button
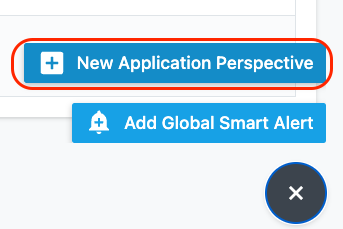
A dialog will open with two options (one if Smart Alerts feature is not enabled yet on your server). We'll examine the "Global Smart Alerts" in the Administrative section of this lab. For now, click on the "New Application Perspective" button
Swich to the Advanced View Mode in the upper right corner. Then complete the definition to look like below. As you add filters, you'll notice that Instana automatically populates the fields like the service name. As you add filters, notice that you need to add a combination of AND and OR conditions to achieve the results that you want.
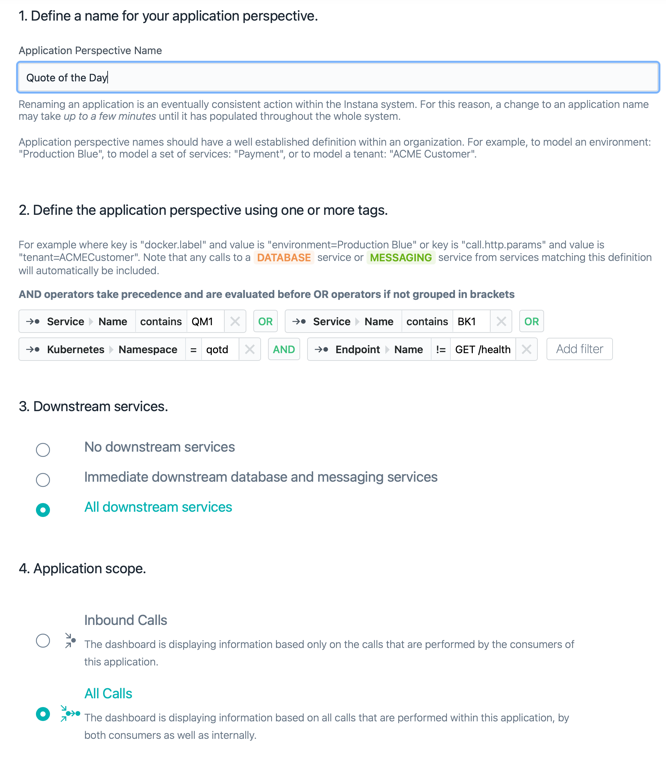
What this Application Perspective is doing is the following. We are including the MQ Service by matching any service that contains the Queue Manager Name of QM1. We're including any service that includes the name of our ACE Integration Server named BK1. We're including any transactions that are in the qotd kubernetes namespace where the Quote of the Day application is installed. Using namespaces makes it very easy to build Application Perspectives for cloud native applications. Finally we added a filter to filter OUT any trace that has an endpoint name of GET /health. The GET /health requests are the readiness probes (heartbeating) that happens within kubernetes to ensure the pods are healthy. These transactions are not part of the application, so we want to exclude them.
Note: In these lab environments, the systems are fairly slow and the service
names, kubernetes namespace, and endpoint name may not be available yet. For
example, if you start typing kubernetes and can't find it, you can use an
alternative method of defining the application. Add a filter with Service->Name
contains qotd as shown below 
You have now created an Application Perspective. In the next section, you'll explore the application (it can take few minutes before the data for application is populated).
Explore the Application
After creating the application, your screen should have automatically changed context to show the Application Perspective that you just defined.
Initially, you probably won't see any metrics on the screen. In the upper right corner, click the "Live" button and within a short amount of time you should start to see metrics in the widgets.
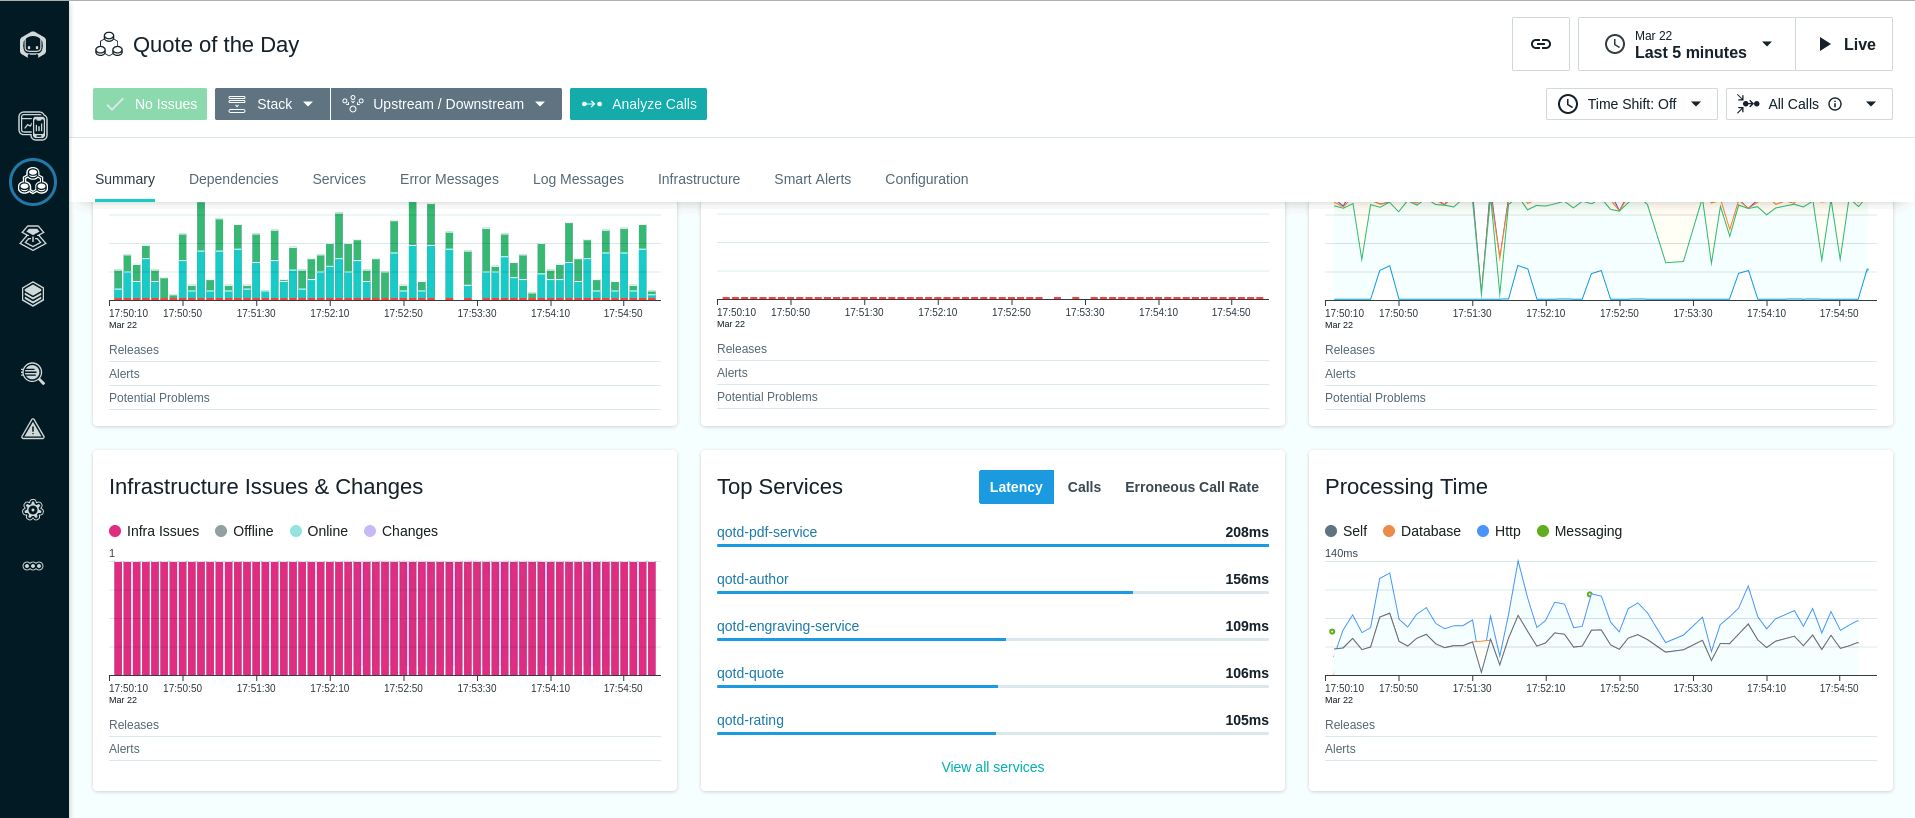
On this page you can see the golden signals which include transaction volumes, the number of erroneous calls, and latency. You'll also see the top services that make up the application.
You'll notice a number of tabs across the top of the screen. Explore these tabs. In particular, let's take a look at the "Dependencies" tab.
Click on the Dependencies tab.
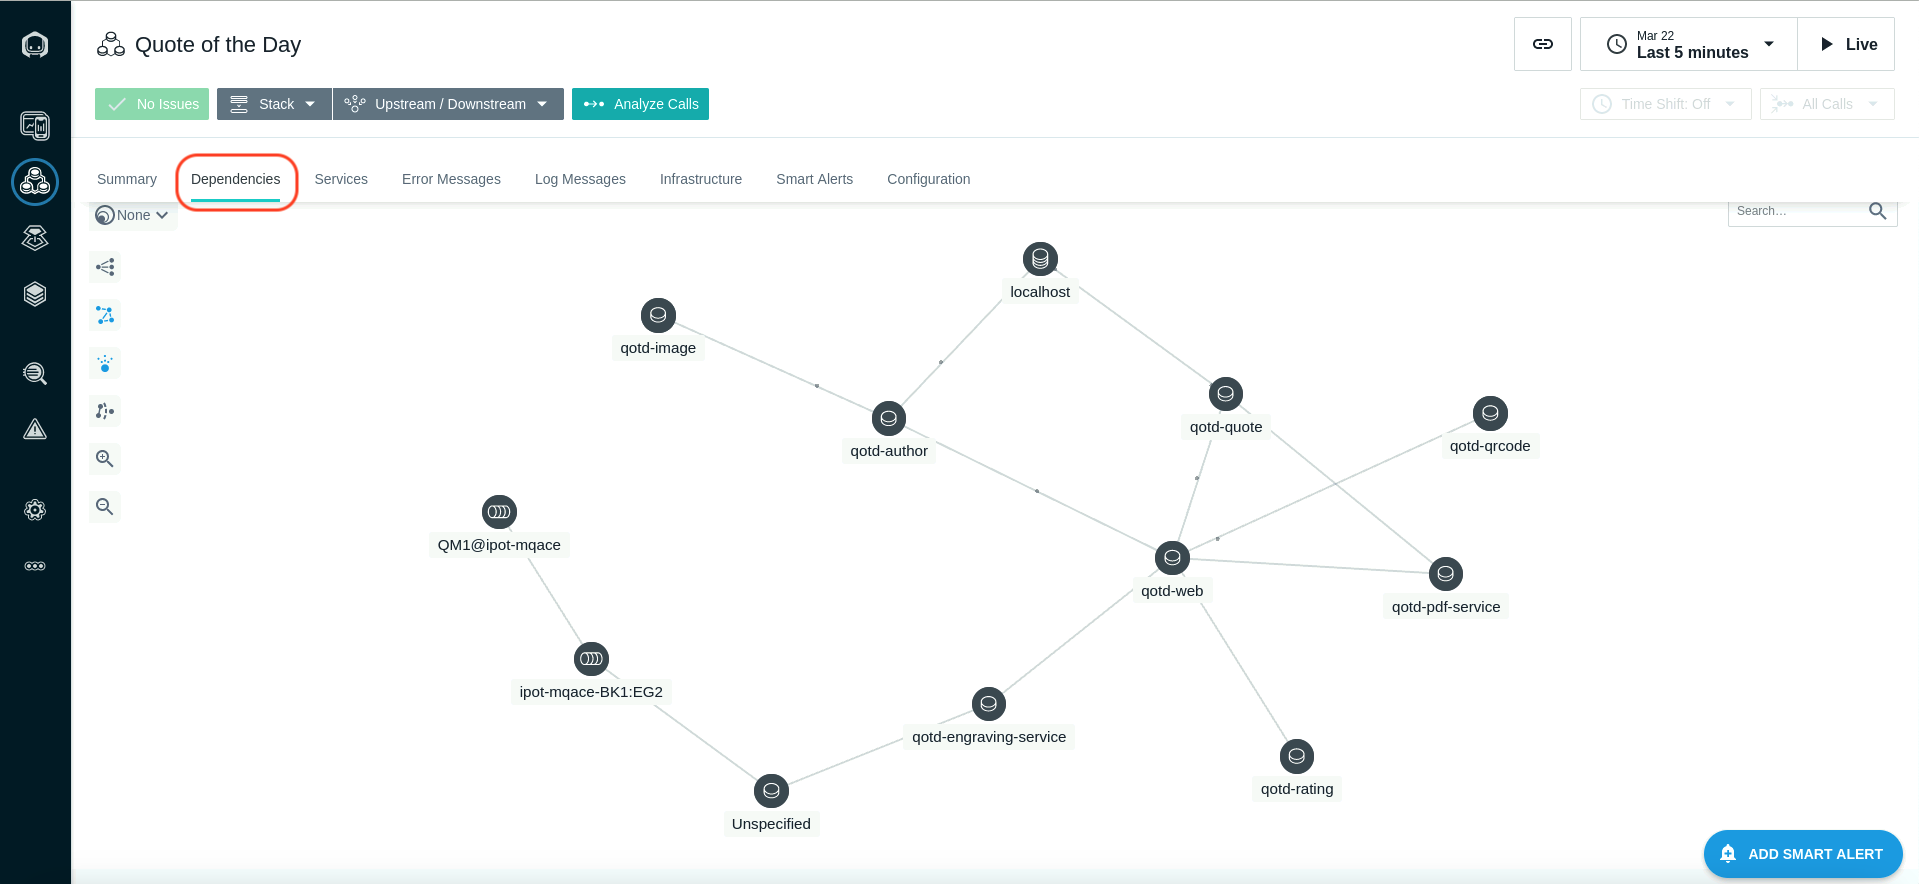
On the dependencies tab, you'll see a full topology of the application services. This topology is discovered automatically. You can see transactions flowing between the different nodes in the topology. Most of these services are node.js based cloud-native services. There should be also be a node with a name that ends in BK1:EG2. BK1 is the ACE Integration Node and EG2 is the ACE Integration Server. The QM1 node in the topology is the MQ Queue Manager named "QM1".
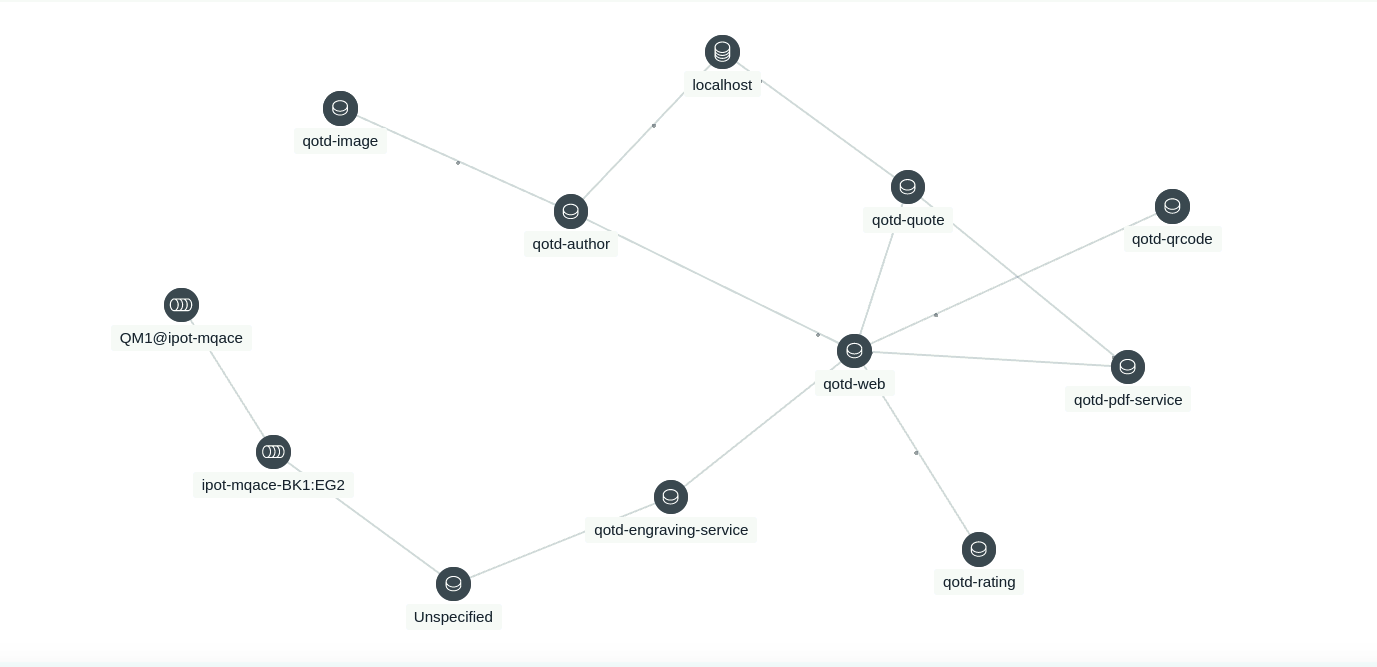
Fly your mouse over the QM1 node. Flying over any node in the dependency graph will show you a summary of the traces going through that service. You'll see the percentage of calls that are erroneous and the latency of the calls.
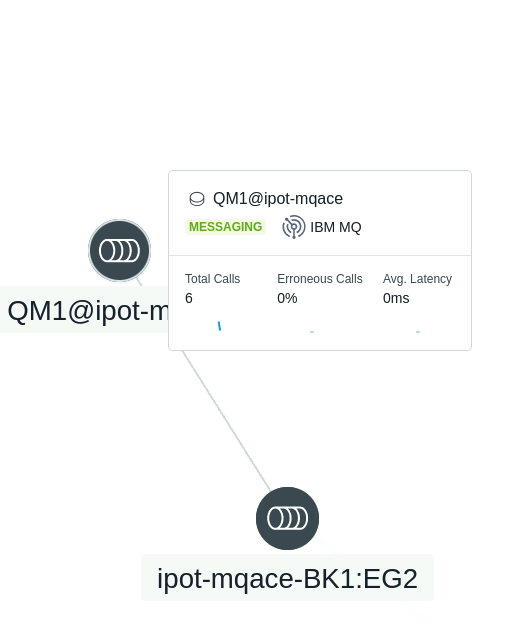
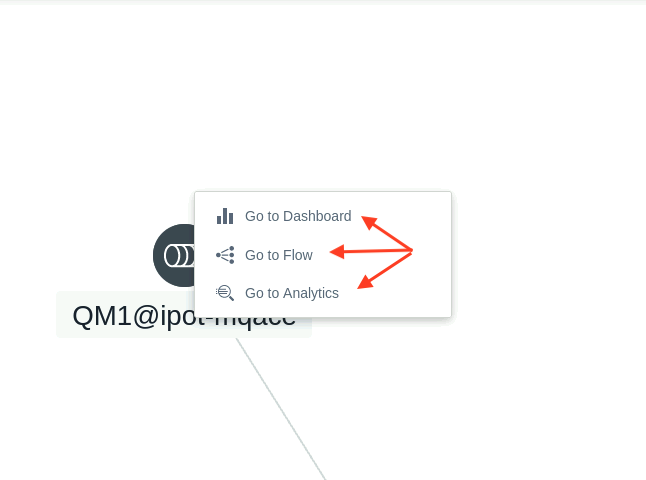
Click on the "QM1" node. Notice that there are 3 options that would allow you to navigate to the MQ dashboard, the transaction Flow within MQ, or analyze the transaction calls through MQ. For now, we'll skip this navigation, but we suggest you explore those options later.
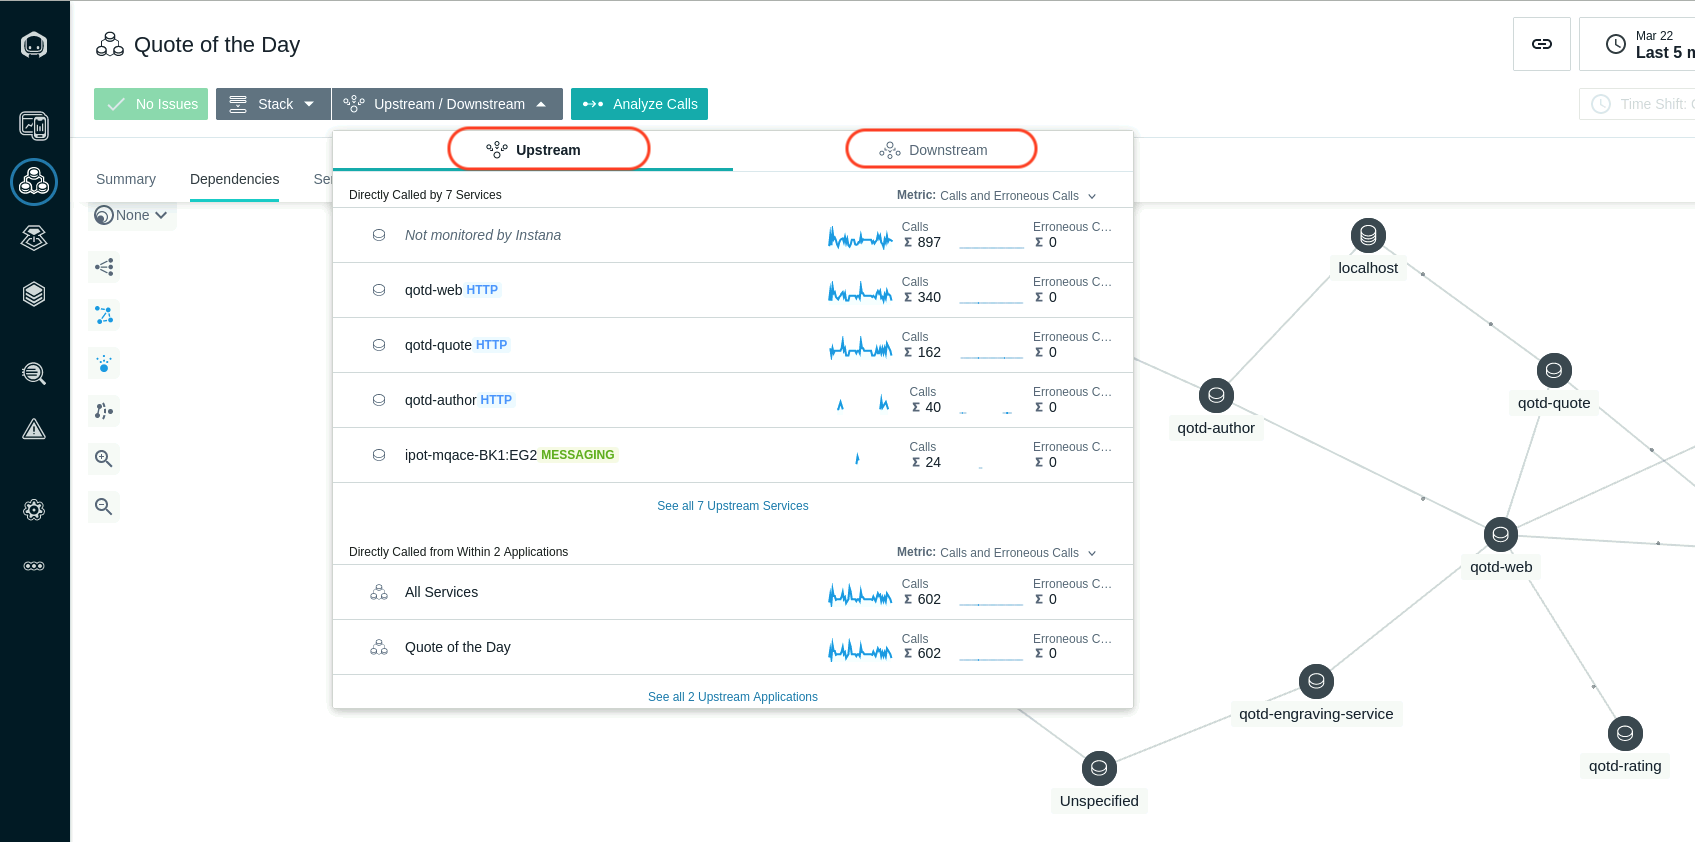
Click on "Upstream/Downsteam" near the top of the page. This will allow you to see a list of Upstream and Downstream services for the application.
Click on "Stack" where you can view the Application, Kubernetes, and Infrastructure stack that makes up the application.
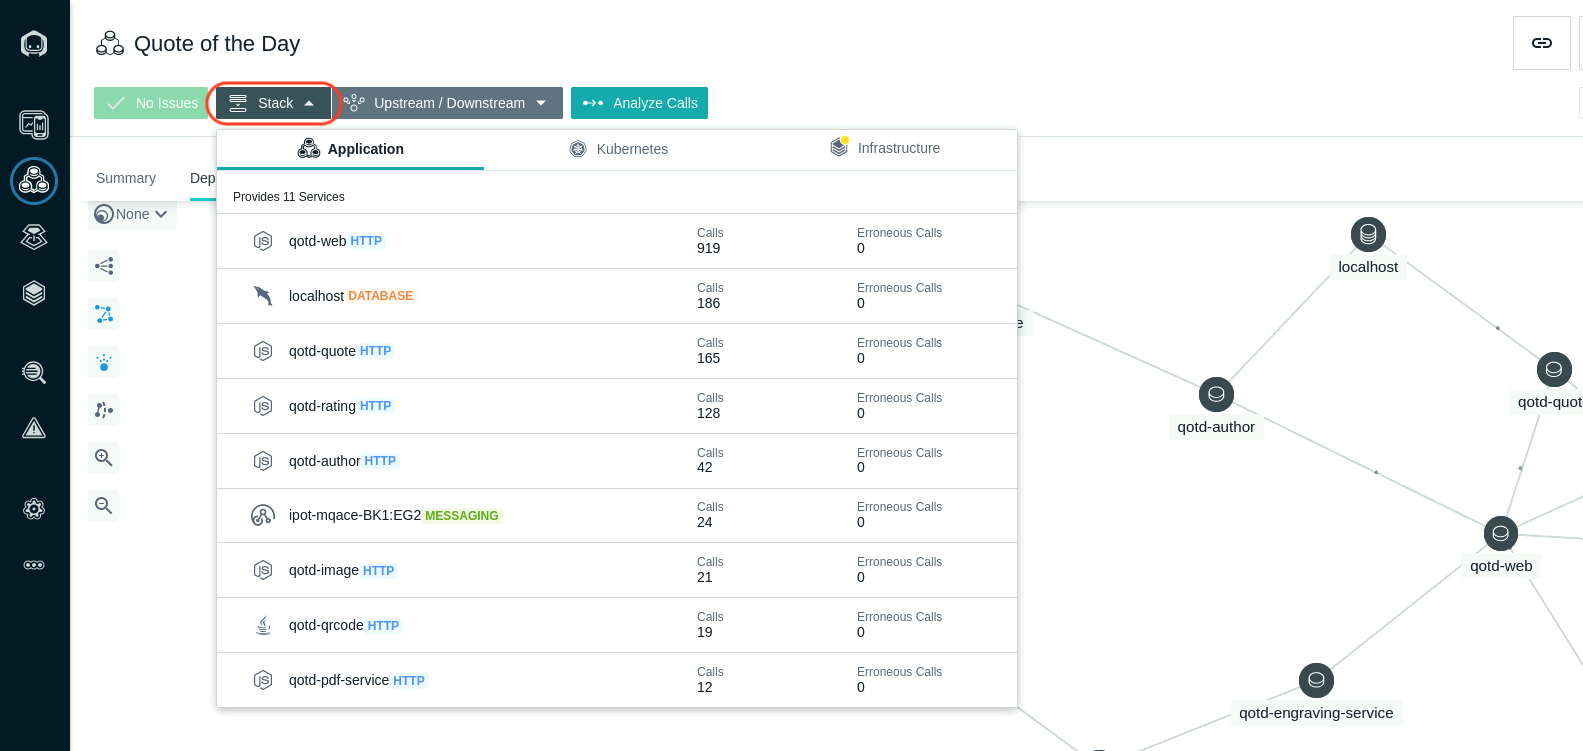
All of this contextual and relationship data helps you analyze and debug you applications to get to root cause as quickly as possible. In addition, Instana's built analytics uses this data to automatically group multiple related "Events" into a single "Incident" for diagnosis.
Close the Stack dialog by either clicking on the Stack button or somewhere else on the background of the Instana GUI.
Note: There are a few other tabs on this screen that you can explore on your own. For now, we're going to focus on the Services.
Click on the Services Tab
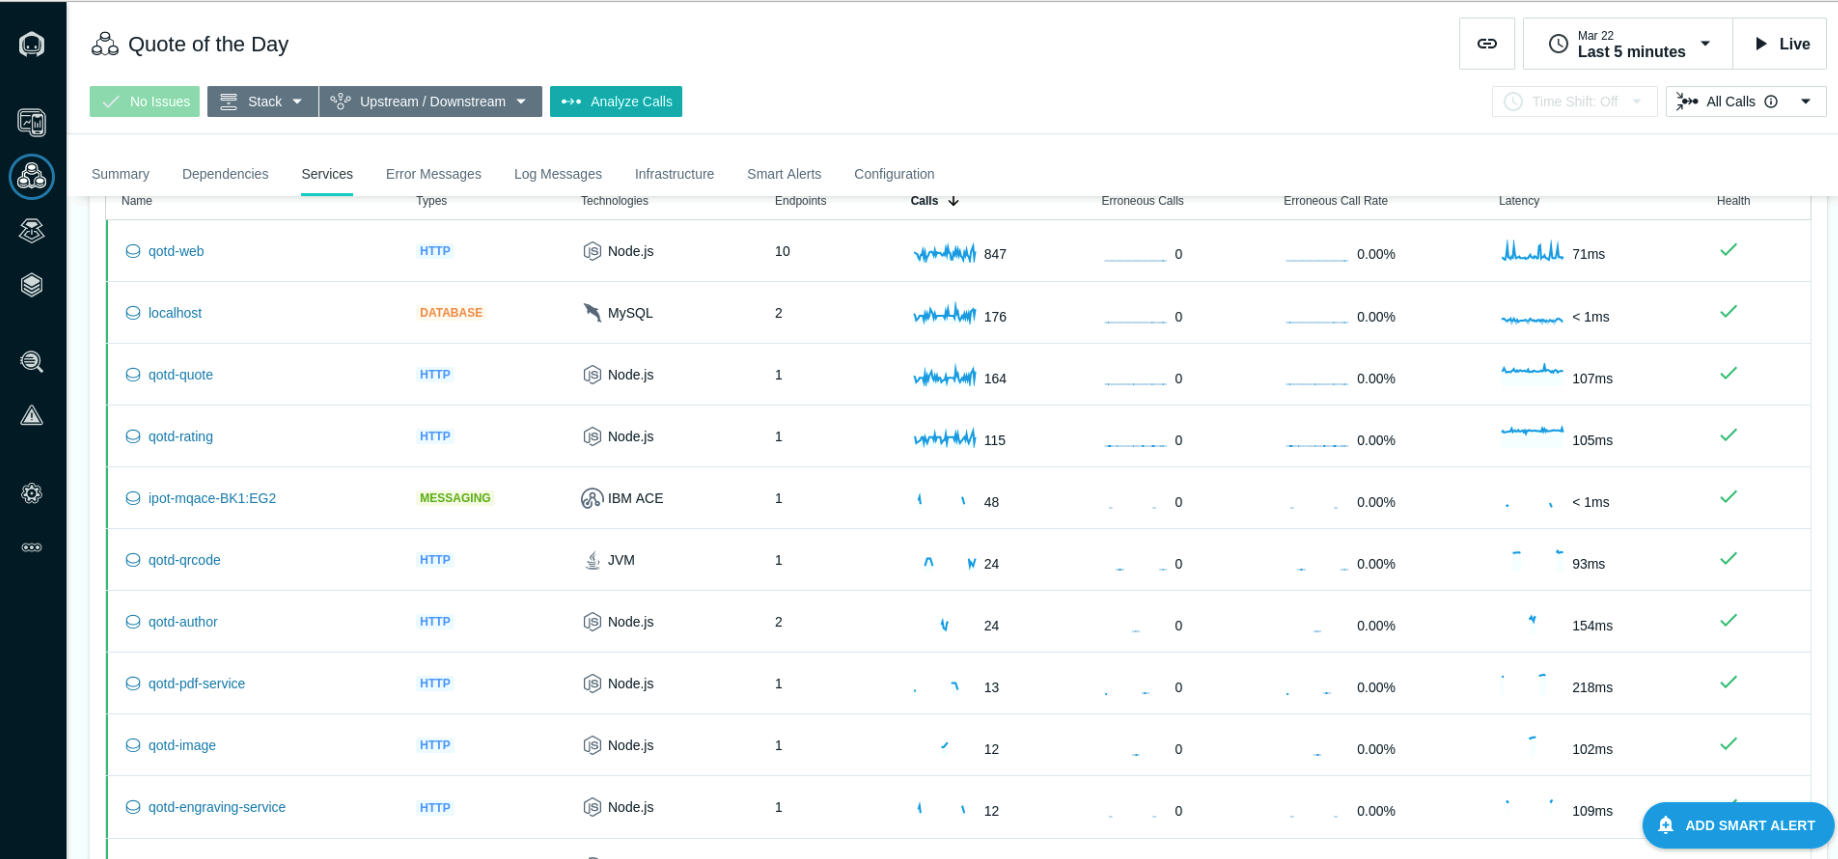
You will see a list of services that make up the application.
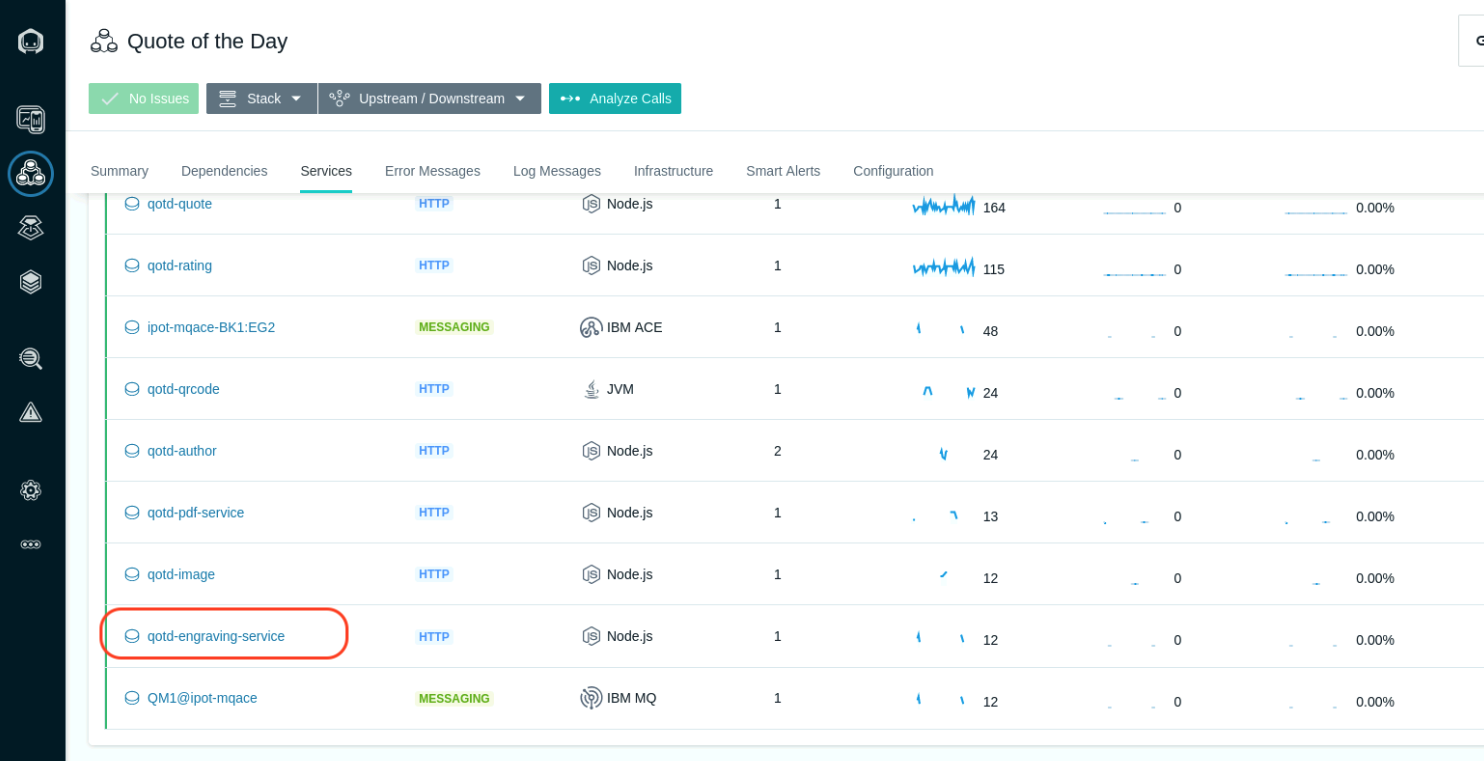
Scroll down on the page until you see the "qotd-engraving-service" .
Click on the qotd-engraving-service link on the left Column. The qotd-engraving-service is the service that calls and ACE flow and then puts a message on the MQ queue. We want to explore this service in more detail.
You should see a page showing the transactional data filtered down to just the qotd-engraving service.
Click on the "Analyze Calls" button to analyze the individual transactions that are executing within the "qotd-engraving" service.

This will take you to a screen showing all of the different types of calls taking place within the qotd-engraving service. At the top, there is a summary of all calls in terms of transaction rates, return codes, erroneous calls, and latency.
On the right side, click the arrow to expand the list of qotd-engraving "POST /order" calls. Instana is capturing 100% of the transactions so that you don't miss intermittent problems that might be occurring in the environment.
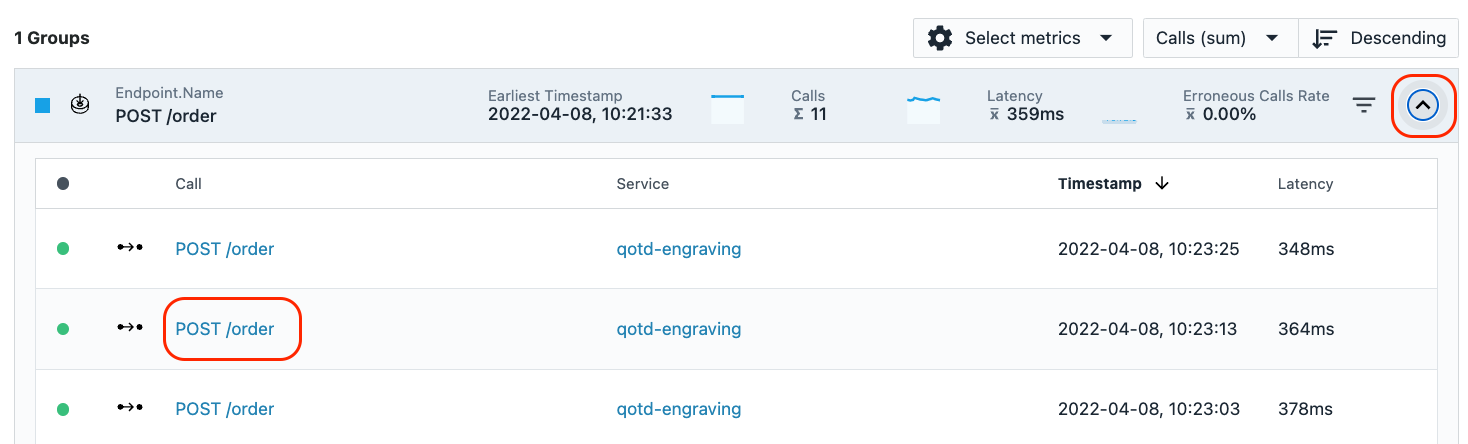
Select one of the requests
You are now looking at the tracing data for a single transaction. At the top of
the screen, you will see a summary of the latency, sub-calls and timeline. On
the right side of the screen, you'll see the details and stack trace.
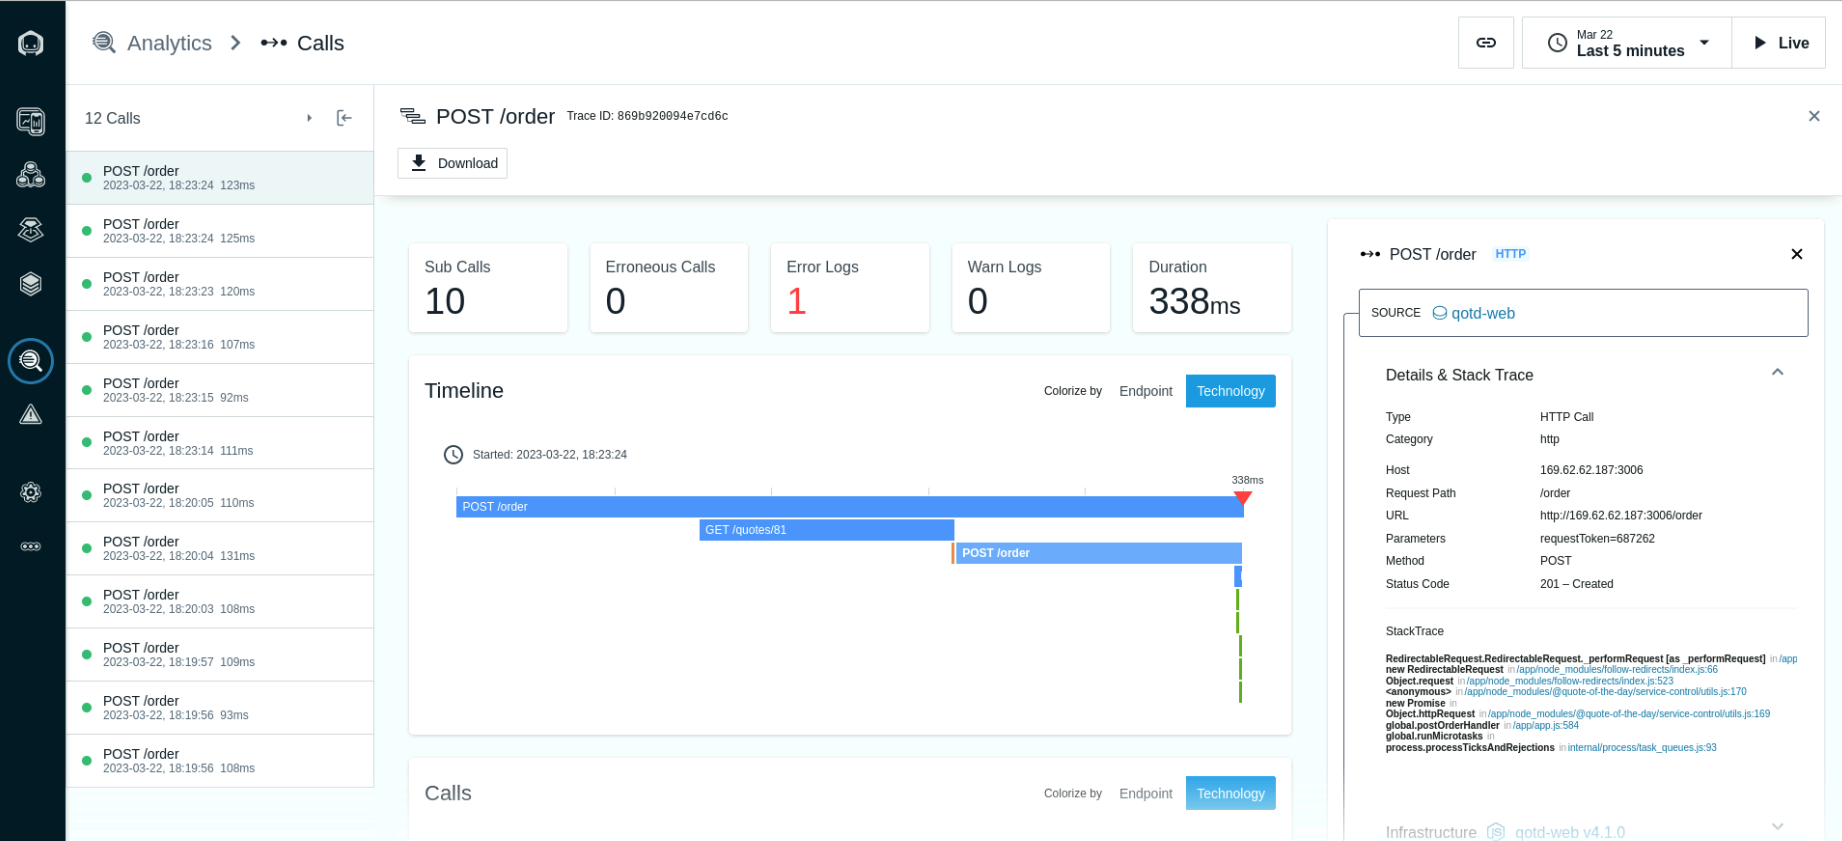
Scroll down and you will see the service endpoint list
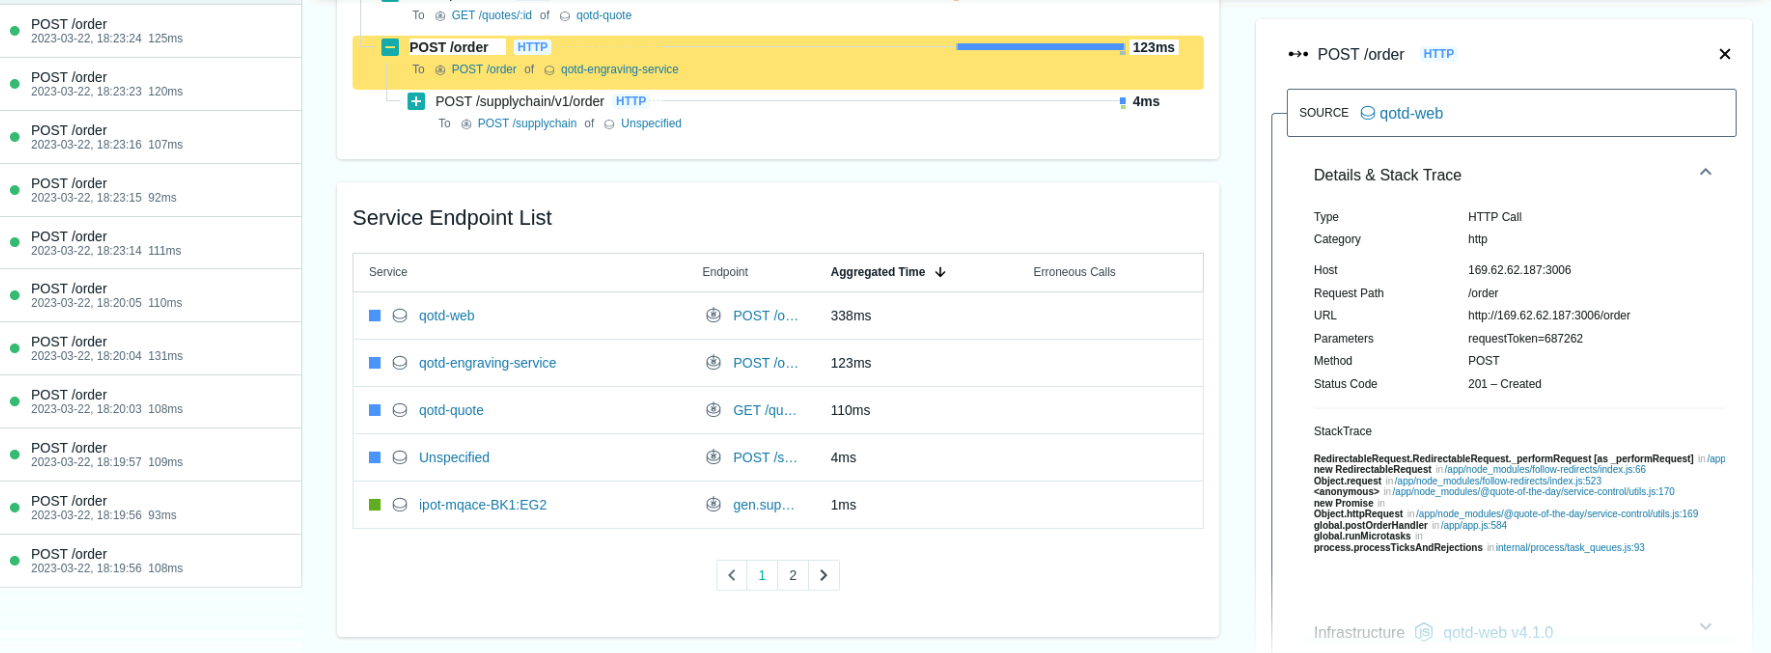
Finally, scroll to the section of the screen where you will see a detailed call stack. The call stack gives you the timing and sequence of the call going through the application.
Note: If errors were captured in the logs, they would be shown at the bottom of the screen, below the call stack.
If you select the text on the left or the timeline bar, the "Details & Stack Trace" context will change.
Explore the different types of calls going through this transaction by selecting the individual call. When you select an entry, examine the detailed information on the right.
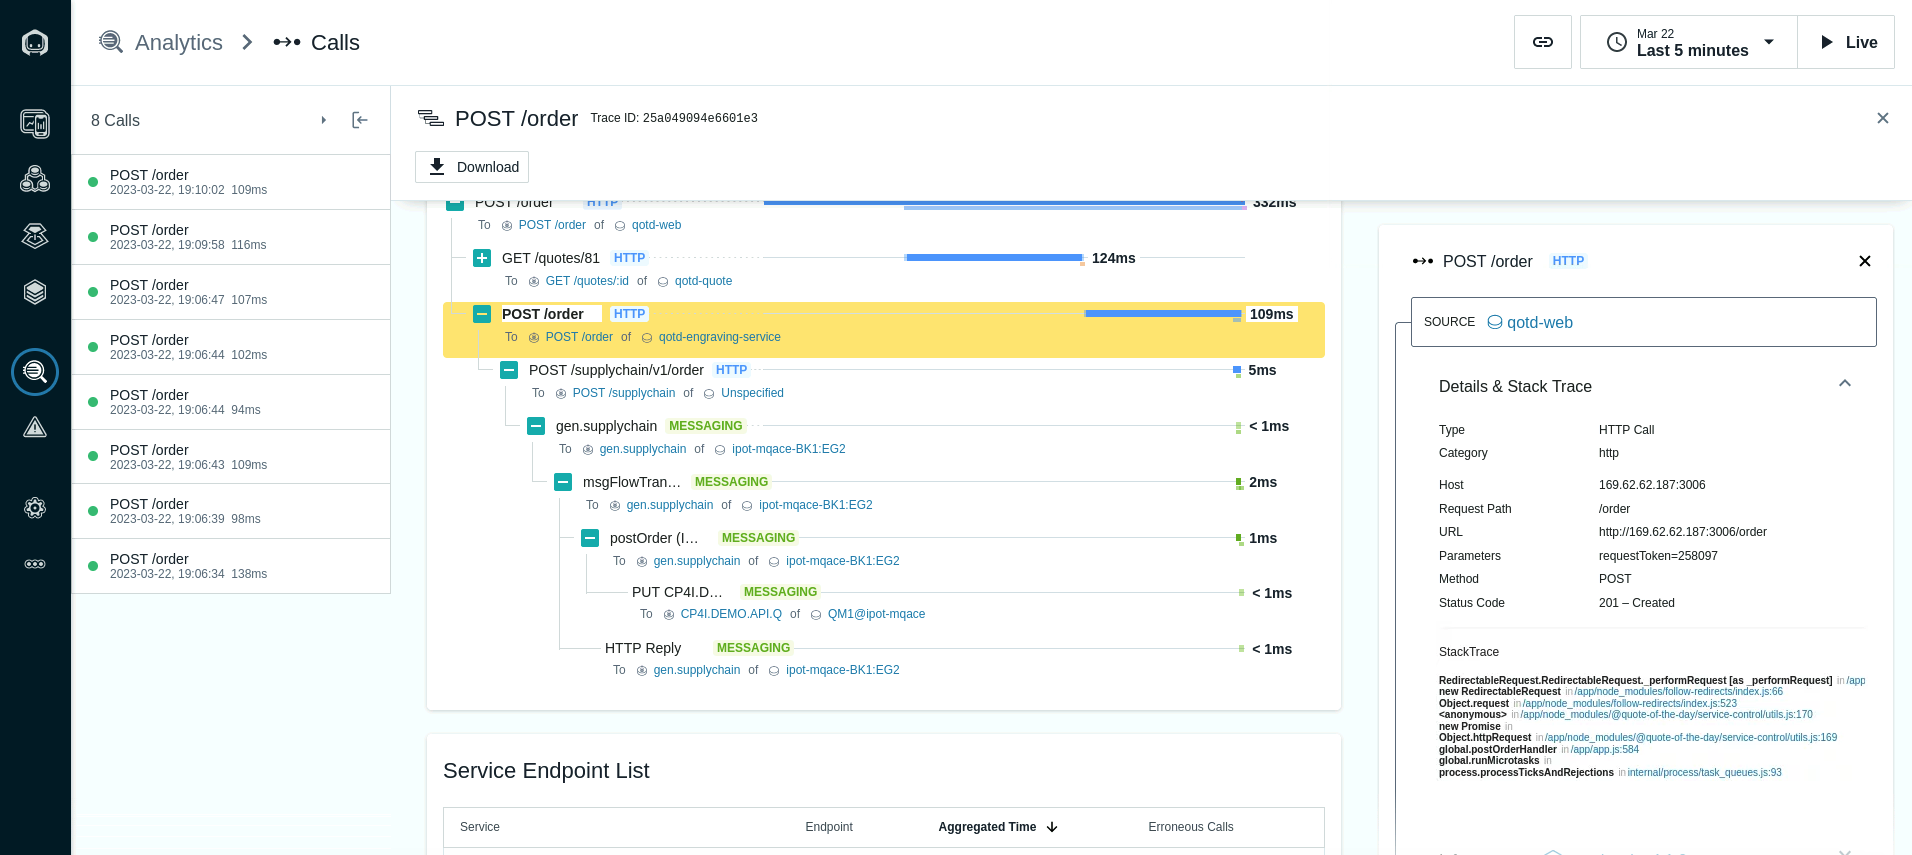
You should notice that different request types are color coded differently. Blue represents the HTTP requests going through an App Server or java process. Orange represents a database call. And green represents a messaging call (ACE and MQ).
When you select the Node.js App Server requests, you'll see the StackTrace on the right hand side. Within the StackTrace, click one of the URLs.
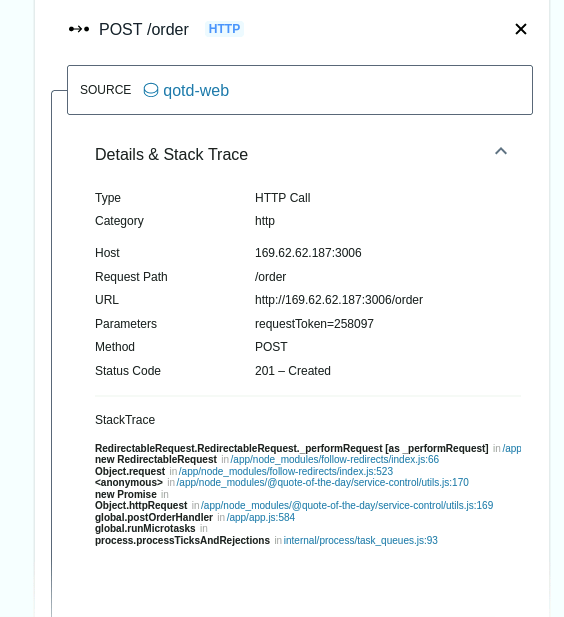
When you click on the link, Instana will decompile the code and show you the lines of code. The exact line of code that is executing will be highlighted in yellow.
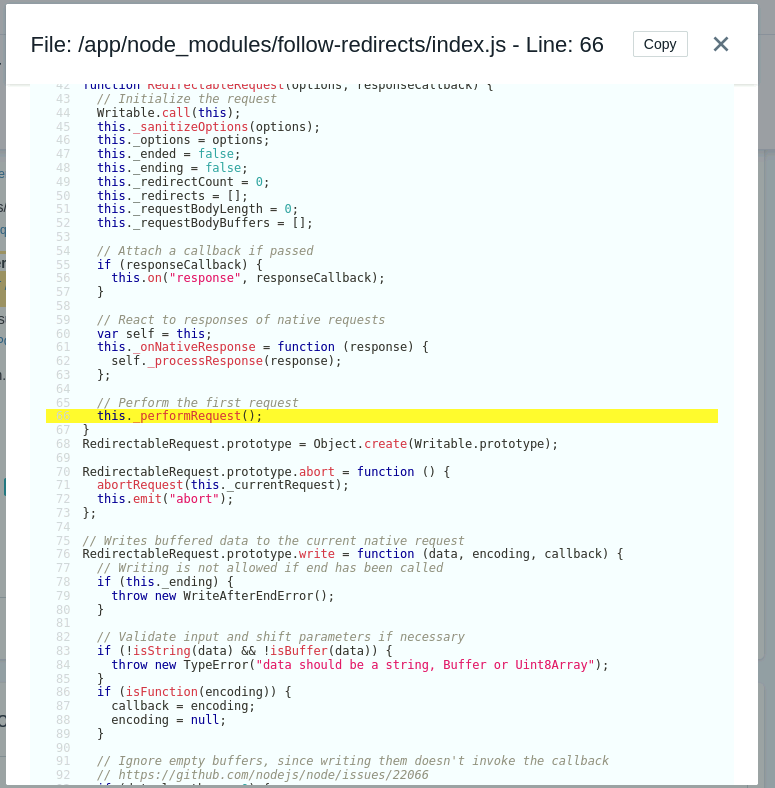
Click the X in the upper right corner to close the dialog.
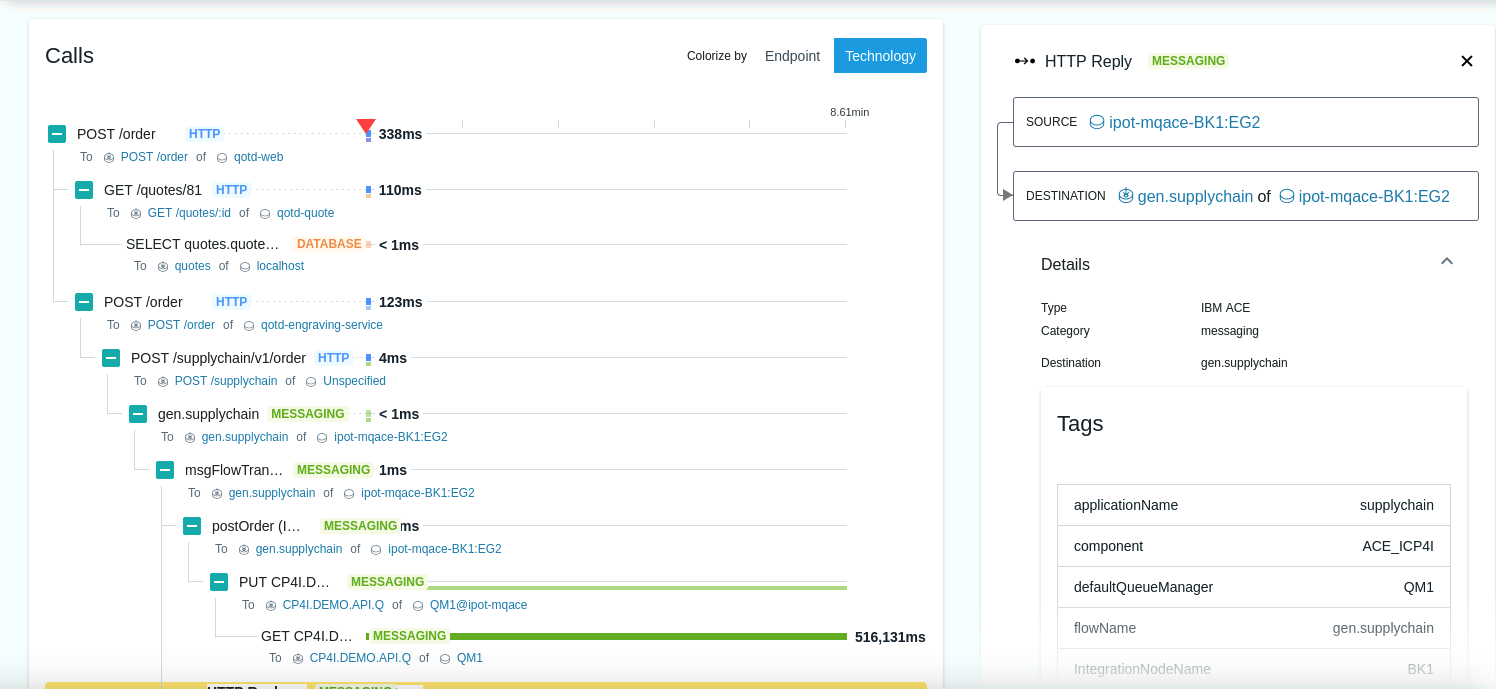
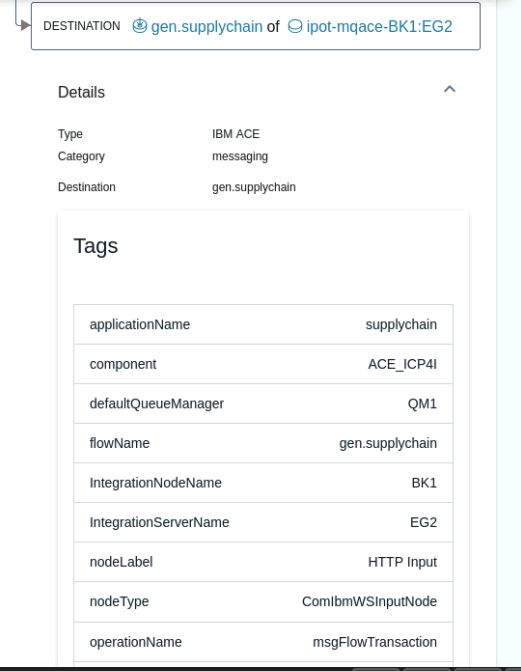
When you select the ACE portions of the call Stack (gen.supplychain, msgFlowTransaction, and postOrder) you will see key information including the flow name, Integration Node, Integration Server, IP address, and more on the right side of the screen.
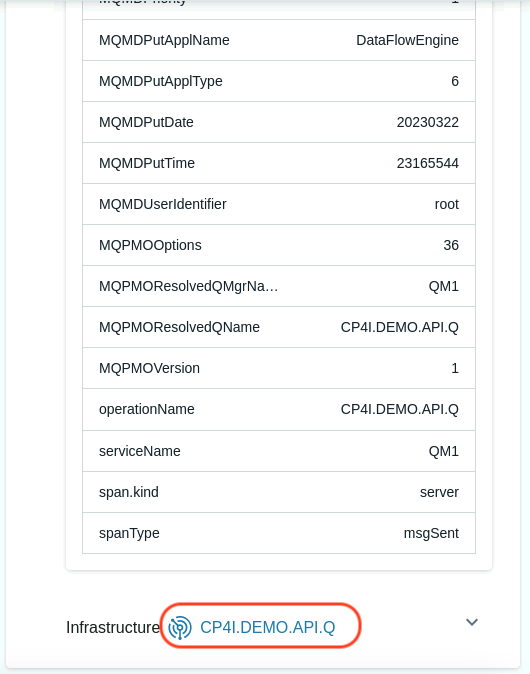
When you select the MQ portion of the call stack, you'll see key information related to the MQ environment on the right. The information includes the Queue Manager, Queue Name, and the message ID that was posted on the queue.
Scroll down to the very bottom on the right side of the screen and you will see a link named "CP4I.DEMO.API.Q". Click on the "CP4I.DEMO.API.Q" link and you will navigate to the Queue page of the MQ sensor for the CP4I.DEMO.API.Q queue. Instana places these links in context to make it easier to diagnose problems.
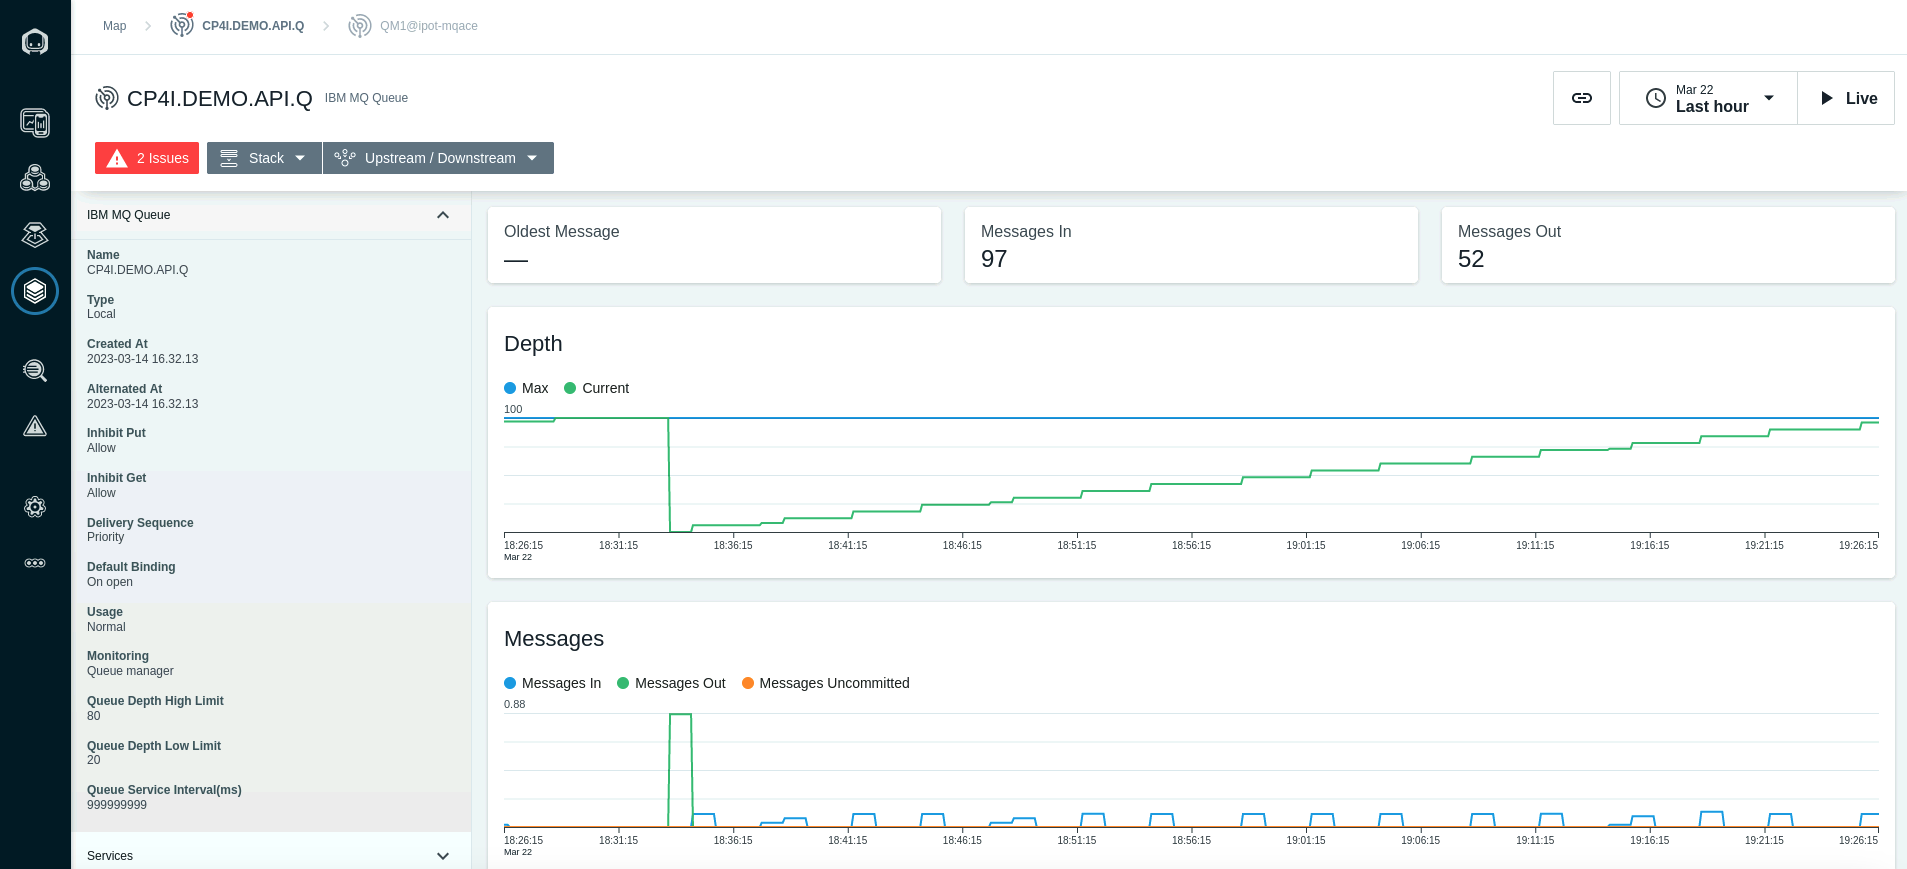
Earlier, you explored the Queue Manager and the MQ Channels. You're now looking at the queue that is being used by this application. You'll notice key information like the oldest message on the queue, queue depth, input/output rates, and more.
Summary
In this exercise you have explored some of the key capabilities within Instana. You explored Kubernetes monitoring. You explored the Infrastructure view. You defined an Application Perspective. And you explored the application monitoring details.