Monitoring OpenShift and Cloud Paks🔗
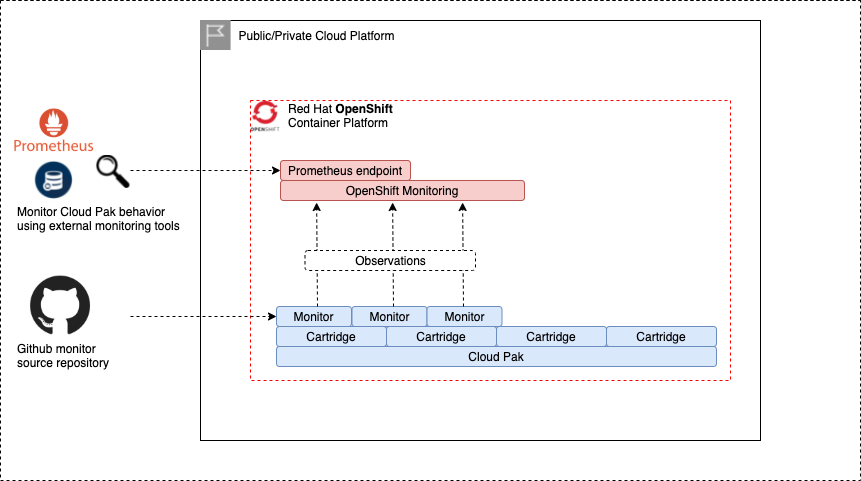
For monitoring of Cloud Pak for Data we make use of the OpenShift Monitoring framework. The observations generated by Cloud Pak for Data are pushed to the OpenShift Monitoring Prometheus endpoint. This will allow (external) monitoring tools to combine the observations from the OpenShift platform and Cloud Pak for Data from a single source.
OpenShift monitoring🔗
To deploy Cloud Pak for Data Monitors, its is mandatory to also enable the OpenShift monitoring. OpenShift monitoring is activated via the openshift_monitoring object.
openshift_monitoring:
- openshift_cluster_name: pluto-01
  user_workload: enabled
  remote_rewrite_url: http://www.example.com:1234/receive
  retention_period: 15d
  pvc_storage_class: ibmc-vpc-block-retain-general-purpose
  pvc_storage_size_gb: 100
  grafana_operator: enabled
  grafana_project: grafana
  labels:
    cluster_name: pluto-01
| Property | Description | Mandatory | Allowed values |
|---|---|---|---|
| user_worload | Allow pushing Prometheus metrics to OpenShift (must be set to True for monitoring to work) | Yes | True, False |
| pvc_storage_class | Storage class to keep persistent monitoring data | No | Valid storage class |
| pvc_storage_size_gb | Size of the PVC holding the monitoring data | Yes if pv_storage_class is set | |
| remote_rewrite_url | Set this value to redirect metrics to remote Prometheus | NO | |
| retention_period | Number of seconds (s), minutes (m), hours(h), days (d), weeks (w), years (y) to retain monitoring data. Default is 15d | Yes | |
| labels | Additional labels to be added to the metrics | No | |
| grafana_operator | Enable Grafana community operator? | No | False (default), True |
| grafana_project | If enabled, project in which to enable the Grafana operator | Yes, if grafana_operator enabled |
Note Labels must be specified as a YAML record where each line is a key-value. The labels will be added to the prometheus key of the user-workload-monitoring-config ConfigMap and to the prometheusK8S key of the cluster-monitoring-config ConfigMap.
Note When the Grafana operator is enabled, you can build your own Grafana dashboard based on the metrics collected by Prometheus. When installed, Grafana creates a local admin user with user name root and passwowrd secret. Grafana can be accessed using the OpenShift route that is created in the project specified by grafana_project.
Cloud Pak for Data monitoring🔗
The observations of Cloud Pak for Data are generated using the zen-watchdog component, which is part of the cpd_platform cartridge and therefore available on each instance of Cloud Pak for Data. Part of the zen-watchdog installation is a set of monitors which focus on the technical deployment of Cloud Pak for Data (e.g. running pods and bound Persistent Volume Claims (pvcs)).
Additional monitors which focus more on the operational usage of Cloud Pak for Data can be deployed as well. These monitors are maintained in a seperate Git repository and be accessed at IBM/cp4d-monitors. Using the Cloud Pak Deployer, monitors can be deployed which uses the Cloud Pak for Data zen-watchdog monitor framework. This allows adding custom monitors to the zen-watchdog, making these custom monitors visible in the Cloud Pak for Data metrics.

Using the Cloud Pak Deployer cp4d_monitors capability implements the following: - Create Cloud Pak for Data ServiceMonitor endpoint to forward zen-watchdog monitor events to OpenShift Cluster monitoring - Create source repository auth secrets (optional, if pulling monitors from secure repo) - Create target container registry auth secrets (optional, if pushing monitor images to secure container registry) - Deploy custom monitors, which will be added to the zen-watchdog monitor framework
For custom monitors to be deployed, it is mandatory to enable the OpenShift user-workload monitoring, as specified in OpenShift monitoring.
The Cloud Pak for Data monitors are specified in a cp4d_monitors definition.
cp4d_monitors:
- name: cp4d-monitor-set-1
  cp4d_instance: zen-45
  openshift_cluster_name: pluto-01
  default_monitor_source_repo: https://github.com/IBM/cp4d-monitors
  #default_monitor_source_token_secret: monitors_source_repo_secret
  #default_monitor_target_cr: de.icr.io/monitorrepo
  #default_monitor_target_cr_user_secret: monitors_target_cr_username
  #default_monitor_target_cr_password_secret: monitors_target_cr_password
  # List of monitors
  monitors:
  - name: cp4dplatformcognosconnectionsinfo
    context: cp4d-cognos-connections-info
    label: latest
    schedule: "*/15 * * * *"
  - name: cp4dplatformcognostaskinfo
    context: cp4d-cognos-task-info
    label: latest
    schedule: "*/15 * * * *"
  - name: cp4dplatformglobalconnections
    context: cp4d-platform-global-connections
    label: latest
    schedule: "*/15 * * * *"
  - name: cp4dplatformwatsonstudiojobinfo
    context: cp4d-watsonstudio-job-info
    label: latest
    schedule: "*/15 * * * *"
  - name: cp4dplatformwatsonstudiojobscheduleinfo
    context: cp4d-watsonstudio-job-schedule-info
    label: latest
    schedule: "*/15 * * * *"
  - name: cp4dplatformwatsonstudioruntimeusage
    context: cp4d-watsonstudio-runtime-usage
    label: latest
    schedule: "*/15 * * * *"
  - name: cp4dplatformwatsonknowledgecataloginfo
    context: cp4d-wkc-info
    label: latest
    schedule: "*/15 * * * *"
  - name: cp4dplatformwmldeploymentspaceinfo
    context: cp4d-wml-deployment-space-info
    label: latest
    schedule: "*/15 * * * *"
  - name: cp4dplatformwmldeploymentspacejobinfo
    context: cp4d-wml-deployment-space-job-info
    label: latest
    schedule: "*/15 * * * *"
Each cp4d_monitors entry contains a set of default settings, which are applicable to the monitors list. These defaults can be overwritten per monitor if needed.
| Property | Description | Mandatory | Allowed values |
|---|---|---|---|
| name | The name of the monitor set | Yes | lowercase RFC 1123 subdomain (1) |
| cp4d_instance | The OpenShift project (namespace) on which the Cloud Pak for Data instance resides | Yes | |
| openshift_cluster_name | The Openshift cluster name | Yes | |
| default_monitor_source_repo | The default repository location of all monitors located in the monitors section | No | |
| default_monitor_source_token_secret | The default repo access token secret name, must be available in the vault | No | |
| default_monitor_target_cr | The default target container registry (cr) for the monitor image to be pushed. When omitted, the OpenShift internal registry is used | No | |
| default_monitor_target_cr_user_secret | The default target container registry user name secret name used to push the monitor image. Must be available in the vault | No | |
| default_monitor_target_cr_password_secret | The default target container registry password secret name used to push the monitor image. Must be available in the vault | No | |
| monitors | List of monitors | Yes |
Per monitors entry, the following settings are specified:
| Property | Description | Mandatory | Allowed values |
|---|---|---|---|
| name | The name of the monitor entry | Yes | lowercase RFC 1123 subdomain (1) |
| monitor_source_repo | Overrides default_monitor_source_repo for this single monitor | No | |
| monitor_source_token_secret | Overrides default_monitor_source_token_secret for this single monitor | No | |
| monitor_target_cr | Overrides default_monitor_target_cr for this single monitor | No | |
| monitor_target_cr_user_secret | Overrides default_monitor_target_cr_user_secret for this single monitor | No | |
| monitor_target_cr_user_password | Overrides default_monitor_target_cr_user_password for this single monitor | No | |
| context | Sets the context of the monitor the the source repo (sub folder name) | Yes | |
| label | Set the label of the pushed image, default to 'latest' | No | |
| schedule | Sets the schedule of the generated Cloud Pak for Data monitor cronjob | Yes |
Each monitor has a set of event_types, which contain the observations generated by the monitor. These event types are retrieved directly from the github repository, which it is expected that each context contains a file called event_types.yml. During deployment of the monitor this file is retrieved and used to populate the event_types of the monitor.
If the Deployer runs and the monitor is already deployed, the following process is used: - The build process is restarted to ensure the latest image of monitor is used - A comparison is made between the monitor's current configuration and the configuration created by the Deployer. If these are identical, the monitor's configuration is left as-is, however if these are different, the monitor's configuration is rebuild and the monitor is re-deployed.
Example monitior - global platform connections🔗
This monitor counts the number of Global Platform connections and for each Global Platform Connection a test is executed to test whether the connection can still be established.
Generated metrics🔗
Once the monitor is deployed, the following metrics are available in IBM Cloud Pak for Data.

On the Platform Management Events page the following entries are added: - Cloud Pak for Data Global Connections Count - Global Connection - <Global Connection Name> (for each connection)
Using the IBM Cloud Pak for Data Prometheus endpoint🔗
https://<CP4D-BASE-URL>/zen/metrics
It will generate 2 types of metrics:
- global_connections_count
Provides the number of available connections - global_connection_valid
For each connection, a test action is performed- 1 (Test Connection success)
- 0 (Test connection failed)
# HELP global_connections_count
# TYPE global_connections_count gauge
global_connections_count{event_type="global_connections_count",monitor_type="cp4d_platform_global_connections",reference="Cloud Pak for Data Global Connections Count"} 2

# HELP global_connection_valid
# TYPE global_connection_valid gauge
global_connection_valid{event_type="global_connection_valid",monitor_type="cp4d_platform_global_connections",reference="Cognos MetaStore Connection"} 1
global_connection_valid{event_type="global_connection_valid",monitor_type="cp4d_platform_global_connections",reference="Cognos non-shared"} 0
Zen Watchdog metrics (used in platform management events) - watchdog_cp4d_platform_global_connections_global_connections_count - watchdog_cp4d_platform_global_connections_global_connection_valid (for each connection)
Zen Watchdog metrics can have the following values: - 2 (info) - 1 (warning) - 0 (critical)
# HELP watchdog_cp4d_platform_global_connections_global_connection_valid
# TYPE watchdog_cp4d_platform_global_connections_global_connection_valid gauge
watchdog_cp4d_platform_global_connections_global_connection_valid{event_type="global_connection_valid",monitor_type="cp4d_platform_global_connections",reference="Cognos MetaStore Connection"} 2
watchdog_cp4d_platform_global_connections_global_connection_valid{event_type="global_connection_valid",monitor_type="cp4d_platform_global_connections",reference="Cognos non-shared"} 1

# HELP watchdog_cp4d_platform_global_connections_global_connections_count
# TYPE watchdog_cp4d_platform_global_connections_global_connections_count gauge
watchdog_cp4d_platform_global_connections_global_connections_count{event_type="global_connections_count",monitor_type="cp4d_platform_global_connections",reference="Cloud Pak for Data Global Connections Count"} 2