You can configure Event Streams to allow JMX scrapers to export Kafka broker JMX metrics to external applications. This tutorial details how to export Kafka JMX metrics as graphite output to an external Splunk system using a TCP data input.
Prerequisites
- Ensure you have an Event Streams installation available. This tutorial is based on Event Streams version 11.0.0.
- When installing Event Streams, ensure you configure your JMXTrans deployment as described in Configuring secure JMX connections.
- Ensure you have a Splunk Enterprise server installed or a Splunk Universal Forwarder that has network access to your cluster.
- Ensure that you have an index to receive the data and a TCP Data input configured on Splunk. Details can be found in the Splunk documentation.
JMXTrans
JMXTrans is a connector that reads JMX metrics and outputs a number of formats supporting a wide variety of logging, monitoring, and graphing applications. To deploy to your cluster, you must configure JMXTrans in your Event Streams custom resource.
Note: JMXTrans is not supported in Event Streams versions 11.2.0 and later.
Solution overview
The tasks in this tutorial help achieve the following goals:
- Set up Splunk so that it can access TCP ports for data.
- Utilize the
Kafka.spec.JMXTransparameter to configure a JMXTrans deployment.
Configure Splunk
Tip: You can configure Splunk with the Splunk Operator for Kubernetes. This tutorial is based on the Splunk operator version 2.2.0.
You can add a new network input after Splunk has been installed in your namespace, as described in the Splunk documentation.
In this tutorial we will be configuring the TCP Data input by using Splunk Web as follows:
- In Splunk Web click on Settings.
- Click Data Inputs.
- Select TCP or UDP.
- To add an input, select New Local TCP or New Local UDP.
- Type a port number in the Port field. In this tutorial, we use port number
9999. - If required, replace the default source value by entering a new source name in the Source name override field.
- Decide on a Host value.
- In the index field, provide the index where Splunk Enterprise will send data to for this input. Unless you have specified numerous indexes to handle various types of events, you can use the default value.
- Examine the options.
- Click the left angle bracket (<) to return to the wizard’s first step if you want to edit any item. Otherwise, press Submit.
Your port is included in the list of TCP data inputs.

Add a service for Splunk network source
Add a service that exposes the newly formed port after creating the network source.
The following is a sample service that uses a selector for a Splunk pod that the Splunk operator generated.
kind: Service
apiVersion: v1
metadata:
  name: <splunk-tcp-input-svc-name>
  namespace: es
spec:
  ports:
    - name: tcp-source
      protocol: TCP
      port: 9999
      targetPort: 9999
  selector:
    app.kubernetes.io/component: standalone
    app.kubernetes.io/instance: splunk-s1-standalone
    app.kubernetes.io/managed-by: splunk-operator
    app.kubernetes.io/name: standalone
Configure JMX for Event Streams
To expose the JMX port within the cluster, set the spec.strimziOverrides.kafka.jmxOptions value to {} and enable JMXTrans.
For example:
apiVersion: eventstreams.ibm.com/v1beta2
kind: EventStreams
# ...
spec:
  # ...
  strimziOverrides:
    # ...
    kafka:
      jmxOptions: {}
Tip: The JMX port can be password-protected to prevent unauthorized pods from accessing it. For more information, see Configuring secure JMX connections.
The following example shows how to configure a JMXTrans deployment in the EventStreams custom resourse.
# ...
spec:
  # ...
  strimziOverrides:
    # ...
    jmxTrans:
      #...
      kafkaQueries:
        - targetMBean: "kafka.server:type=BrokerTopicMetrics,name=*"
          attributes: ["Count"]
          outputs: ["standardOut", "splunk"]
      outputDefinitions:
        - outputType: "com.googlecode.jmxtrans.model.output.StdOutWriter"
          name: "standardOut"
        - outputType: "com.googlecode.jmxtrans.model.output.GraphiteWriterFactory"
          host: "<splunk-tcp-input-svc-name>.<namespace>.svc"
          port: 9999
          flushDelayInSeconds: 5
          name: "splunk"
Events start appearing in Splunk after we apply the jmxTrans option in the custom resource. The time it takes for events to appear in the Splunk index is determined by the scrape interval on JMXTrans and the size of the receive queue on Splunk.
You can increase or decrease the frequency of samples in JMXTrans and the size of the receive queue. To modify the receive queue on Splunk, create an inputs.conf file, and specify the queueSize and persistentQueueSize settings of the [tcp://<remote server>:<port>] stanza.
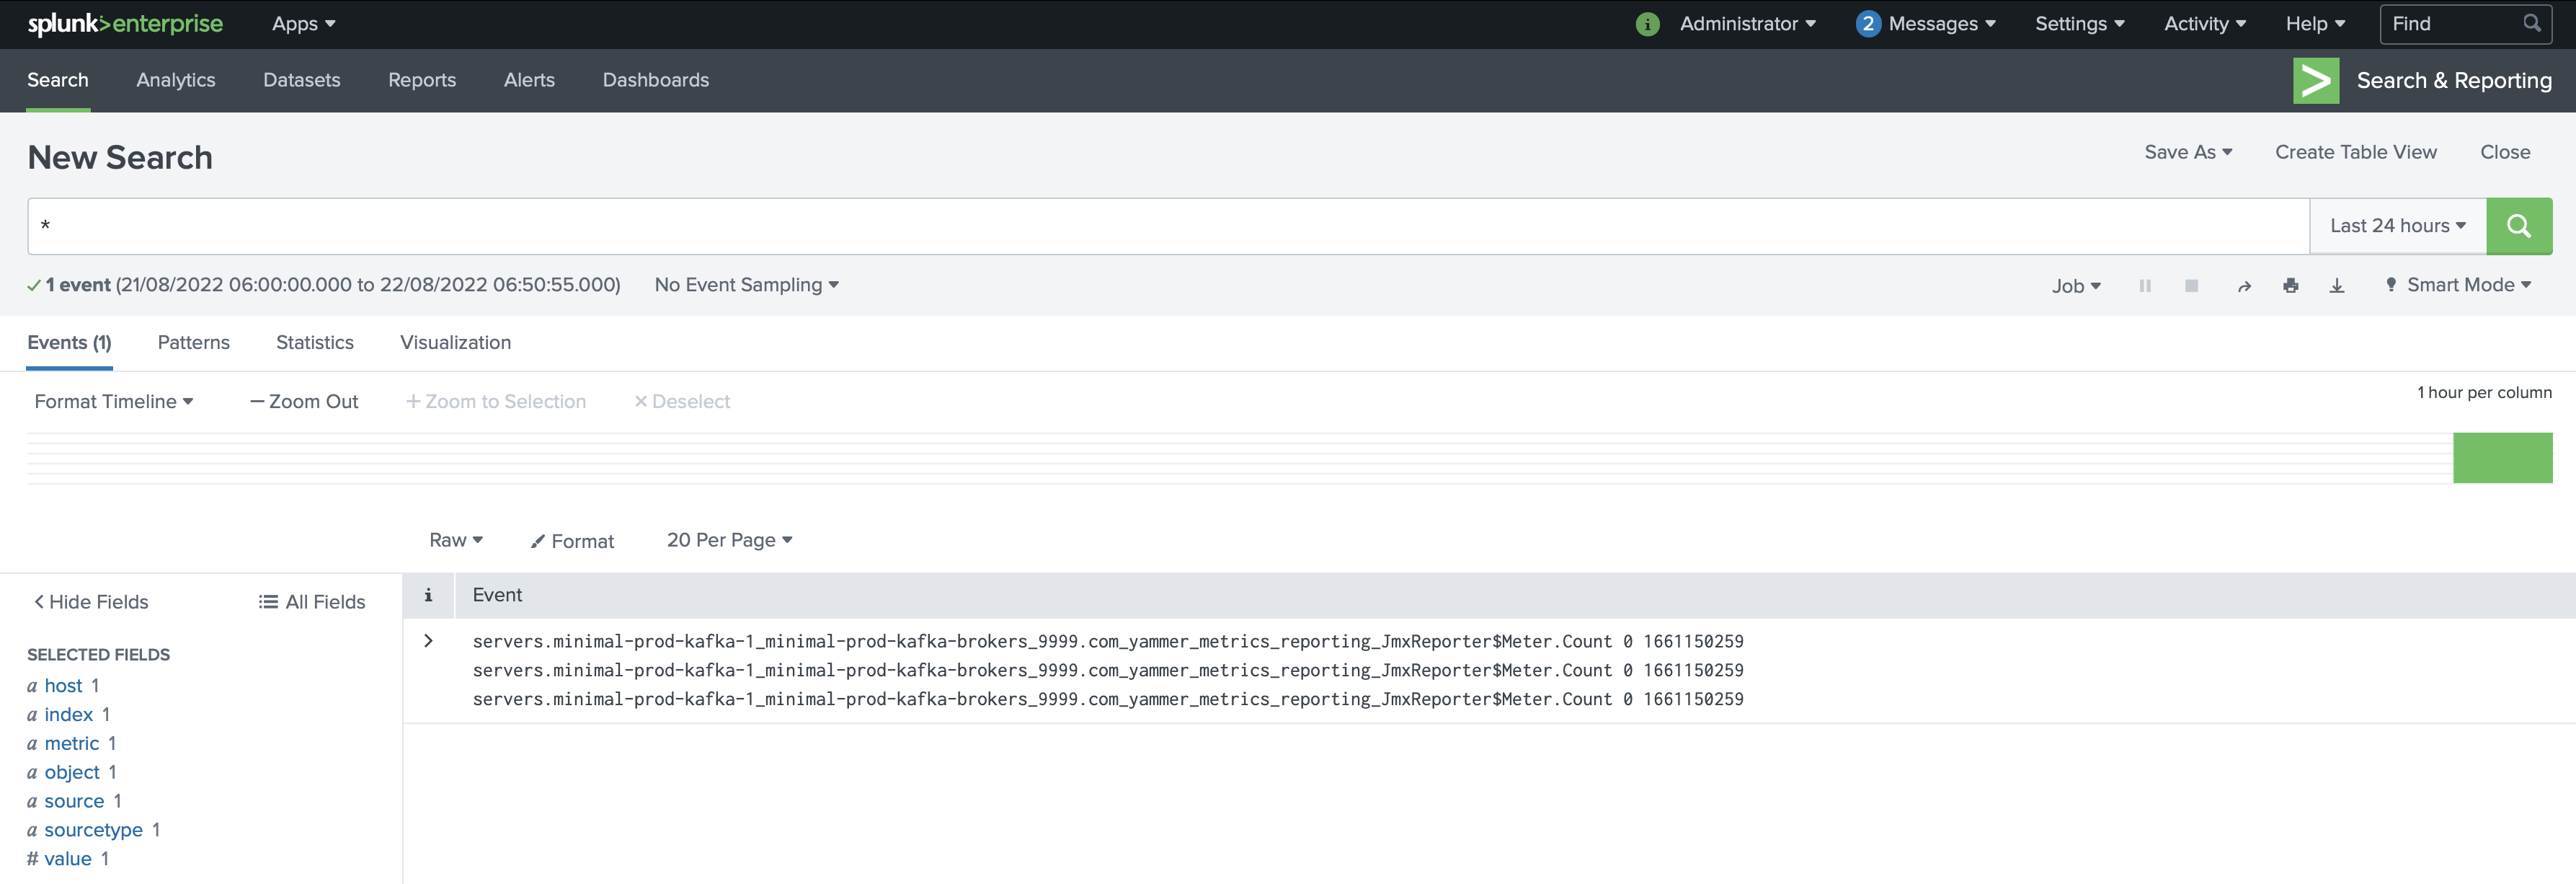
Splunk search will begin to show metrics. The following is an example of how JMXTrans metrics are displayed when metrics are successfully received.

Troubleshooting
-
If metrics are not appearing in your external Splunk, run the following command to examine the logs for JMXTrans:
kubectl -n <target-namespace> get logs <jmxtrans-pod-name> -
You can change the log level for JMXTrans by setting the required granularity value in
spec.strimziOverrides.jmxTrans.logLevel. For example:# ... spec: # ... strimziOverrides: # ... jmxTrans: #... logLevel: debug -
To check the logs from the Splunk pod, you can view the
splunkd.logfile as follows:tail -f $SPLUNK_HOME/var/log/splunk/splunkd.log -
If the Splunk Operator installation fails due to error Bundle extract size limit, install the Splunk Operator on Red Hat OpenShift Container Platform 4.9 or later.