Predictive Alerting
Overview
In this lab we will review how we can create proactive alerts based on anomaly detection and predictive behaviour.
One of the ways to become predictive is to monitor what will happen in the future if a metric keeps behaving in a specific way. Lots of tools can do capacity forecast, however this is something that they do once a day and considering long periods of historical data, but what happens when the metric starts behaving abnormally only for the last 30 minutes?
SevOne can generate notifications when an anomaly is detected on a metric, however that doesn't mean for sure that there is a potential future issue. But what we can do is, once we have detected an anomaly, trigger an action to check how the future utilization of that metric will be (say in the next 24 hours) to predict if that's a potential future issue or not.
This is what we are doing in this lab:
- First, we are generating an alert when we detect an anomaly on one of the metrics
- Second, we check how the future behaviour of this metric
- Third, if the future behaviour of the metric goes over 100% utilization, then we trigger a new alert (Emergency alert) notifying that this is a real issue
Therefore, what we are doing here is predictively detecting potential future issues based on short term historical data abnormalities.
Predict Short Term Future Behaviour
If SevOne authentication has already been created, please skip this block of actions and continue to step 4.
- Log into SANO automation platform
- Go to Authentications
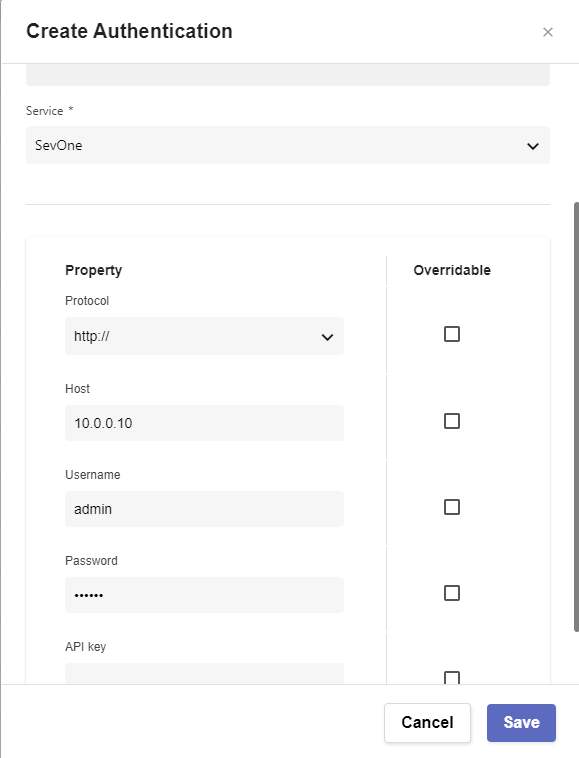
Click Create Authentication
a. Name: SevOne
b. Service: SevOne
c. Protocol: http:// (<-- important)
d. Host: 10.0.0.10
e. Username: admin
f. Password: SevOne
- Go to Workflows
Click Create Workflow
a. Name: Your Name - Predictive Alerting
b. Layout type: Sequence
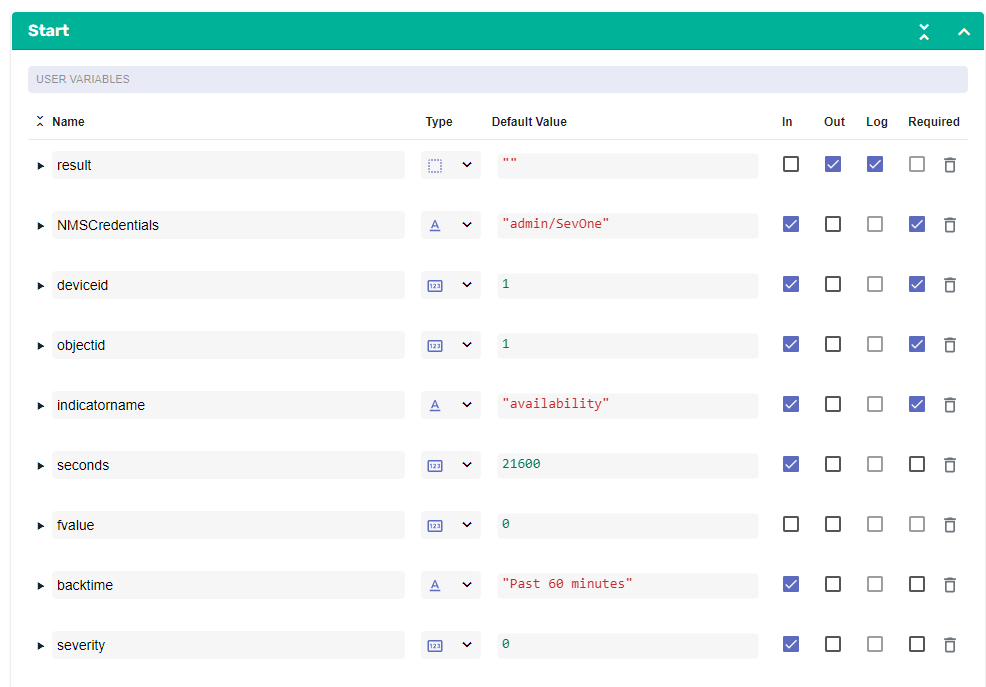
Add variables to Start
a. NMSCredentials
i. Name: NMSCredentials

ii. Type: Authentication -> SevOne

iii. Default Value: "admin/SevOne"

iv. In

v. Required
b. deviceid
i. Name: deviceid

ii. Type: Number

iii. Default Value: 1

iv. In

v. Required
c. objectid
i. Name: objectid

ii. Type: Number

iii. Default Value: 1

iv. In

v. Required
d. indicatorname
i. Name: indicatorname

ii. Type: String

iii. Default Value: availability

iv. In

v. Required
e. seconds
i. Name: seconds

ii. Type: Number

iii. Default Value: 21600

iv. In
f. fvalue
i. Name: fvalue

ii. Type: Number

iii. Default Value: 0
g. backtime
i. Name: backtime

ii. Type: String

iii. Default Value: "Past 60 minutes"

iv. In
h. severity
i. Name: severity

ii. Type: Number

iii. Default Value: 0

iv. In
- Change to Flow View
- On the left hand side panel, search for SevOne, Click on SevOne -> REST v3 -> Data
Select "Data Performance Metrics" and drop it after the building block START
a. Change name to SevOne_Forecast
b. Click on the building block to open the right side panel and complete the following fields
i. authKey: $NMSCredentials

ii. body:

    1. indicatorFilters -> Append Child

        a. IndicatorTypeNames -> Append Child

            i. value: $indicatorname

        b. objectIds: [ $objectid ]

    2. preferPercent: TRUE

    3. timeRange -> timeString: $backtime

    4. trendingOptions:

        a. projectedTime: $seconds

        b. timeRange:

            i. label: $backtime

            ii. timeString: $backtime

        c. trendType: PROJECTED
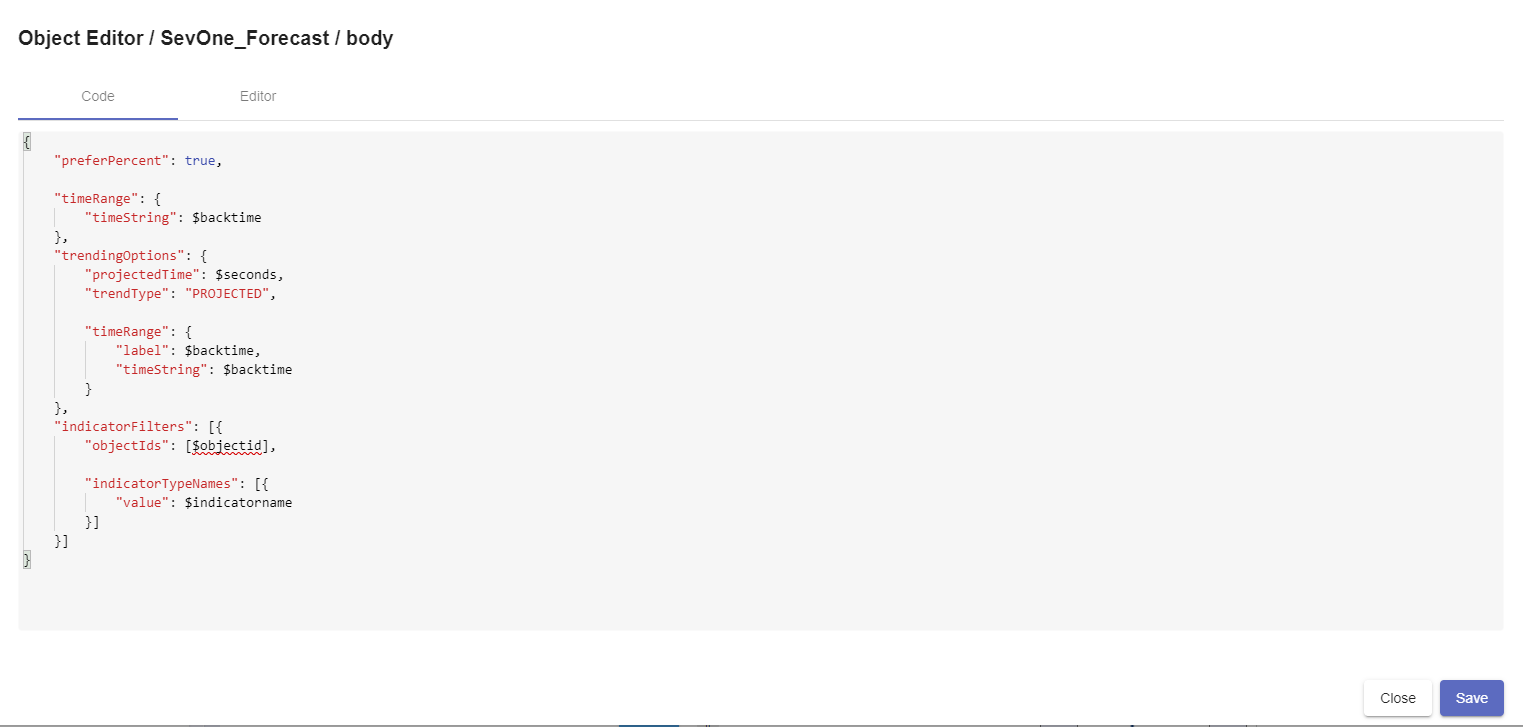
If you click on the 'square' icon next to body, you should see something like the above.
Add a new building block, Common -> Assign
a. Change name to Future_Value
b. Click on the building block to open the right side panel and complete the following fields
i. variable: $fvalue

ii. value: $SevOne_Forecast.result.indicatorResults[0].polledData.trendValueA + ($seconds * $SevOne_Forecast.result.indicatorResults[0].polledData.trendValueB)
Add a new building block, Common -> DateTime -> TimestampNowms
a. No need to edit anything
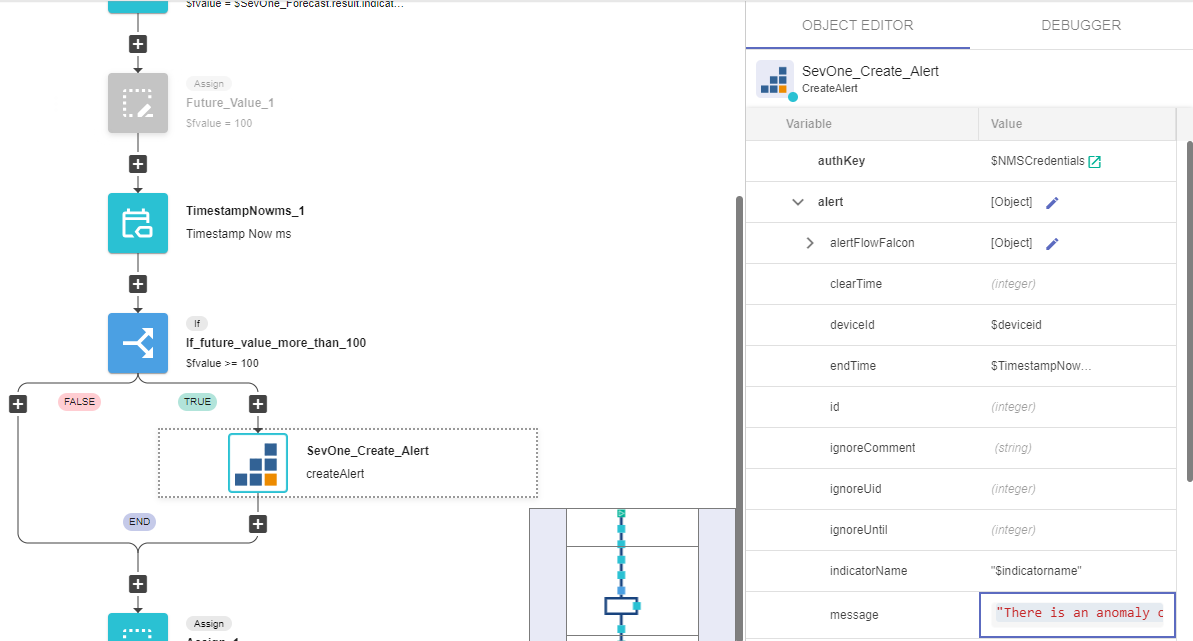
Add a new building block, Common -> If
a. Change name to If_future_value_more_than_100
b. Click on the building block to open the right side panel and complete the following fields
i. condition: $fvalue >= 100
On the TRUE branch of the IF, add a new building block, SevOne -> REST API v2 -> Alerts -> createAlert
a. Change name to SevOne_Create_Alert
a. Click on the building block to open the right side panel and complete the following fields
i. authKey: $NMSCredentials

ii. alert:

    1. deviceId: $deviceid

    2. endTime: $TimestampNowms_1.result

    3. indicatorName: "$indicatorname"

    4. message: "There is an anomaly on this device on indicator " + $indicatorname + " that might reach 100% in the next 24 hours"

    5. objectId: $objectid

    6. origin: system

    7. severity: $severity

    8. startTime: $TimestampNowms_1.result
If there is an Assign building block at the end of the workflow, use that building block for the next config, if there is not, add a building block from Common -> Assign
a. variable: $result
b. value: $fvalue
Create API Call
- Go to APIS
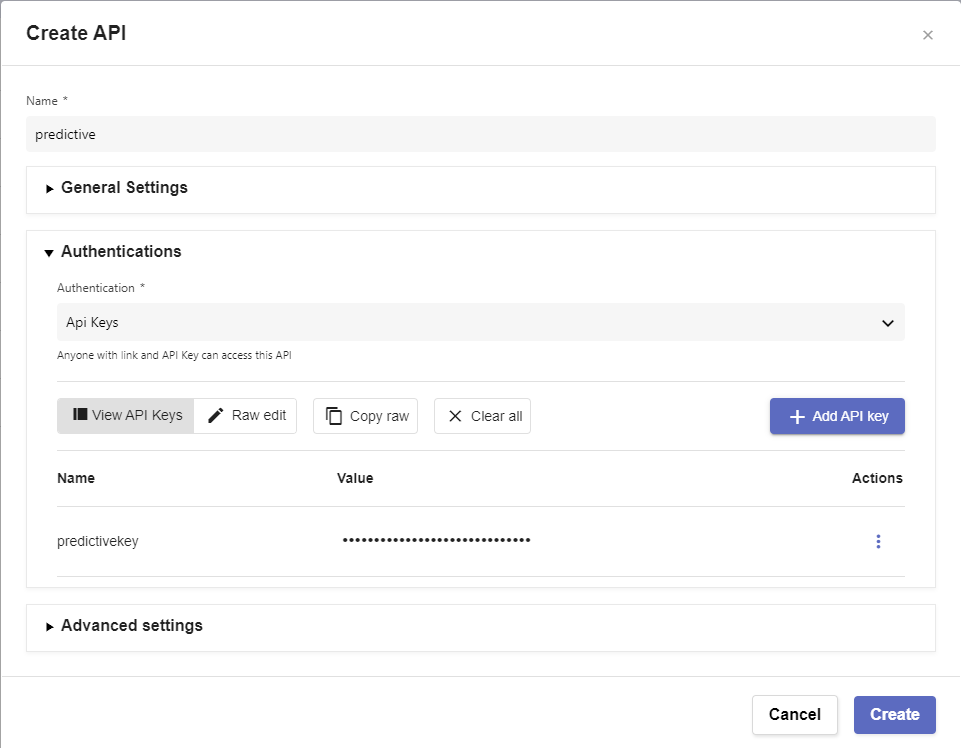
Click on ‘Create API’
a. Name: predictive
b. Authentications
i. Authentication: API Keys

    1. Click ‘Add API Key’

    2. Name: hfpkey

ii. Copy the api key for later use
c. Click ‘Create’
In workflow deployments, click ‘Create’
Workflow -> Choose the workflow you created clicking on the folder icon on the top right side of that field
Stage - > Click on + icon -> leave everything as it is, click ‘Save’
Endpoint -> Click on + icon
a. Change Path to /Predictive
b. Method: POST
c. Click ‘Save’
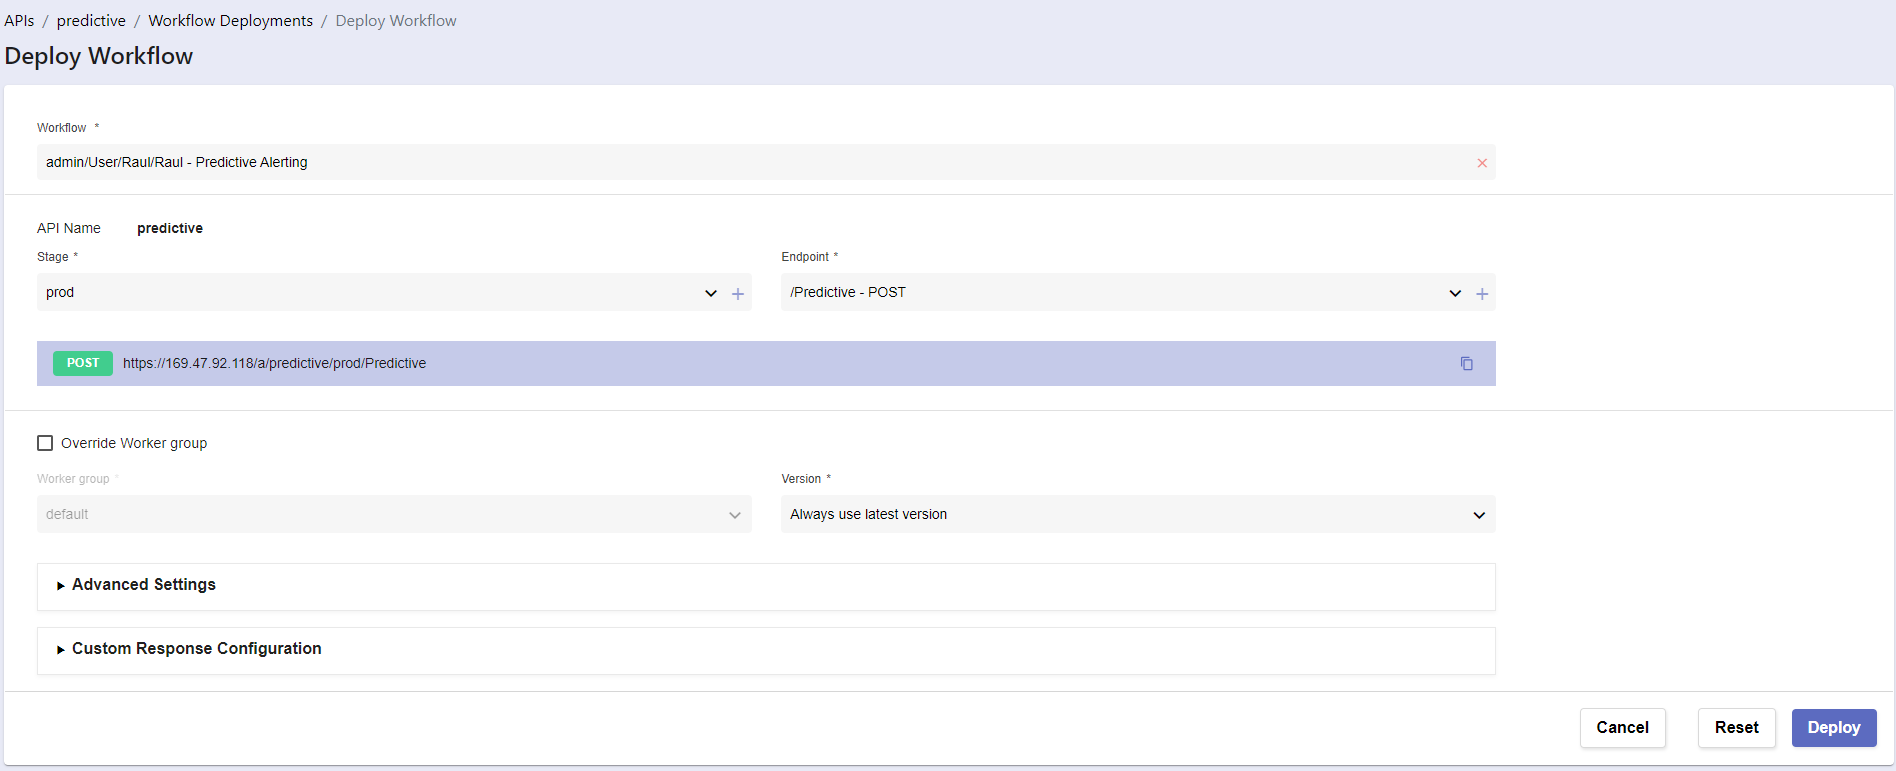
- Click Deploy
Review
Click on Swagger UI
a. Click on Authorize
b. Paste the copied toekn (step 15.b.ii)
c. Click Authorize
d. Click Close
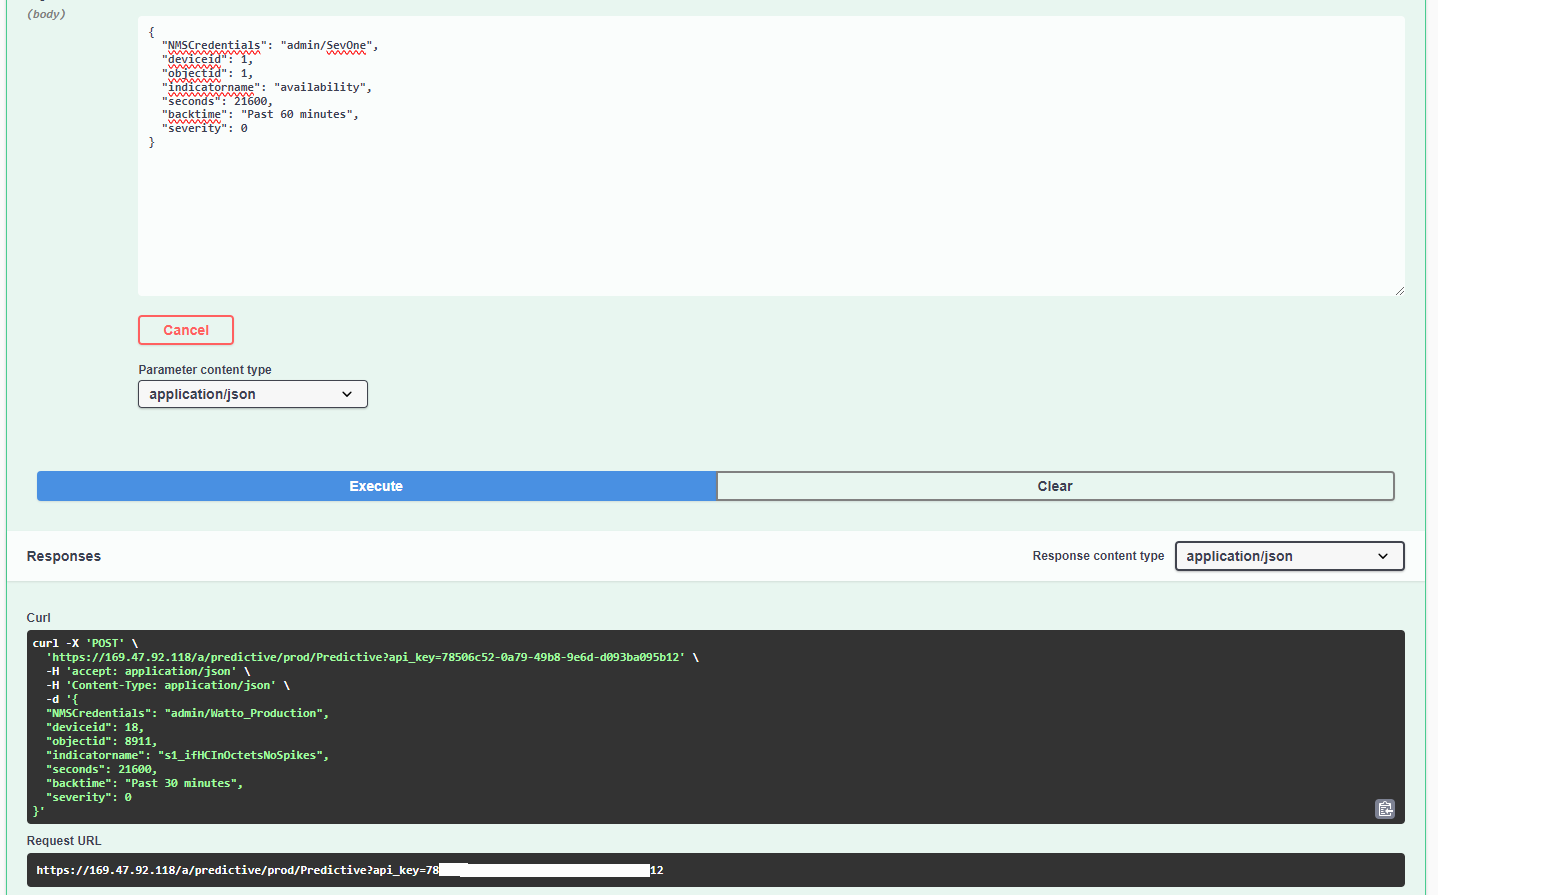
Click Try it out
a. Edit the body:
i. NMSCredentials: "admin/SevOne"

ii. deviceid: 1

iii. objectid: 1

iv. indicatorname: "availability"

v. seconds: 21600

vi. backtime: "Past 60 minutes"

vii. severity: 0
b. Click Execute
- Copy the Request URL
- Go to SevOne NMS
- Go to Events -> Configuration -> Webhook Definition Manager
Click on Add Webhook Definition
a. Webhook Definition Name: IRNA Predictive
b. Destination URL: paste the Request URL copied on step 21
c. Request Method: POST
d. Body:
(Copy everything, including the brakets, but without the quotes)
"
{
"NMSCredentials": "admin/SevOne",

"deviceid": $deviceId,

"objectid": $objectId,

"indicatorname": "ifHCInOctets",

"seconds": 21600,

"backtime": "Past 60 minutes",

"severity": 0
}
"
- Click Save
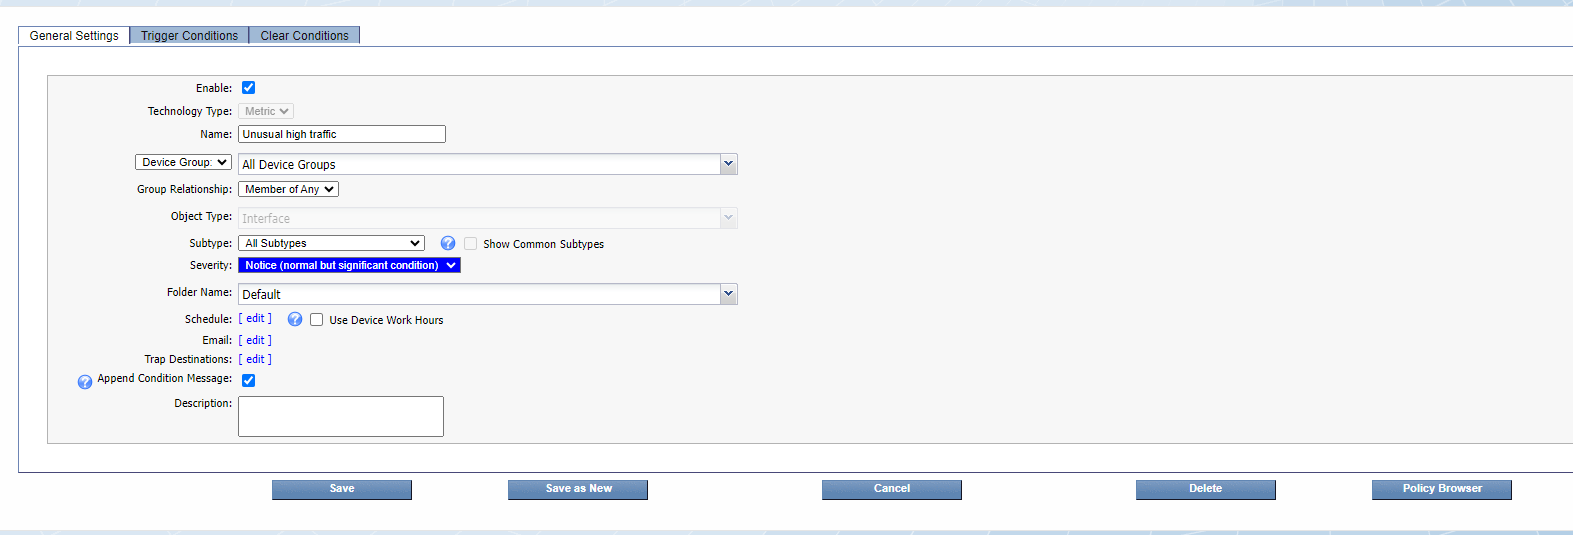
- Go to Events -> Configuration -> Policy Browser
Click Create Policy
a. Name: Unusual high traffic
b. Device group: All device groups
c. Object Type: Interface
d. Severity: Notice
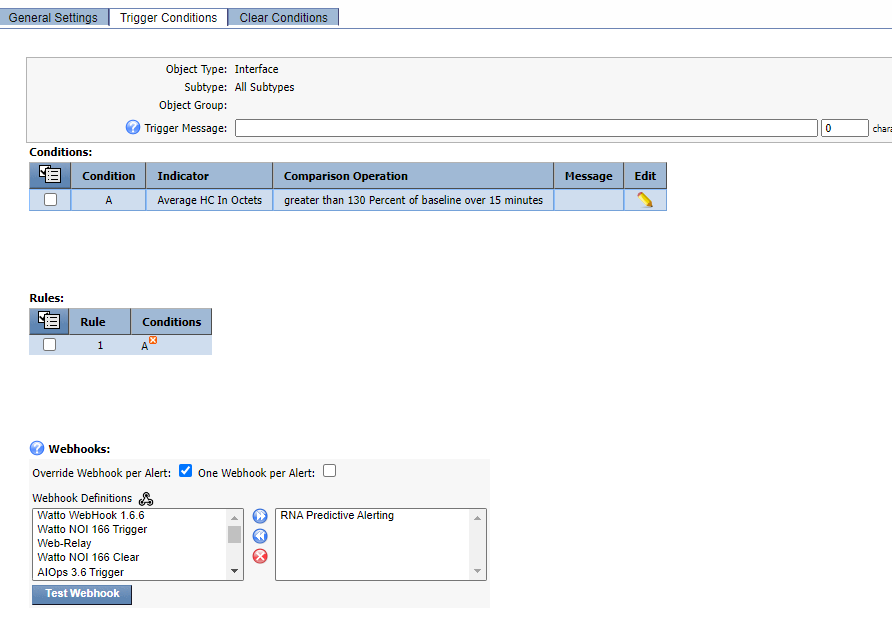
Click on Trigger Conditions
a. Click on the menu item under Conditions -> Create New
i. Indicator: HC In Octets

ii. Type: Baseline Percentage

iii. Comparison: greater than

iv. Threshold: 130 percent of baseline

v. Duration: 15 minutes

vi. Aggregation: Average
b. Override Webhook per Alert: Enabled
c. One Webhook per Alert: disabled
d. Select the IRNA Predictive webhook and move it to the right side
Click 'Save as New'