Recording Metrics
The behaviour testing engine is capable of consuming metrics from Kafka topics in the background, whilst a scenario executes. This can be used to test a service is behaving as expected.
The following guide shows you how to use the Metric Definitions, Metric Recording and Metric Assertions steps to record a metric and check it’s value.
Defining the Metric
To record metrics, you will need a Resource that produces metrics. In this guide, we use an example Assembly with a Resource that produces metrics for “Failed Calls”.
An example message for a failed calls metric measurement is shown below:
{
    "resource": "Example_A",
    "time": "1570177230416",
    "type": "failed_calls",
    "value": "1"
}
We create a metric definition for this message type with the following steps:
Open a new Scenario and add an Assembly which produces the metrics we plan to record

Configure the first stage, with a name of “Setup Definitions” (or a name of your choice)

Add a “Specify the definition for a metric…” step from the “Metric Definition” group in the scenario palette

Give the definition a name, in our example we call it “Example_A_Metrics_Format”

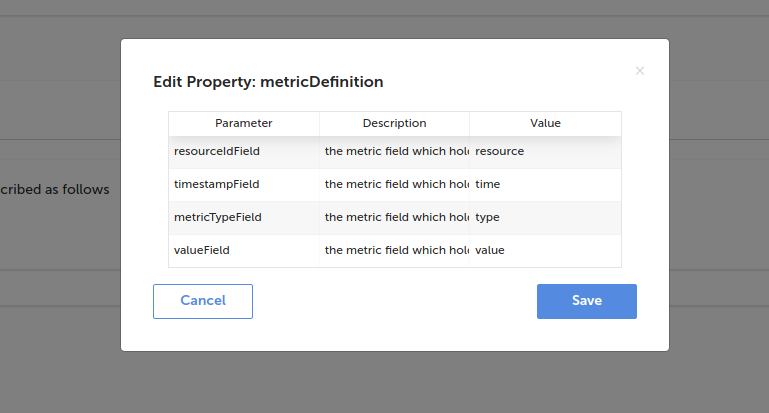
Open the definition table by clicking on “Open property: metricDefinition”. Input the names of each field in the value column of the table. It’s important that you assign the correct field name from your metric messages to the correct field in the table. In our example, we assign the “resource” field of our message to the “resourceIdField” of the definition, the “time” field to the “timestampField”, the “type” field to the “metricTypeField” and “value” to the “valueField”.

To read more about the fields required on a metric definition, see the step reference
Recording the Metric
To begin recording the metric, complete the following:
Add a new stage and call it “Start Recording” (this is optional, you can add all of the steps to the same stage if preferred)

Add the recording step from the “Metric Recording” group of the scenario palette

Fill in the step so it will record the target metric:
- The “metricName” can be any value of your choosing. This is used to refer to the metric in your scenario, so pick a descriptive name. In our example we will set it to “Example_A Failed Calls”
- The “metricDefinitionName” should be set to a valid definition, created in this scenario, which describes the format of the message for the metric we are recording. In our example we will set it to “Example_A_Metrics_Format”
- The “metricType” should be set to the value expected on the “metricTypeField” (of your definition) in the metric messages. In our example, we want to record the messages with a “type” field value of “failed_calls”, so we set this to “failed_calls” (“type” is the “metricTypeField” we specified on our definition).
- The “topicName” should be set to the name of the Kafka topic you expect the messages to be on
- The “resourceId” should be set to the value expected on the “resourceIdField” (of your definition) in the metric messages. In our example, we want to record the metrics for resource “Example_A” and we know the metric messages will have this value on the “resource” field of our message, which we used as the “resourceIdField” on our definition. Therefore, we set this value to “Example_A”

Checking the Metric Value
Now we are recording a metric, we can use “Metric Assertion” steps to check the measurements, failing the scenario if they are not a suitable value.
Add a new stage and call it “Check Metrics” (this is optional, you can add all the steps to the same stage if preferred)

Add the “Verify recorded metric always under threshold” step from the “Metric Assertions” group in the scenario palette

Fill in the step so it will check our recorded metric:
- The “metricName” must match the “metricName” from our record step (i.e. “Example_A Failed Calls”)
- The “thresholdValue” is the value we expect all values from the recorded metrics to be below (i.e. “5”)

Complete the Scenario
Currently our scenario will begin recording metrics then immediately check it’s values and finish, meaning we would not record the metric for very long. Usually you would add other steps in the scenario that would take some time. In our example, we’re going to simulate this time by adding a “Delay” step.
Add a “Delay” step from the “Utilities” group, place it before we assert the metric value

Fill in the input values for the delay step. In our example we will delay for 30 seconds

Save your changes by clicking “Save” at the top of the designer
We have now completed the design for our scenario.
Execute the Scenario
Execute the scenario by clicking the “Run Scenario” button at the top of the designer
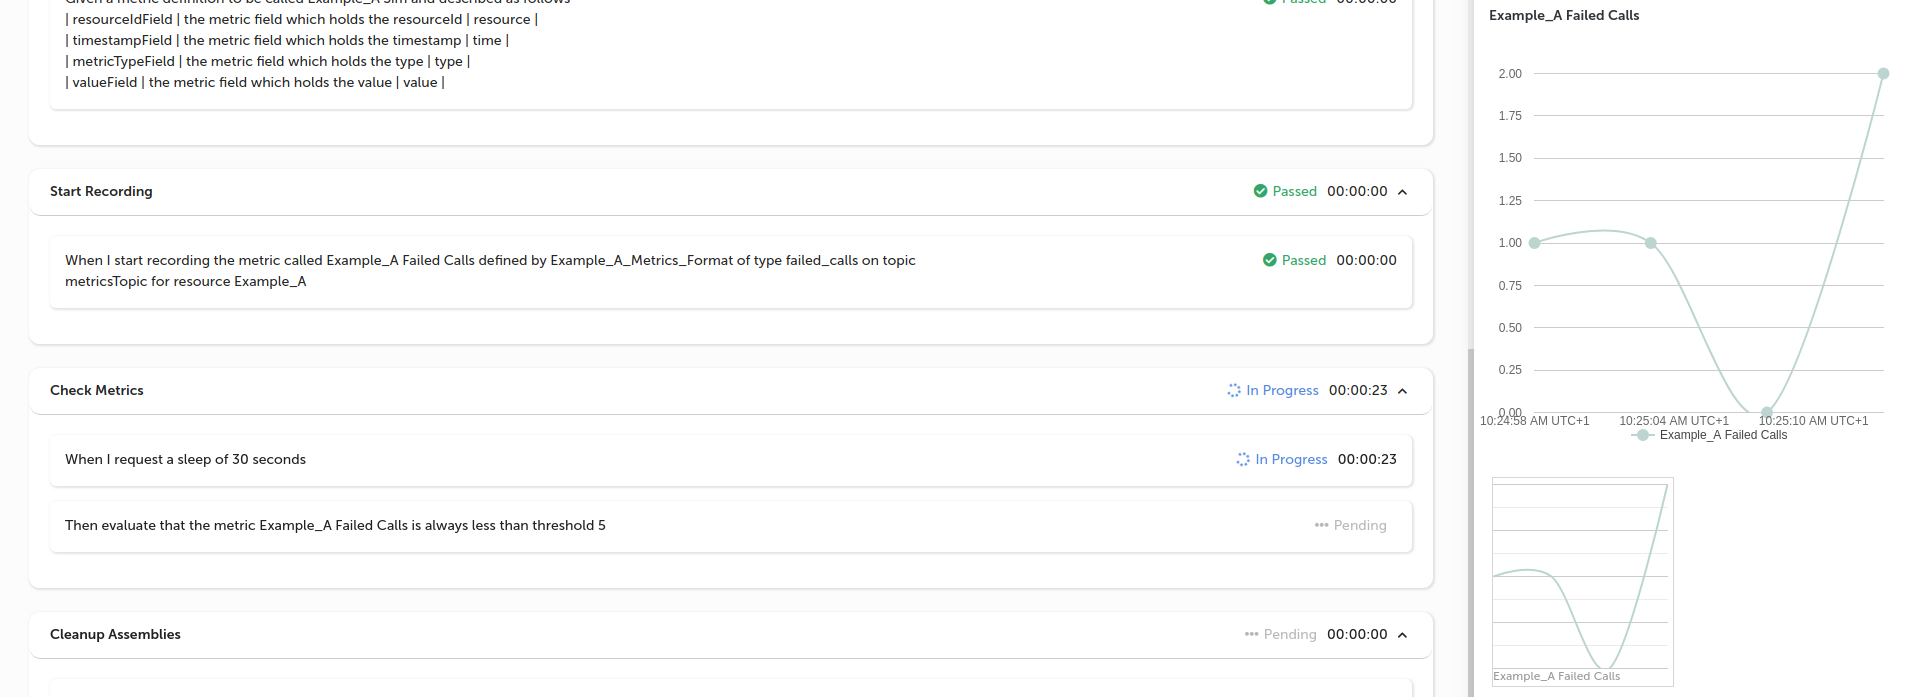
You will be taken to the execution screen. Once the “Start recording” step has been executed and some metrics are recorded, you will see a chart appear in the right hand panel. This chart will show the recorded values for your metric

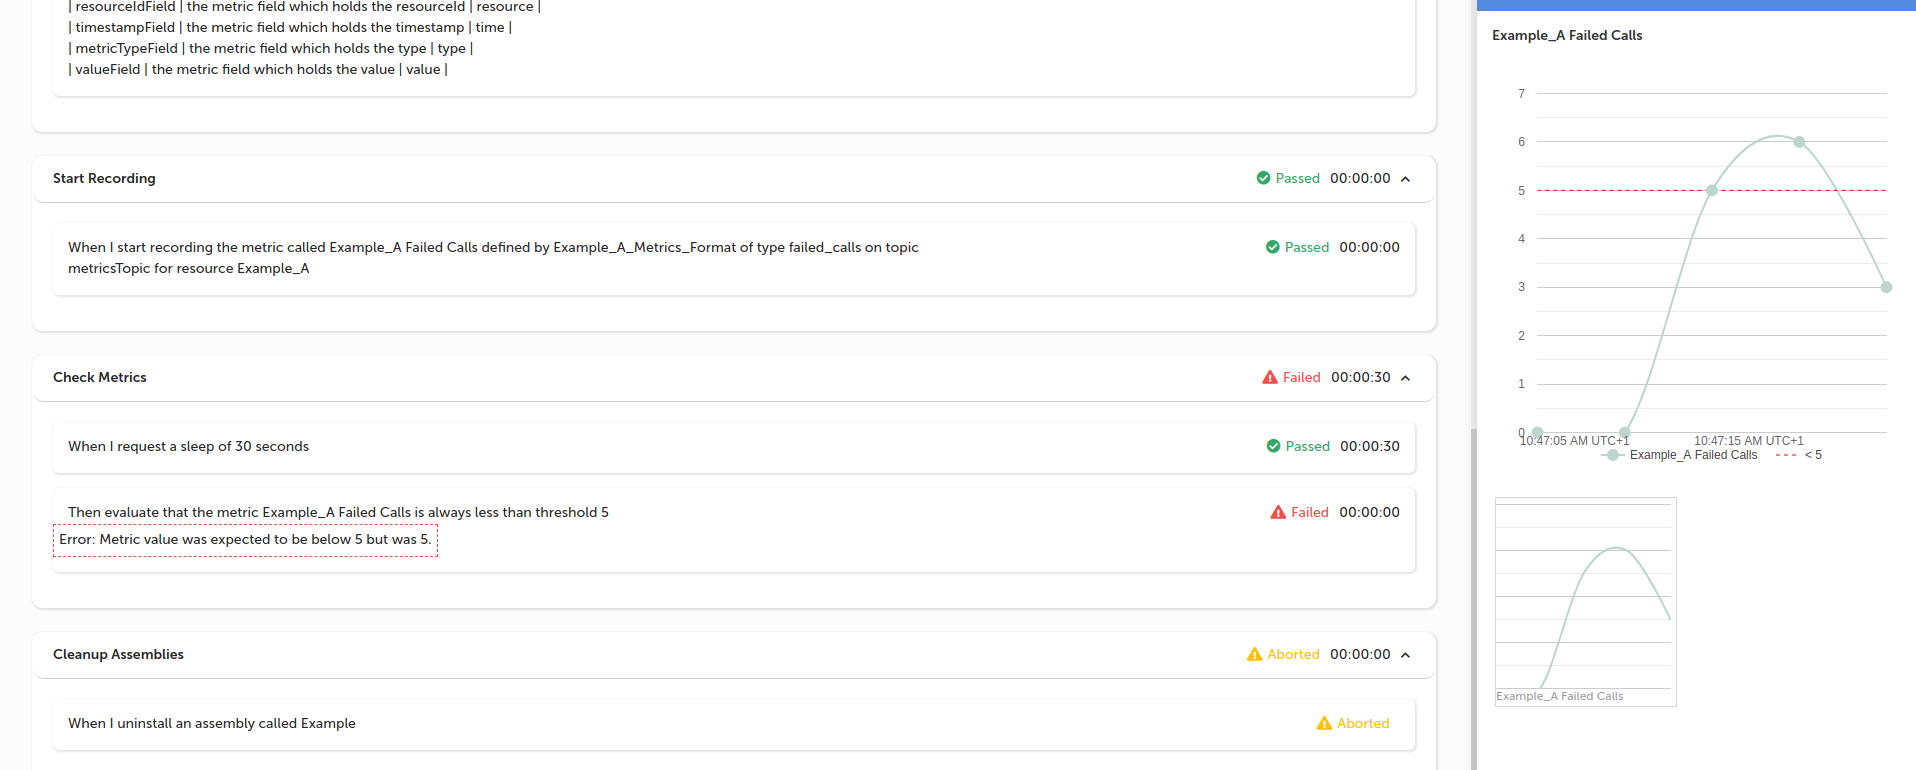
Once the step to verify the value is executed, you will see a red dotted line appear on the chart showing the threshold. If all the values are below this line then the step will pass

If the metric has gone above this threshold line you will see the step marked as “Failed”
