7. Topological Correlation
This AI algorithm is an unsupervised learning algorithm that groups alerts based on the topology resource groups in which those alerts occur. For example, if you have a resource group made up of all the resources within a given Kubernetes namespace, then any alerts on pods, microservices, or other resources in that namespace will be grouped together in a single topological alert group.
Topological alert grouping helps you understand when alerts are connected based on their topology, providing valuable context information for why related alerts might occur together. This algorithm is enabled by default so when related alerts are grouped based on their topology, Site Reliability Engineers (SREs) and other users responsible for application and service availability will be able to view the details of the alert in the context of the topology resources that are impacted.
7.1: Validate the Absence of Correlation
First, we will load a set of events to validate that there is no correlation whatsoever for the alerts created from these events.
Create a new file called topology-events.json by running the following command in the Terminal window to open the text editor, copy the event data below, paste it into the text editor, click on the Save button in the text editor and close the editor window (click on the X).
gedit topology-events.json
{ "sender":{ "service":"Zabbix Middleware Monitoring", "name":"US-SOUTH CEA SelfMonitoring @AGG_P", "type":"Zabbix" }, "resource":{ "application":"eCom2 web server", "name":"computer1000", "hostname":"computer1000.company.com", "type":"host", "ipaddress":"10.1.96.24", "location":"US-SOUTH" }, "type":{ "classification":"System status", "eventType":"problem" }, "severity":3, "summary":"CPU at 80% utilization", "occurrenceTime":"2023-05-05T14:40:38.000Z", "expirySeconds":0 }
{ "sender":{ "service":"Zabbix Middleware Monitoring", "name":"US-SOUTH CEA SelfMonitoring @AGG_P", "type":"Zabbix" }, "resource":{ "application":"eCom2 api layer", "name":"router1", "hostname":"", "type":"device", "ipaddress":"10.1.96.28", "location":"US-SOUTH" }, "type":{ "classification":"System status", "eventType":"problem" }, "severity":5, "summary":"Unscheduled device restart. Review log files", "occurrenceTime":"2023-05-05T14:45:20.000Z", "expirySeconds":0 }
{ "sender":{ "service":"Zabbix Middleware Monitoring", "name":"US-SOUTH CEA SelfMonitoring @AGG_P", "type":"Zabbix" }, "resource":{ "application":"eCom2 security layer", "name":"greatfirewallofsecurity", "hostname":"", "type":"device", "ipaddress":"10.1.96.29", "location":"US-SOUTH" }, "type":{ "classification":"System status", "eventType":"problem" }, "severity":6, "summary":"Unable to load firewall rules after reboot", "occurrenceTime":"2023-05-05T14:46:10.000Z", "expirySeconds":0 }
Now lets submit the events via the webhook script created in the previous section by running the following command from the Terminal window:
bash event-load-webhook.sh topology-events.json
- From the burger menu in the top-left navigate to: Operate → Alerts
- Click on the Refresh alerts icon on the right
Now we can see that the three alerts are independent from each other and not correlated. Also, if you click on the View correlation icon in the top-right, the Correlation column shows no correlation information for these alerts.

Lets clear these alerts before we create topology resources and test the topological correlation. Select all the alerts, right-click and select Clear. Lets move to the next step in the Lab, the alerts will disappear after 2-3 minutes
7.2: Creating Topology Resources
As we have discussed before, topological alert correlation requires the definition of topology groups and to create these groups, first we need to create topology resources.
In a real-world scenario, it is likely that you would be using a number of off-the-shelf Topology Observers to get your topology data from your environment. It is also likely that you would also leverage the File or REST Topology Observers either to ingest data for which an off-the-shelf Topology Observer doesn't exist, or to manually create relationships between Resources in your topology for which there is no source.
In this scenario, we will have one set of topology data that represents physical infrastructure and we will load this topology using a File Topology Observer.
Create a file called infrastructure.txt with the following content:
Create a new file called infrastructure.txt by running the following command in the Terminal window to open the text editor, copy the topology data below, paste it into the text editor, click on the Save button in the text editor and close the editor window (click on the X).
gedit infrastructure.txt
V:{"_operation":"InsertReplace","uniqueId":"379177a8-0a6a-4068-817c-d6d6e870437e","matchTokens":["379177a8-0a6a-4068-817c-d6d6e870437e","router1"],"tags":["WAIOpsDemo"],"name":"router1","entityTypes":["router"],"_references":[{"_toUniqueId":"7598a194-27a0-4d0b-9c49-cbc0070c99c9","_edgeType":"uses"}]}
V:{"_operation":"InsertReplace","uniqueId":"9c1f90e0-7dc4-40d8-8721-40ea2f3af453","matchTokens":["9c1f90e0-7dc4-40d8-8721-40ea2f3af453","Intel"],"tags":["WAIOpsDemo"],"name":"Intel","entityTypes":["cpu"],"_references":[]}
V:{"_operation":"InsertReplace","uniqueId":"222-9c1f90e0-7dc4-40d8-8721-40ea2f3af453","matchTokens":["222-9c1f90e0-7dc4-40d8-8721-40ea2f3af453","AMD"],"tags":["WAIOpsDemo"],"name":"AMD","entityTypes":["cpu"],"_references":[]}
V:{"_operation":"InsertReplace","uniqueId":"7598a194-27a0-4d0b-9c49-cbc0070c99c9","matchTokens":["7598a194-27a0-4d0b-9c49-cbc0070c99c9","greatFireWallOfSecurity"],"tags":["WAIOpsDemo"],"name":"greatFireWallOfSecurity","entityTypes":["firewall"],"_references":[]}
V:{"_operation":"InsertReplace","uniqueId":"974d1788-1312-4151-8a62-73fa1854e807","matchTokens":["974d1788-1312-4151-8a62-73fa1854e807","computer1000"],"tags":["WAIOpsDemo"],"name":"computer1000","entityTypes":["computer"],"_references":[{"_toUniqueId":"379177a8-0a6a-4068-817c-d6d6e870437e","_edgeType":"connectedTo"},{"_toUniqueId":"9c1f90e0-7dc4-40d8-8721-40ea2f3af453","_edgeType":"contains"},{"_toUniqueId":"222-9c1f90e0-7dc4-40d8-8721-40ea2f3af453","_edgeType":"contains"}]}
V:{"_operation":"InsertReplace","uniqueId":"5c6f968a-2006-4b43-96b5-dd53df6b0afb","matchTokens":["5c6f968a-2006-4b43-96b5-dd53df6b0afb","steve"],"tags":["WAIOpsDemo"],"name":"steve","entityTypes":["person"],"_references":[{"_toUniqueId":"974d1788-1312-4151-8a62-73fa1854e807","_edgeType":"uses"}]}
The pseudo JSON format in this topology file is the format expected by the File Observer, and contains topology directives, one per line.
Other format information can be found in the documentation
Creating a File Topology Observer
We will create a file topology observer to load the topology file we just created.
Log into the Cloud Pak for AIOps:
- from the burger menu in the top-left navigate to: Define → Integrations
- from the Integrations page, click on Add integration
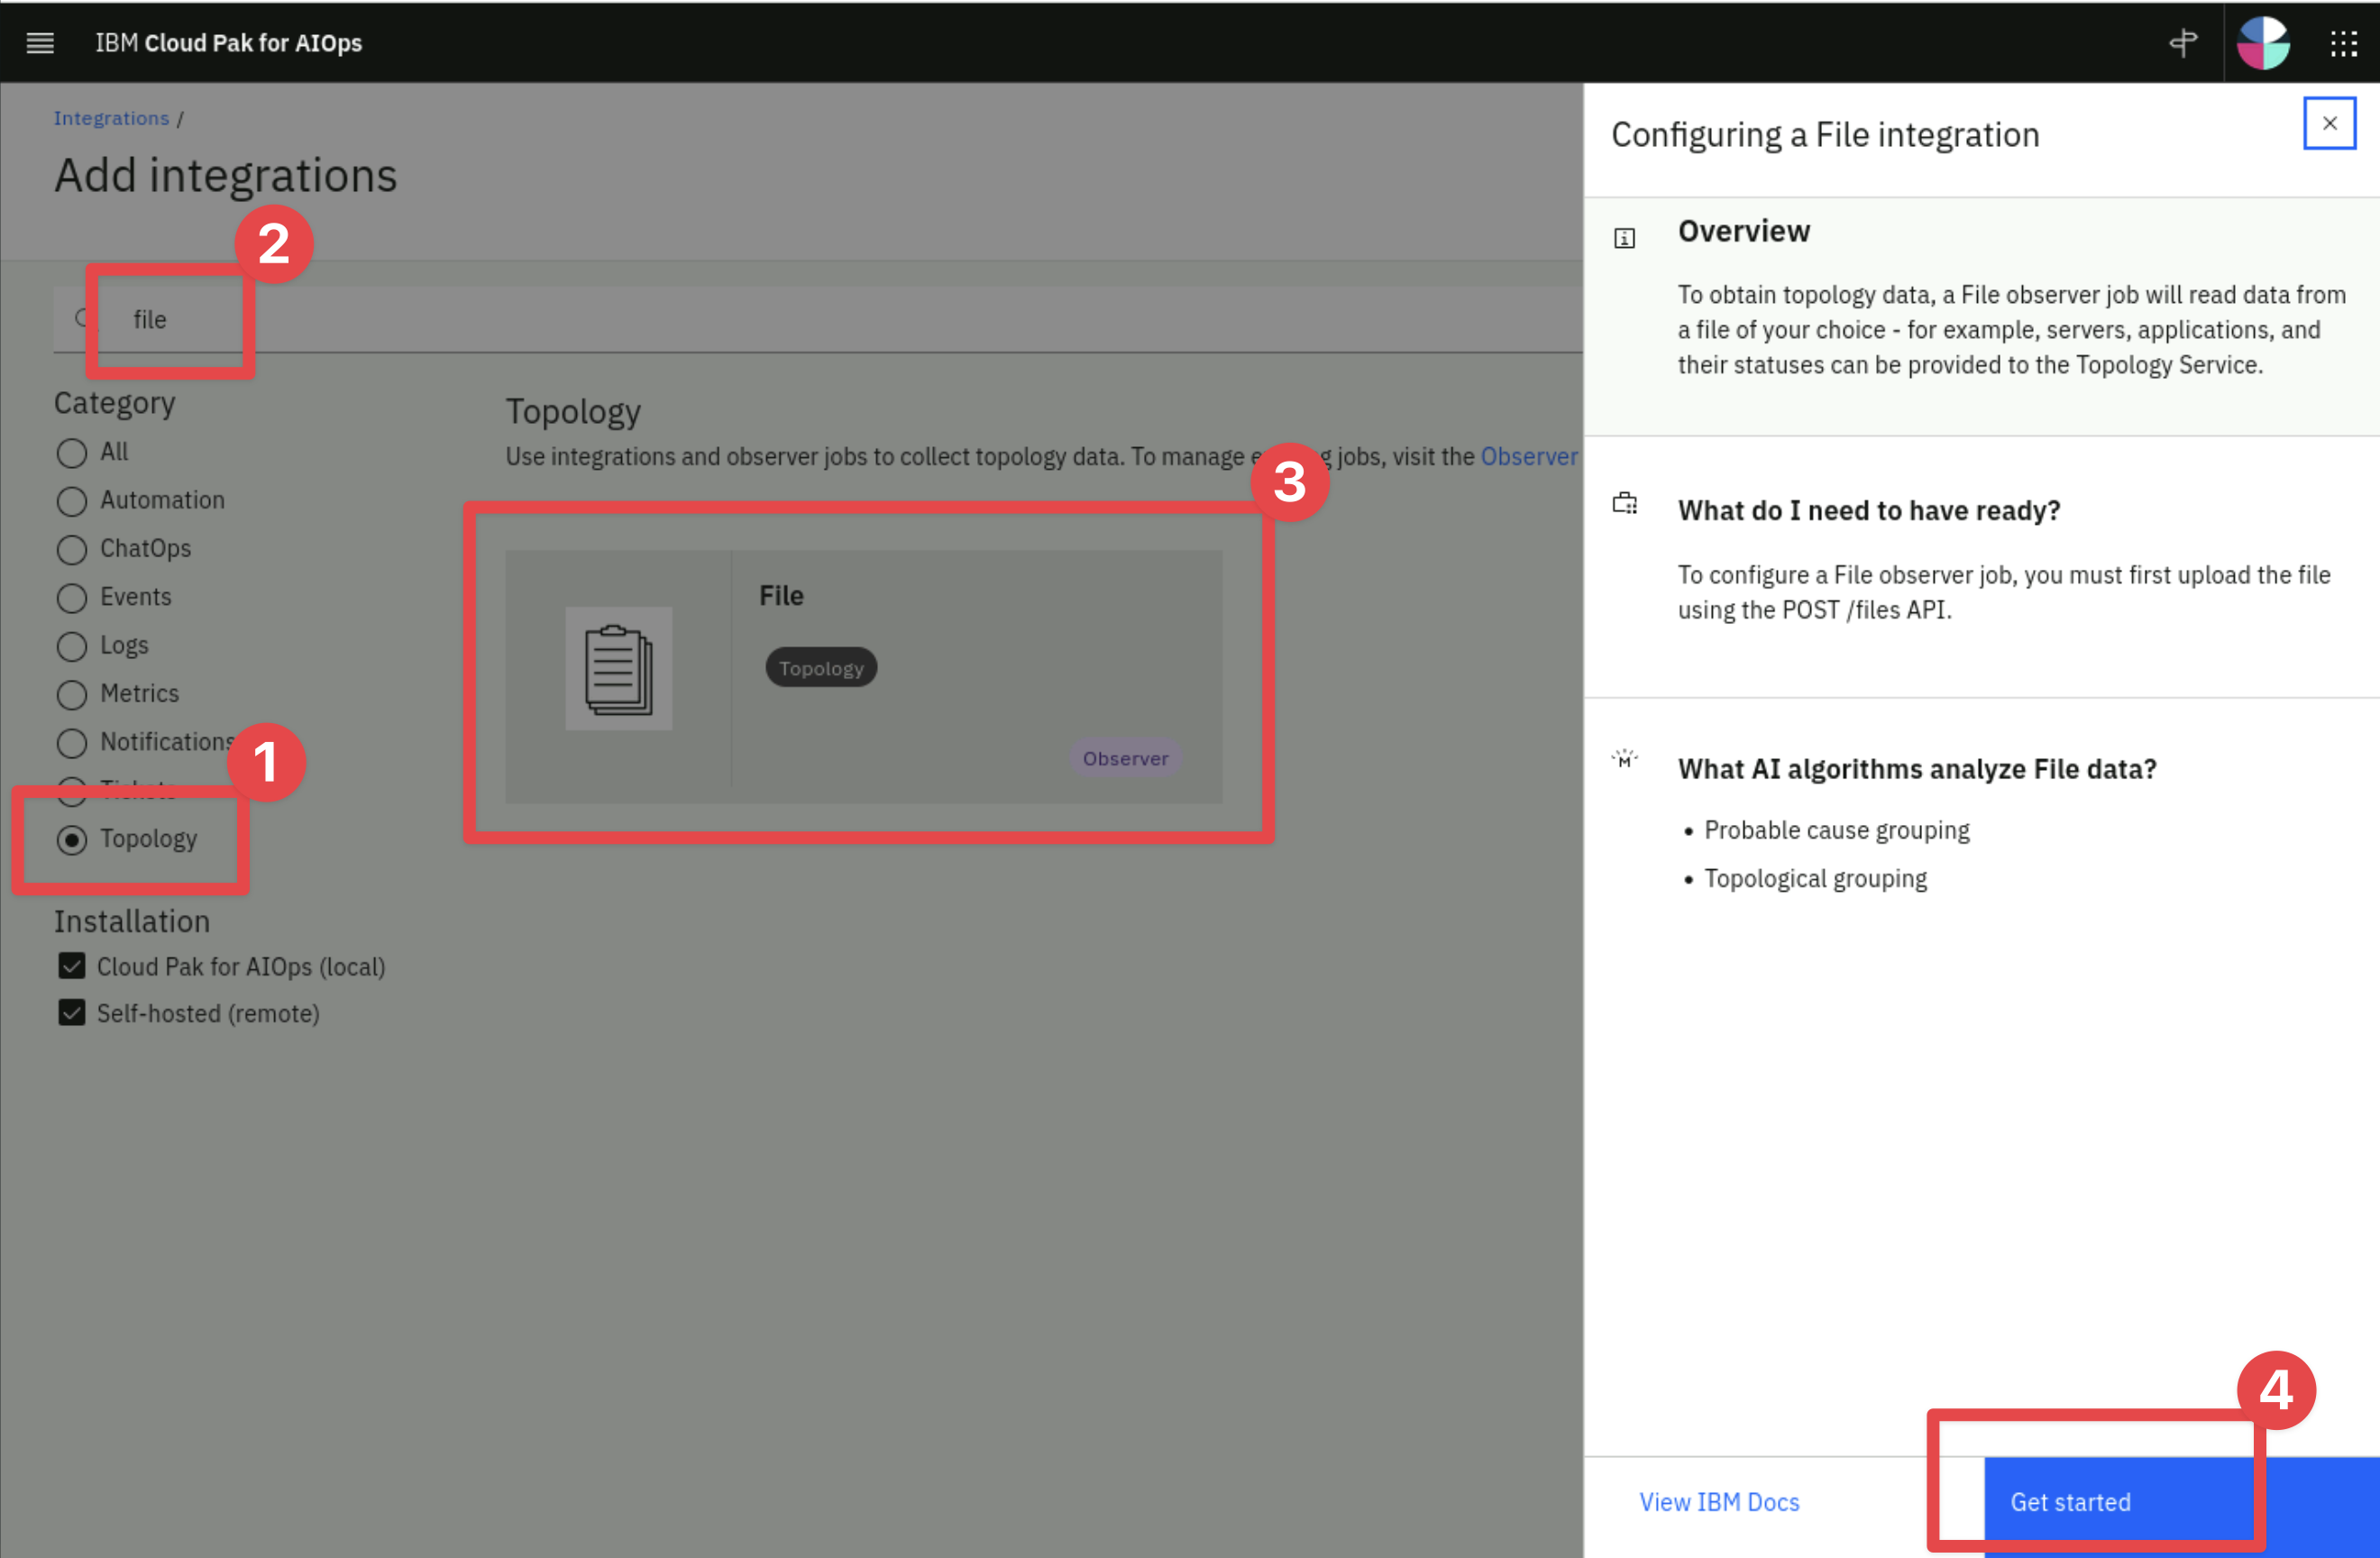
- from the Add integrations page, under Category click on Topology then search for File tile. Click on the File tile and select Get started on the right
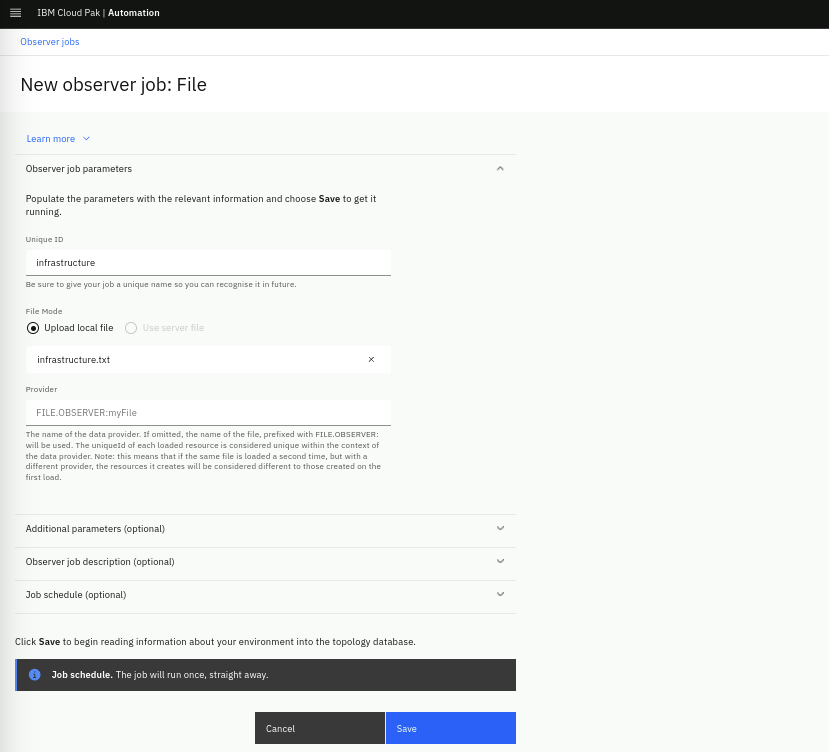
In the New observer job: File form, fill the Unique ID field as "infrastructure". Keep the File Mode as Upload local file. Click on Drag and drop file here or click to upload and from the pop-up file selection window, find the infrastructure.txt file under admin/lab.
Leave the Provider field unchanged, as shown below:
Click the Save button.
The File Observer job will run the moment it is saved. After you have done this, your Observer jobs page should look like the one below. You can verify that your job ran successfully by confirming the Ready status for each job:

7.3: Creating a Topology Resource Group
Now that we have topology resources, we will create a topology group using the "exact" topology group template. This template is useful for when you have a specific collection of resources that are unique in your environment that may be of particular importance. Perhaps you want to be able to find this group of resources quickly and easily, or visualize them on the screen.
- From the burger menu in the top-left, navigate to: Operate → Resource management.
- In the Resource management page, click on the Resource group templates icon in the top-right.
![]()
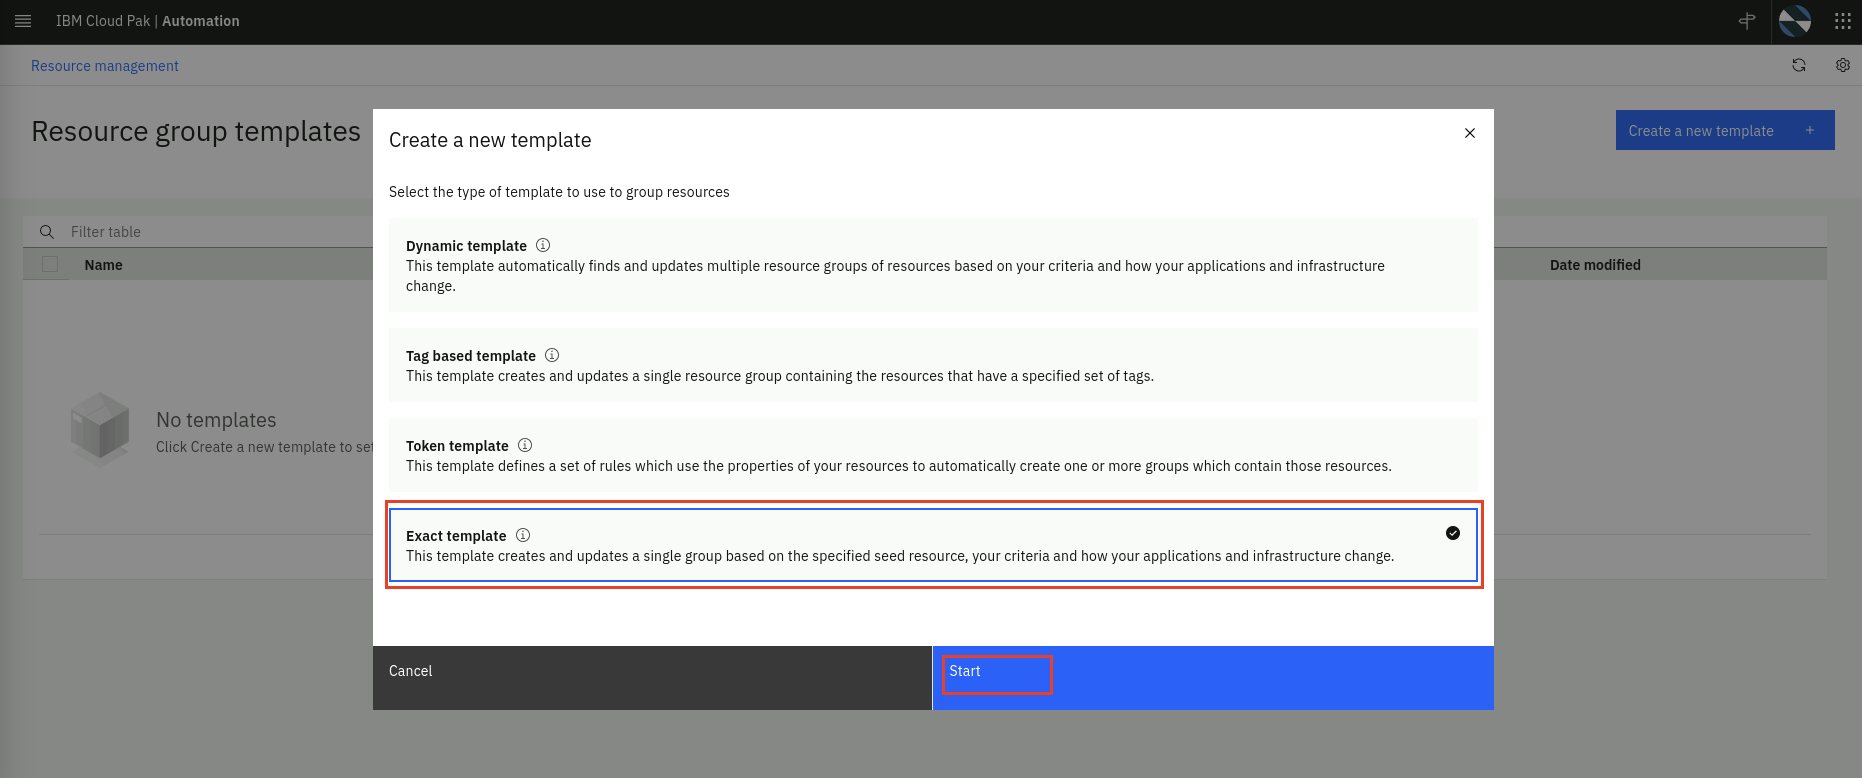
- In the Resource group templates page, click on Create a new template, select Exact template and click Start.
You will be presented with a Template builder page. From here, use the following steps to configure a new exact template:
- Set the Template name as My Resource Group.
- Skip the optional Description.
- Choose the Resource group type: network
- Under Resource group naming pattern, in the Name prefix field type ROUTER-
- Enable Correlate event groups on topologies from this template. This is actually the objective of this Lab section after all. We will correlate events that affect the resources in the same topology group. This template will create such group of topology resources.
- In the Search for a resource to get started on the right, type router1 and hit Enter
- Choose router1 from the list of resources. Your screen should look like this
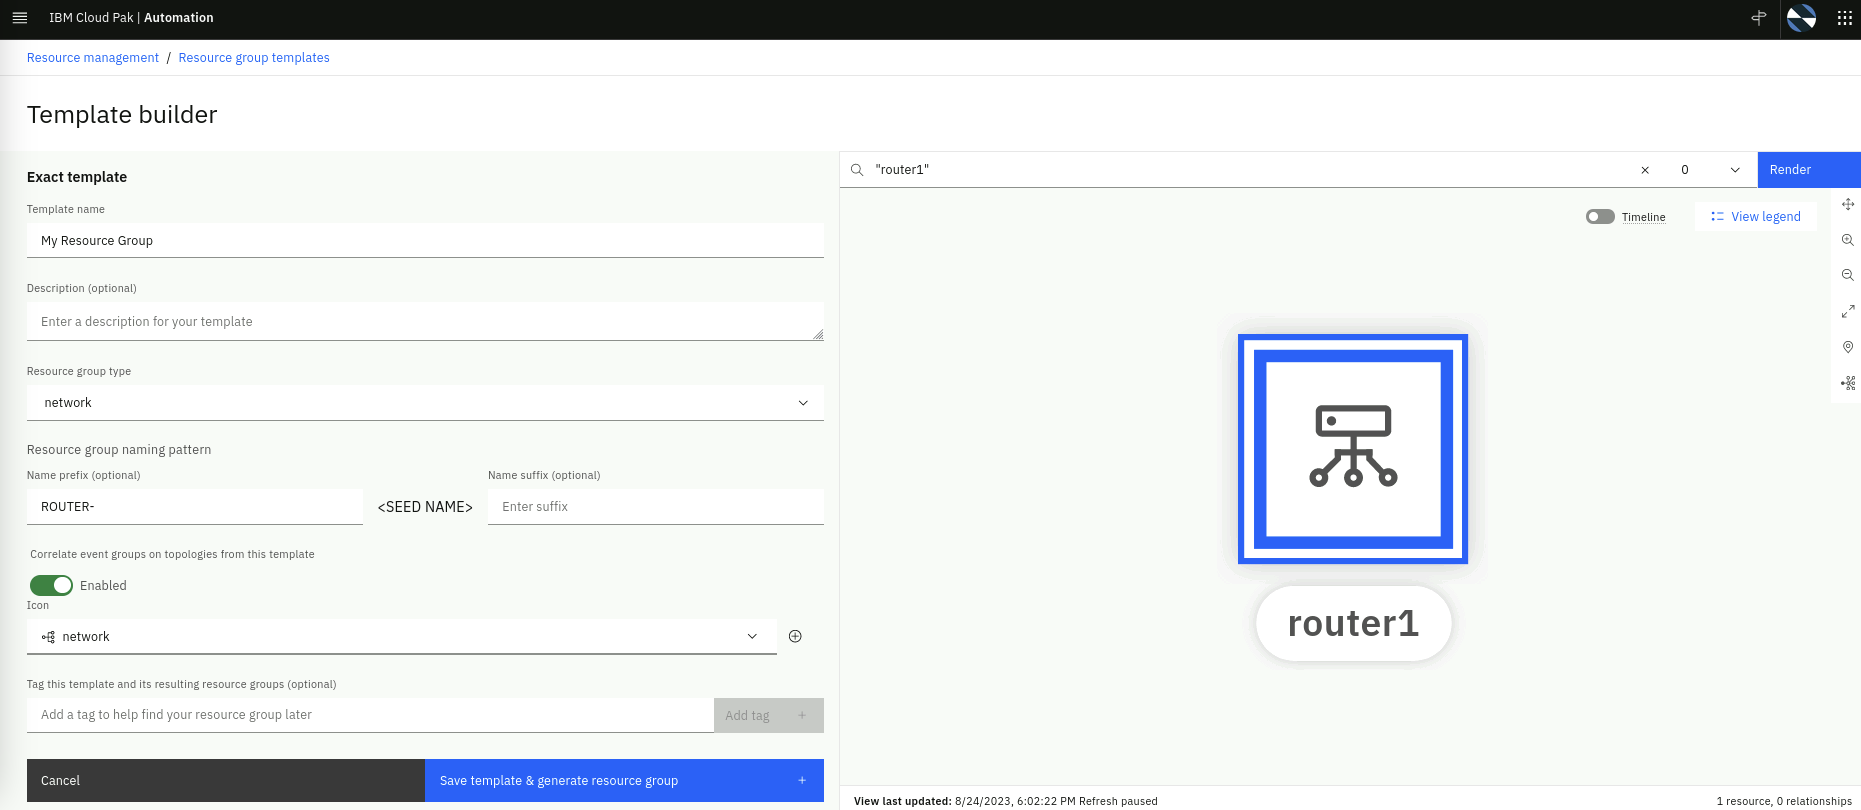
- On the top-right, change the view to 1 hop and click Render

In summary, we have selected 3 resources that will be part of a topology resource group, as render in the view. Your form should look like this:
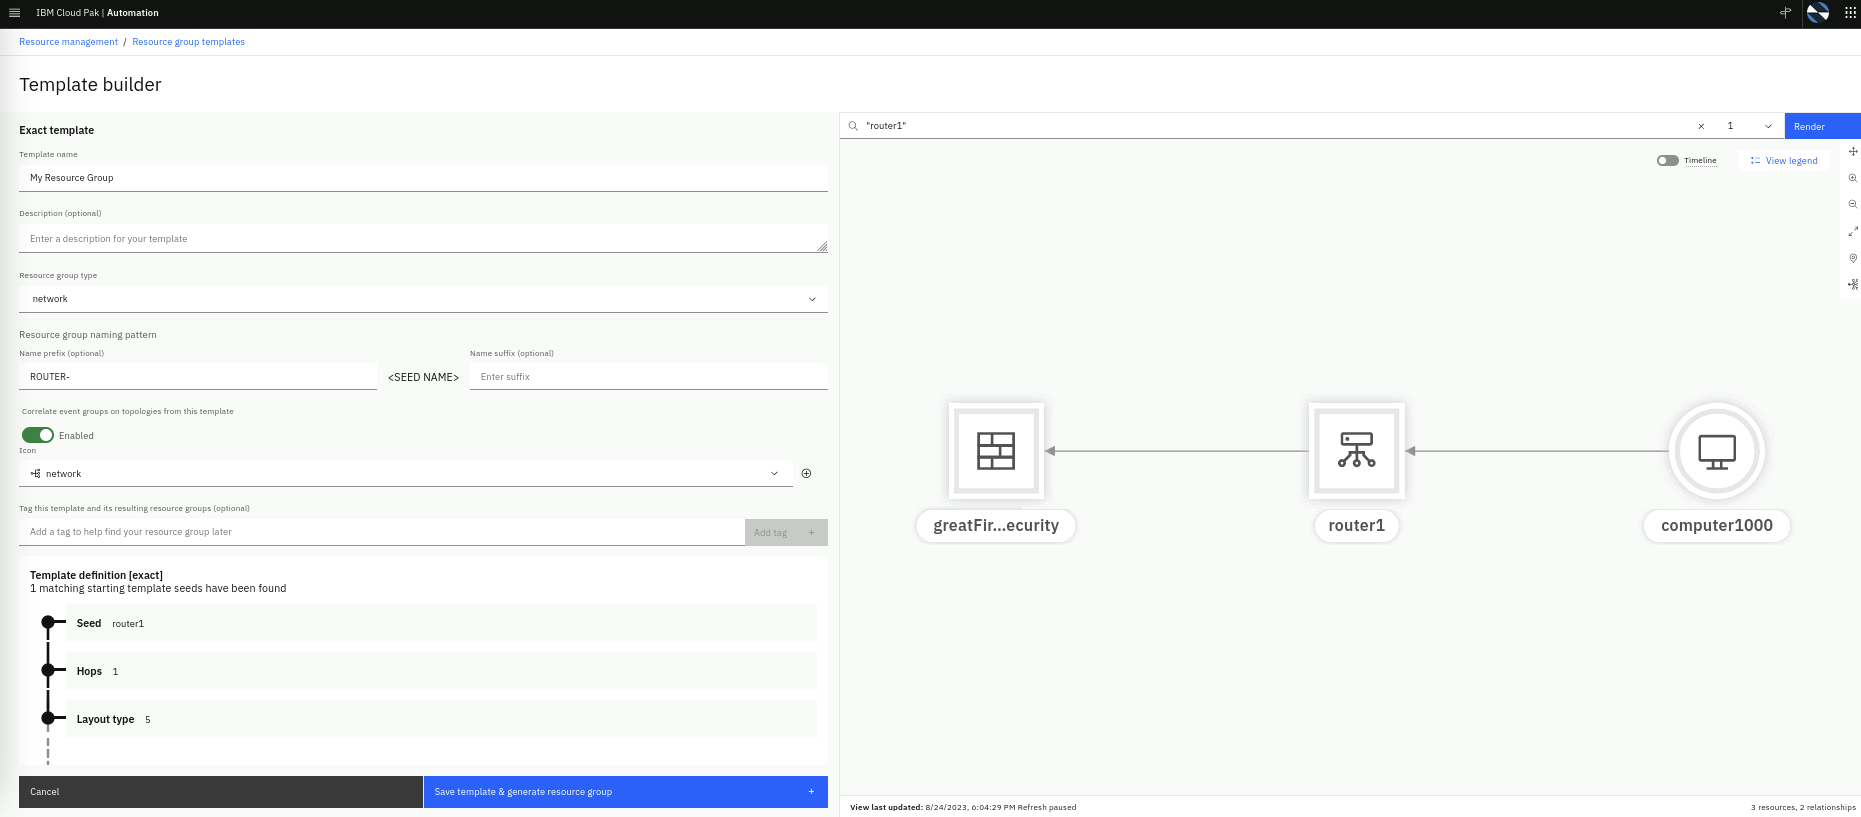
- Finally, click Save template & generate resource group
Click on Resource group templates in the top-left.

In the Resource group templates screen, you will see your new template:

Click on Resource management in the top-left and click on the Resource groups tab:

If you click on the name ROUTER-router1, you will be able to view the topology group, which consists of 3 resources:
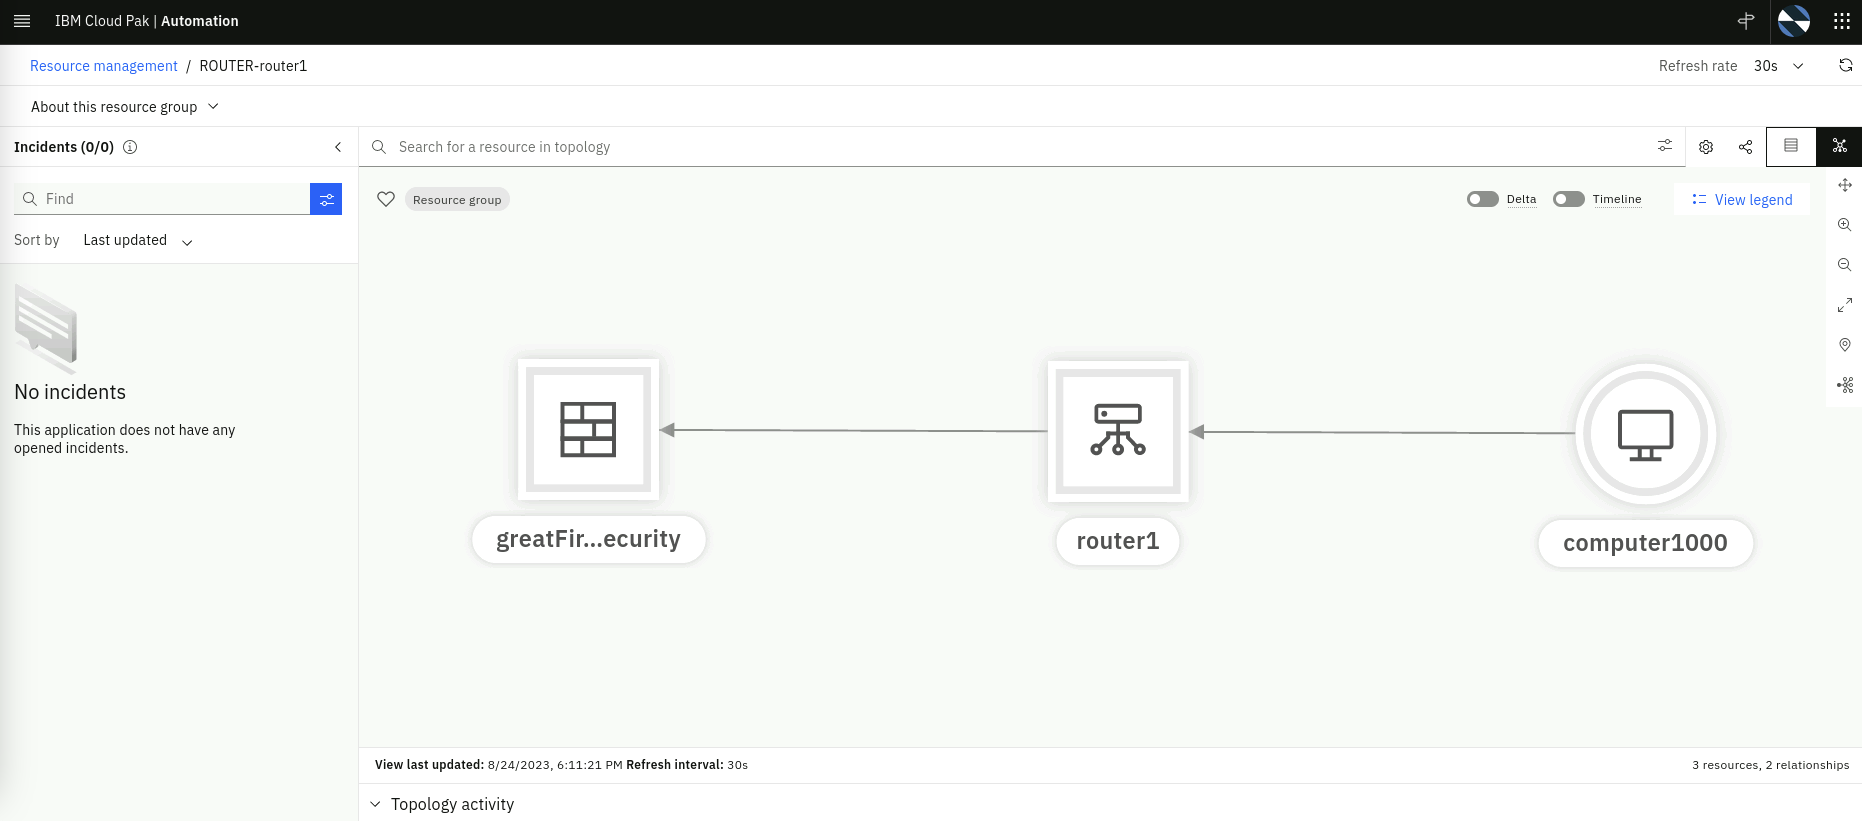
7.4: Validate Topological Correlation
Now we have a group of topology resources that we can use to validate topological correlation. We will reload the same set of events. Because these events impact resources we have in our topology map and there is a resource group that clump these resources together, these alerts will be correlated.
From the Terminal window, lets submit again the events via the webhook script created in the previous section by running the following command from the Terminal window:
bash event-load-webhook.sh topology-events.json
Lets verify how the alerts are shown in the topology view:
- From the burger menu in the top-left navigate to: Operate → Resource management.
- From the Resource management page, click on the Resource groups tab.
Now we can see the three alerts in the Resource alerts column, as shown below:

Click on the resource group ROUTER-router1 to see the resource details. Now we can see the three resources, each with one alert. Click on the Topology activity on the bottom to show the alert severity breakdown over time.
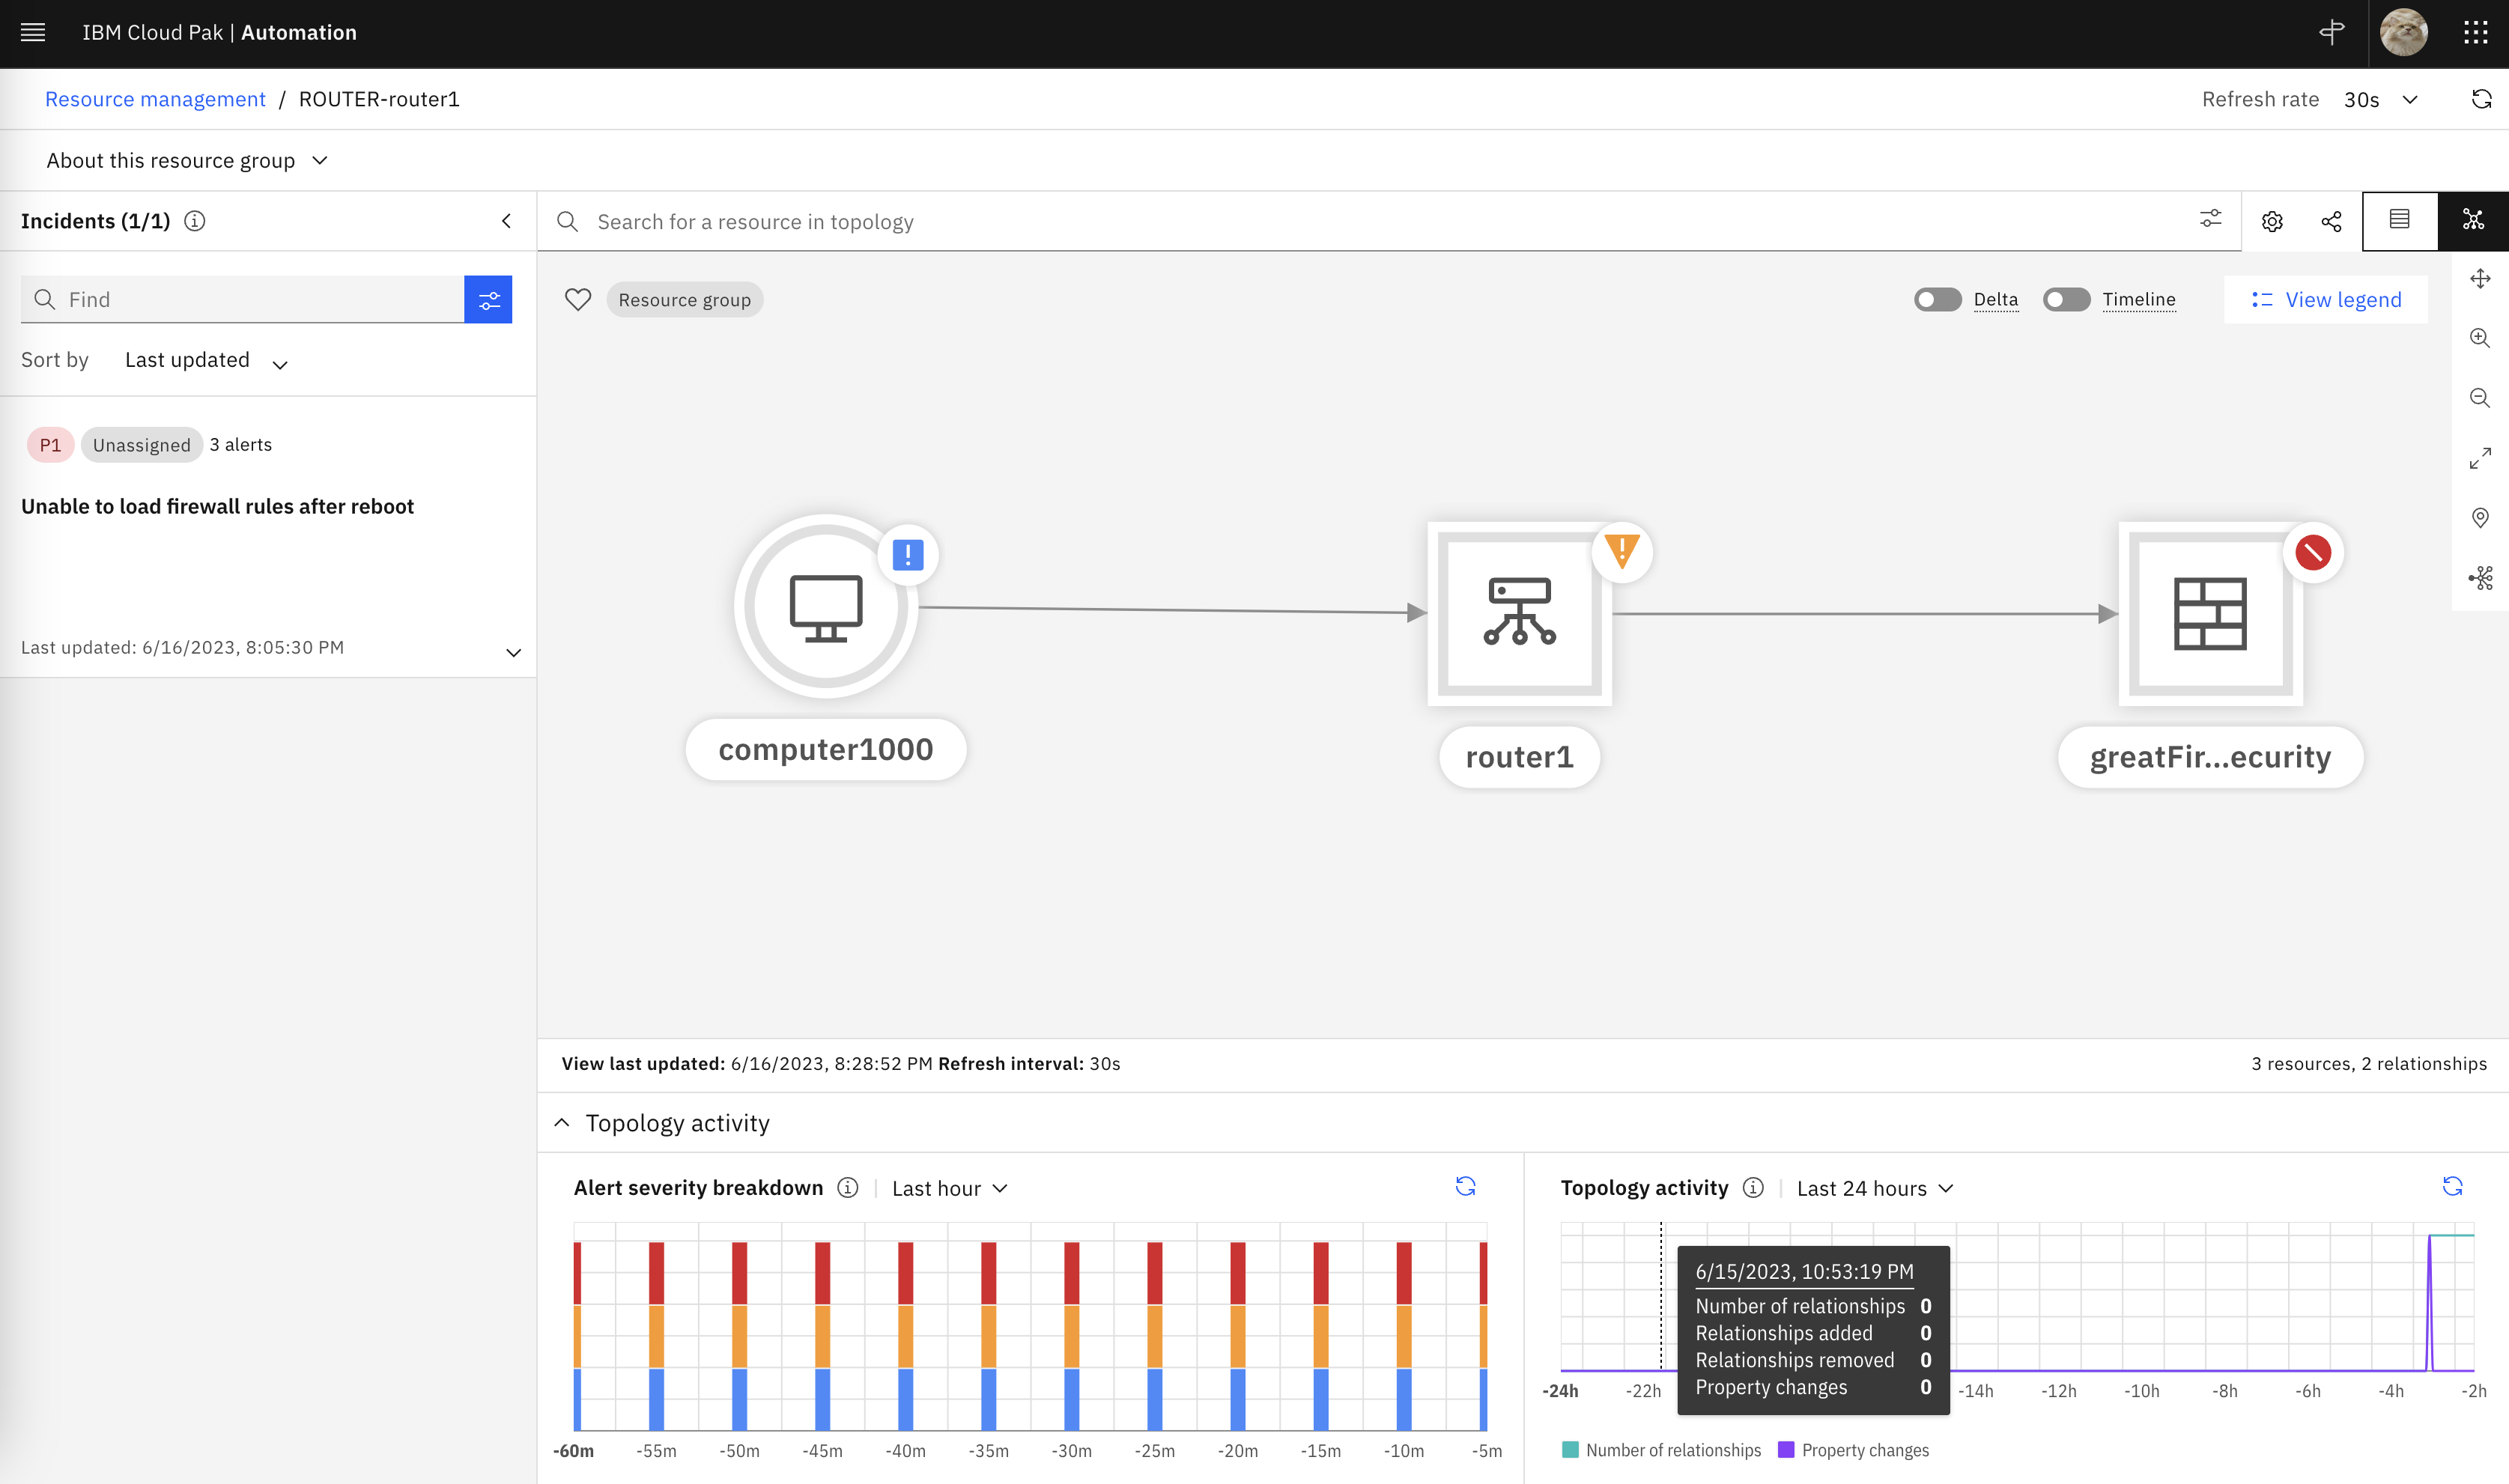
Lets validated that these alerts are indeed correlated.
- From the burger menu in the top-left navigate to: Operate → Alerts
Now we can see that the three alerts have been correlated under a single group.

Click on the chevron icon on the left to expand the group. Also click on the View correlation icon in the top-right, the Correlation column shows the topological group icon.

7.5: Lab Recap
Congratulations if you made it here!. We have seen a lot of features in a short period of time. If there is a single thought that you can take away from this Lab, this is it:
Event Management is a core feature of the Cloud Pak for AIOps, as it can consume IT Ops events from multiple sources and apply advanced event noise reduction capabilities, including event classification, deduplication, correlation, suppression, etc. This allows IT operations teams to respond quickly and proactively to slowdowns and outages, with end-to-end visibility and context.