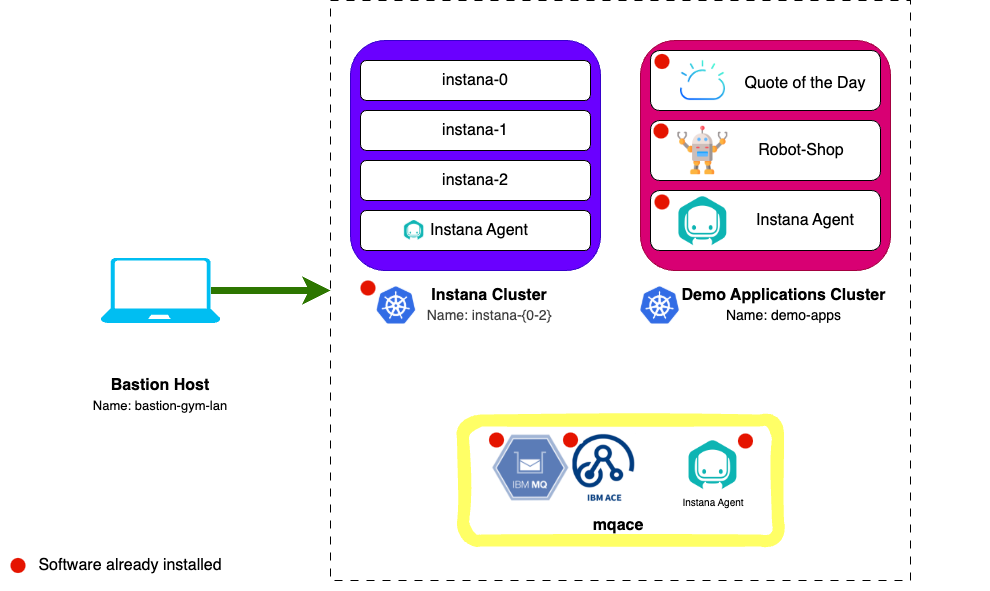
Monitoring IBM Middleware
4.1: Introduction
Positioning Instana at existing IBM customers often requires presenting the Instana value proposition in the context of other IBM middleware used by the client. In this section, you will find guidance about configuring and using Instana with the following IBM technologies:
- MQ
- App Connect Enterprise (ACE)
These have already been installed for us, ready to be configured on the mqace virtual machine.
4.2: Confirm MQ & ACE are running
Open a new terminal tab, ssh to the mqace machine and change to the root user:
Type yes when asked if you are sure that you want to continue connecting.
ssh jammer@mqace
sudo -i
Check the current status of MQ and ACE by running the following:
/opt/mqm/bin/dspmq -m QM1 -o all
source /opt/ace-11.0.0.11/server/bin/mqsiprofile
/opt/ace-11.0.0.11/server/bin/mqsilist
If MQ (QM1) and ACE (BK1) are both ready the output will look like this:
You can ignore the status; Integration node 'IBNODE' on queue manager 'QM1' is stopped. We are only interested in:
- QNAME(QM1) STATUS(Running)
- Integration node 'BK1' with default queue manager 'QM1' and administration URI 'http://mqace.ibmdte.local:4414' is running.
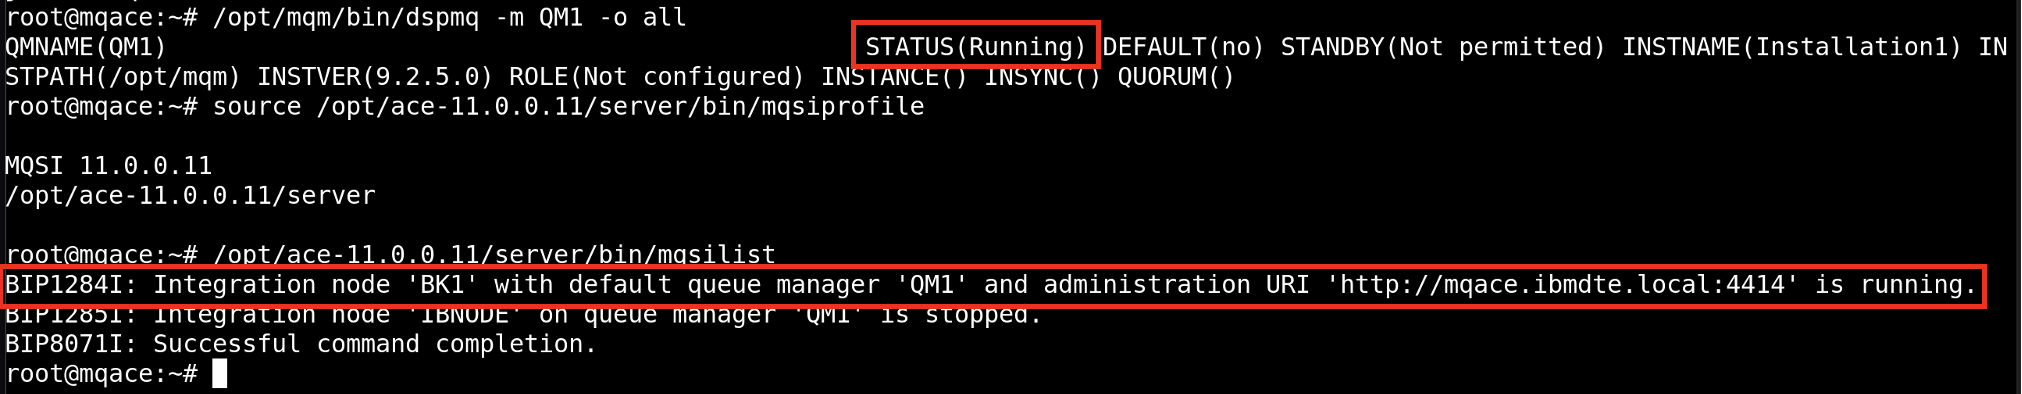
Carefully compare your output to the screenshot above.
4.3: Configure Quote of the Day Application to use MQ & ACE
The Quote of the Day application has been installed for you on the Demo Apps cluster.
For more information about the Quote of the Day application, you can go to the GitLab repository, it is not necessary to go there, but you might be interested in learning more about the application.
For the containerized portion of the application, some technologies are automatically instrumented for monitoring. In addition, the load generation tool is continuously running transactions against the application. Let's verify that things are running.
The following should be completed from the demo-apps host running as the root user.
Open a new terminal tab, ssh to the demo-apps machine and change to the root user:
ssh jammer@demo-apps
sudo -i
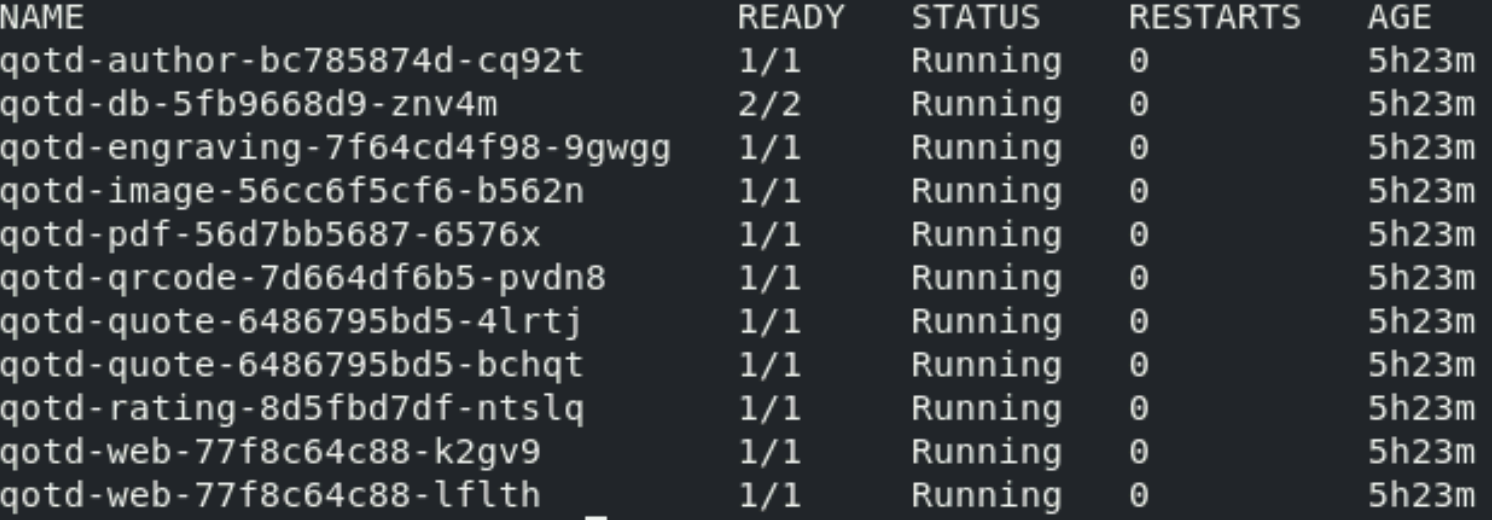
Issue the kubectl get pods command against the qotd namespace/project.
kubectl get pods -n qotd
You should see results similar to this:
The next step is to modify the configuration of the Quote of the Day application so that it uses an external ACE and MQ server. By default, the engraving service runs as a cloud native call that doesn't really do anything. We want to modify the configuration so that the engraving service makes a REST API call to ACE and ACE subsequently calls MQ and puts a message on a queue.
You can do this by editing the deployment for the qotd-engraving.
Type the following command:
kubectl edit deployment qotd-engraving -n qotd
This will open a "vi" session. Scroll down within the file to line 48. You should see 3 lines of text like the following:
If you want to display line numbers in vi, press the esc key to enter command mode and type ":set number".
- name: SUPPLY_CHAIN_URL
- name: SUPPLY_CHAIN_SIMULATE
  value: "true"
You need to modify those lines to look like the following. You need to add a "value" parameter that contains the SUPPLY_CHAIN_URL for the ACE flow. The flow within the ACE server is "http://<acemq_ipaddress>:7081/supplychain/v1/order". This is what you need to use for the SUPPLY_CHAIN_URL value, but replace <acemq_ipaddress> with the IP address of your ACE/MQ server, in this demo environment that is 192.168.252.70.
You will also need to change the value for the SUPPLY_CHAIN_SIMULATE to false to disable the simulation.
When you are done, the lines should look like this:
- name: SUPPLY_CHAIN_URL
  value: http://192.168.252.70:7081/supplychain/v1/order
- name: SUPPLY_CHAIN_SIMULATE
  value: "false"
Press the esc key to enter command mode and write your changes and quit the open file by typing the following and pressing enter:
:wq
As soon as you save your changes, kubernetes will automatically redeploy the "qotd-engraving" pod with the updated configuration.
Wait for the qotd-engraving pod rollout to complete:
kubectl rollout status deployment qotd-engraving -n qotd
To verify that the changes were applied successfully, let's check the application UI.
In Firefox, open the Quote of the Day bookmark.
You can manually find the URL by running the command
kubectl get ingress -n qotd and opening the URL with open this URL with
http:// in front.
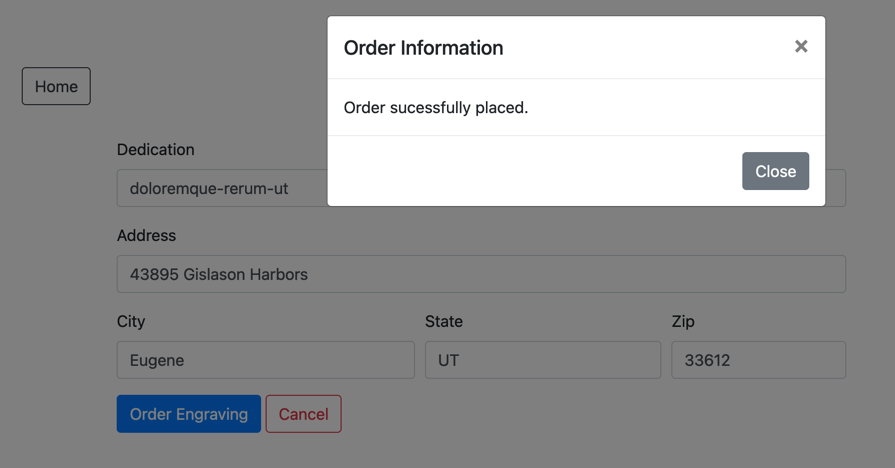
Once opened click the Order Engraving button.
Then, click again the Order Engraving button. If successful, you’ll see “Order successfully placed.”
4.4: Configure the ACE and MQ Sensors
In this section, you will continue to perform these commands as root on the mqace server.
If you do not have a terminal opened to the mqace server you can run the following:
ssh jammer@mqace
sudo -i
Change to the instana agent configuration directory:
Reminder: The Instana Agent you are about to modify was pre-installed for you on this server. If you want to learn more about the Instana Agent you can complete Server & Agent Installation lab
cd /opt/instana/agent/etc/instana
This is the main configuration directory for the Instana Agent and sensors.
There are few configuration files in the parent etc directory, but most of the
important ones are here.
- configuration.yaml - Sensor and other agent configuration parameters.
- com.instana.agent.main.sender.Backend.cfg - Contains information on where the Agent is going to send the monitoring data.
We are going to be editing the configuration.yaml file. This file contains all of the configuration settings for the sensors.
Take a backup before you actually edit the configuration.yaml file:
cp configuration.yaml configuration.yaml.bak
This environment is provisioned with Ansible which sets some defaults. Reset the configuration.yaml file to the default settings before you start editing it.
sed -i '/# BEGIN ANSIBLE MANAGED BLOCK/,/# END ANSIBLE MANAGED BLOCK/d' /opt/instana/agent/etc/instana/configuration.yaml
Edit configuration.yaml using either "vi" or use other editor like nano if you
prefer.
vi configuration.yaml
YAML files are very strict about indentation. Each line within the file must be indented by 0, 2, 4, 6, etc. spaces. Do not use tabs and do not indent by odd numbers of characters. Make sure that all of the characters line up vertically within the text. If you see a line that is commented out and you need to uncomment it, just remove the single "#" character.
ACE Configuration
Within the editor, scroll down to the section titled "# IBM ACE"
You will need to uncomment the required entries and change the parameters to match the ACE/MQ configuration on this server. If you read the description on each line, you'll see that some parameters are optional.
For more information about about the ACE configuration view the online documentation
In addition, here is a blog that provides additional information on configuring the sensor
There are multiple options for configuring the sensor. The information shown matches this particular environment. A few key possibilities:
- If ACE is configured for MQTT, the configuration will be different than if ACE is configured to use MQ.
- The configuration will be different if you are doing remote monitoring vs. local.
- Pay careful attention to the required vs. optional parameters. For example, in some environments the MQ Channel Authentication is disabled and you don't need to specify credentials.
In our demo environment, we have the most common configuration. ACE is configured to use MQ instead of MQTT. And, we require credentials to connect to the channel.
One other important factor when setting up ACE monitoring. The user that is connecting to the MQ channel needs to have permissions on some MQ objects such as queues and topics. If the ACE sensor is not working, look at the MQ log to see if there are any permissions errors. The MQ log path will be "/var/mqm/qmgrs/QM1/error/AMQERR01.LOG" where QM1 is the Queue Manager name. Look for the string insufficient authority and the log will tell you which object and permissions are missing.
Edit the IBM ACE section of the file so that it looks like this. If you want, you can copy this text and replace the entire section. Or, you can change the individual parameters.
# IBM ACE
com.instana.plugin.ace:
  enabled: true
  poll_rate: 20
  NodesOrServers: # Multiple Integration node instances or multiple standalone Integration Servers can be specified
    BK1: # specify the Integration node/server name (required)
      restApiPort: "4414" # ACE rest api port (required)
      mqport: "1414" # Sets the port for remote administration IBM MQ channel port or the MQTT server port (required)
      queuemanagerName: "QM1" # Queue Manager name (required for IBM MQ)
      channel: "ACE.SVRCONN" # Remote administration channel (required for IBM MQ)
      mqUsername: "mqm" # MQ channel authentication's username if security enabled (optional for IBM MQ)
      mqPassword: "Passw0rd" # MQ channel authentication's password if security enabled (optional for IBM MQ)
In the example above, QM1 is the Queue Manager name. BK1 is the name of the Integration Server. ACE.SVRCONN is the channel that the sensor will connect to in order to query the performance KPIs. The username of mqm is the admin username for MQ, but the sensor does not require administrative permissions. Any valid MQ user can be specified as long as it has permissions to connect to the channel.
The Instana engineering team has created a script that will setup all of the required permissions within MQ .
MQ Configuration
Next, you will need to edit the MQ sensor settings. Scroll further down in the file until you find the section titled "IBM MQ". You will be editing this section of the configuration to match the settings of the MQ server. There are a number of mandatory and optional parameters. For more information on the configuration settings, see the online documentation: link
The MQ sensor also has a number of different possible configurations. The most common is for the sensor to connect to a channel using credentials. But, it is possible to configure without credentials by disabling MQ channel authentication. In addition, if the Instana Agent runs as a user that is a member of the mqm group, then the sensor will automatically discover and instrument MQ.
For more information on configuring the MQ sensor, see the product documentation: link
In addition, this blog contains additional debugging steps: link
Edit the # IBM MQ section of the file so that it looks like this. If you want, you can copy this text and replace the entire section. Or, you can change the individual parameters.
# IBM MQ
com.instana.plugin.ibmmq:
  enabled: true
  poll_rate: 30
  queueManagers: # Multiple Queue Manager instances can be specified
    QM1:
      channel: "ACE.SVRCONN" # Remote administration channel
      username: "mqm"
      password: "Passw0rd"
If you edit the default yaml, you will see QUEUE_MANAGER_1. You will be replacing QUEUE_MANAGER_1 with the actual queue manager name (QM1).
Save the changes and exit the editor, press the esc key to enter command mode and write your changes and exit the file by typing:
:wq
Configure ACE and MQ for Resource Monitoring
You do not need to perform any steps in this section, it is for information only.
This section of the lab will help you understand how IBM MQ and IBM App Connect Enterprise (ACE) need to be configured for monitoring. There are certain configuration settings within MQ and ACE that are required in order to get the monitoring KPIs. For ACE, the key KPI's that need to be enabled are Resource Stats and Flow Stats. The requirements are documented in the sensor configuration guide that is online. You'll see links to those guides further down in this document.
Typically, these steps are performed by the MQ and ACE admins, so you don't need to know the step by step procedure. But, you do need to tell the MQ/ACE admins what the monitoring requirements are.
Verify the ACE configuration
The "Resource Monitoring" (Resource Stats) KPIs are already enabled in most
customer environments. But it is worth validating the configuration. It is less
common to see Flow Stats enabled. For example, you can use the ACE
mqsireportresourcestats and mqsireportflowstats commands to view the
configuration for ACE.
Open in a new Terminal tab and SSH to the mqace server
ssh jammer@mqace
Become root user on mqace node:
sudo -i
To run the following commands you have to source the mqsiprofile:
You might see 'mqsiprofile repetition disallowed', this can be safely ignored.
. /opt/ace-11.0.0.11/server/bin/mqsiprofile
In the commands listed, BK1 is the Integration Node name and would be different if the Integration Node had a different name. EG2 is the name of the Integration Server and will vary from environment to environment. There can also be multiple Integration Servers configured on a single Integration Node.
Here are example commands that you can issue to see the ACE configuration for Integration Node BK1 and Integration Server EG2:
mqsireportresourcestats BK1 -e EG2
You will see results similar to those shown below. Notice that the "state" is set to "true" indicating that "Resource Stats" are enabled and it is set to "Active"

To see the configuration of the "flow" stats, issue the following command:
mqsireportflowstats BK1 -s -e EG2
You will see results similar to those shown below. Notice that the "state" is "active", and the outputFormat is "json". This indicates that the "Flow Stats" are enabled. The product requires that the output format be set to json vs. XML.

Verify the MQ configuration
There are fewer requirements for MQ. The sensor will work with the default settings. However, you can have the sensor automatically use thresholds/Events that are setup within the MQ server. If you want to use the built in MQ Events, then you need to set CHLEV (Channel Events) and PERFMEV (Performance Events) to ENABLED. To check those settings, you can issue the following commands.
To run the following commands you have to source the setmqenv and specify the
queue manager name (QM1) like below:
. /opt/mqm/bin/setmqenv -m QM1
You first need to run the "runmqsc" command.
/opt/mqm/bin/runmqsc QM1
The runmqsc command won't prompt you with a cursor. That's okay. Just start typing the commands.
Within the runmqsc command prompt you can issue other MQ commands. Type the following commands:
display QMGR PUBSUB CHLEV
display QMGR CLUSTER PERFMEV
These commands will give outputs similar to what's shown below.
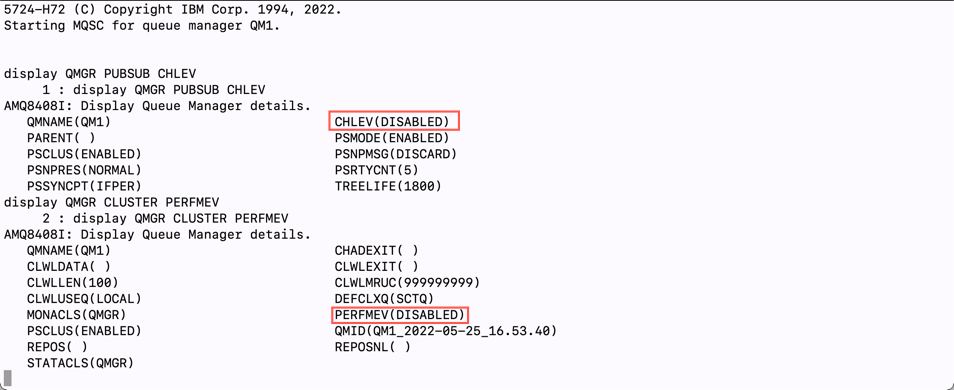
In the output, you can see that the CHLEV (Channel Events) and PERFMEV (Performance Events) is set to disabled.
To enable run the following commands:
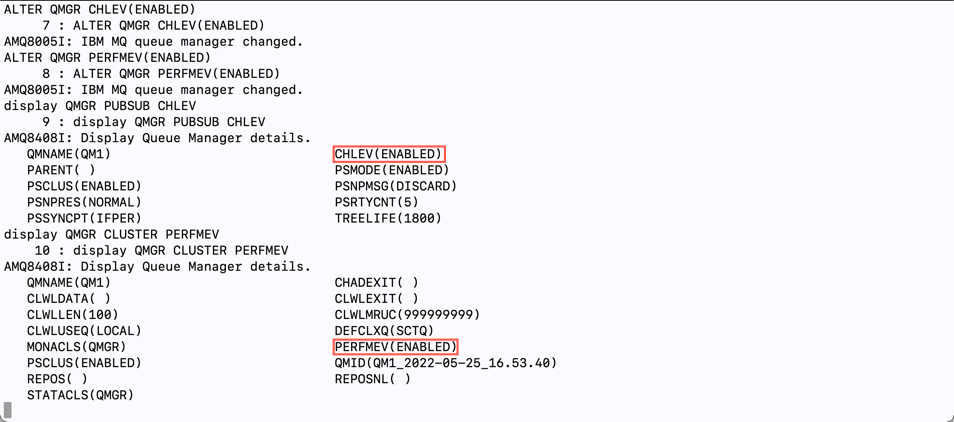
ALTER QMGR CHLEV(ENABLED)
ALTER QMGR PERFMEV(ENABLED)
Re-run the display command to verify that configuration was changed
display QMGR PUBSUB CHLEV
display QMGR CLUSTER PERFMEV
Type "quit" to exit the runmqsc command prompt.
quit
Configure ACE and MQ for Tracing
You do not need to perform any steps in this section, it is for information only.
In addition to the "Resource Monitoring" KPIs, additional settings are required to enable Tracing within IBM MQ and ACE. It is important that you understand this process since Tracing is typically not enabled by default in most IBM MQ and ACE environments. In this section, we've documented the steps.
Typically, these steps are performed by the MQ and ACE admins, so you don't need to know the step by step procedure.
There are multiple options for Tracing transactions through ACE and MQ. You options depend on the version of ACE and MQ as well as the platform. In older versions of ACE and MQ, it was necessary to install an Instana User Exit in order to monitor the traces. In recent versions of ACE and MQ, these products have added support for OpenTelemetry tracing.
For ACE, we recommend using OpenTelemetry tracing because it has less overhead. For MQ, the Instana User Exit and OpenTelemetry have similar characteristics. For information on OpenTelemtry tracing within ACE and MQ, see the product documentation for ACE and MQ.
In this lab, we will be using the Instana User Exit.
This section is simply going to describe the process. The procedure is well documented within the Instana online documentation. You will find a Tracing section within the sensor documentation that can be found here.
For ACE, you perform the following steps
- Download a small TAR file from IBM Fix Central. There is a link for artifactory within the Instana documentation.
- Extract the tar file into the /var/mqsi/shared-classes directory
- Stop the ACE server
- Run the following command to "Install" the User Exit: mqsichangeflowuserexits BK1 -o -x /var/mqsi/shared-classes
- Start the ACE server
- Activate the User Exit by typing: mqsichangeflowuserexits BK1 -o -a ACEOpenTracingUserExit
The MQ procedure is similar.
- Download a small TAR file from either artifactory or IBM Fix Central. There are links within the Instana documentation.
- Extract the tar file to /var/mqm/exits64
- Edit the /var/mqm/mqs.ini file
- Add a small section within the /var/mqm/mqs.ini file. The content can be copied and pasted from the Instana documentation.
- Restart the Queue Manager
The mqs.ini file should contain the following additional information:
ApiExitCommon:
   Sequence=100
   Function=EntryPoint
   Module=/var/mqm/exits64/mqtracingexit
   Name=TracingApiExit
In the lab environment, these steps have already been performed. If you want, you can examine the files and directories specified above.
Even though the TAR files for ACE and MQ look similar, they are unique for each middleware component.
In addition, it is important that you select the tar file for the platform that you are running. There are unique packages for x64_64 Linux, Power Linux, AIX, etc.
4.5: Further Configuration
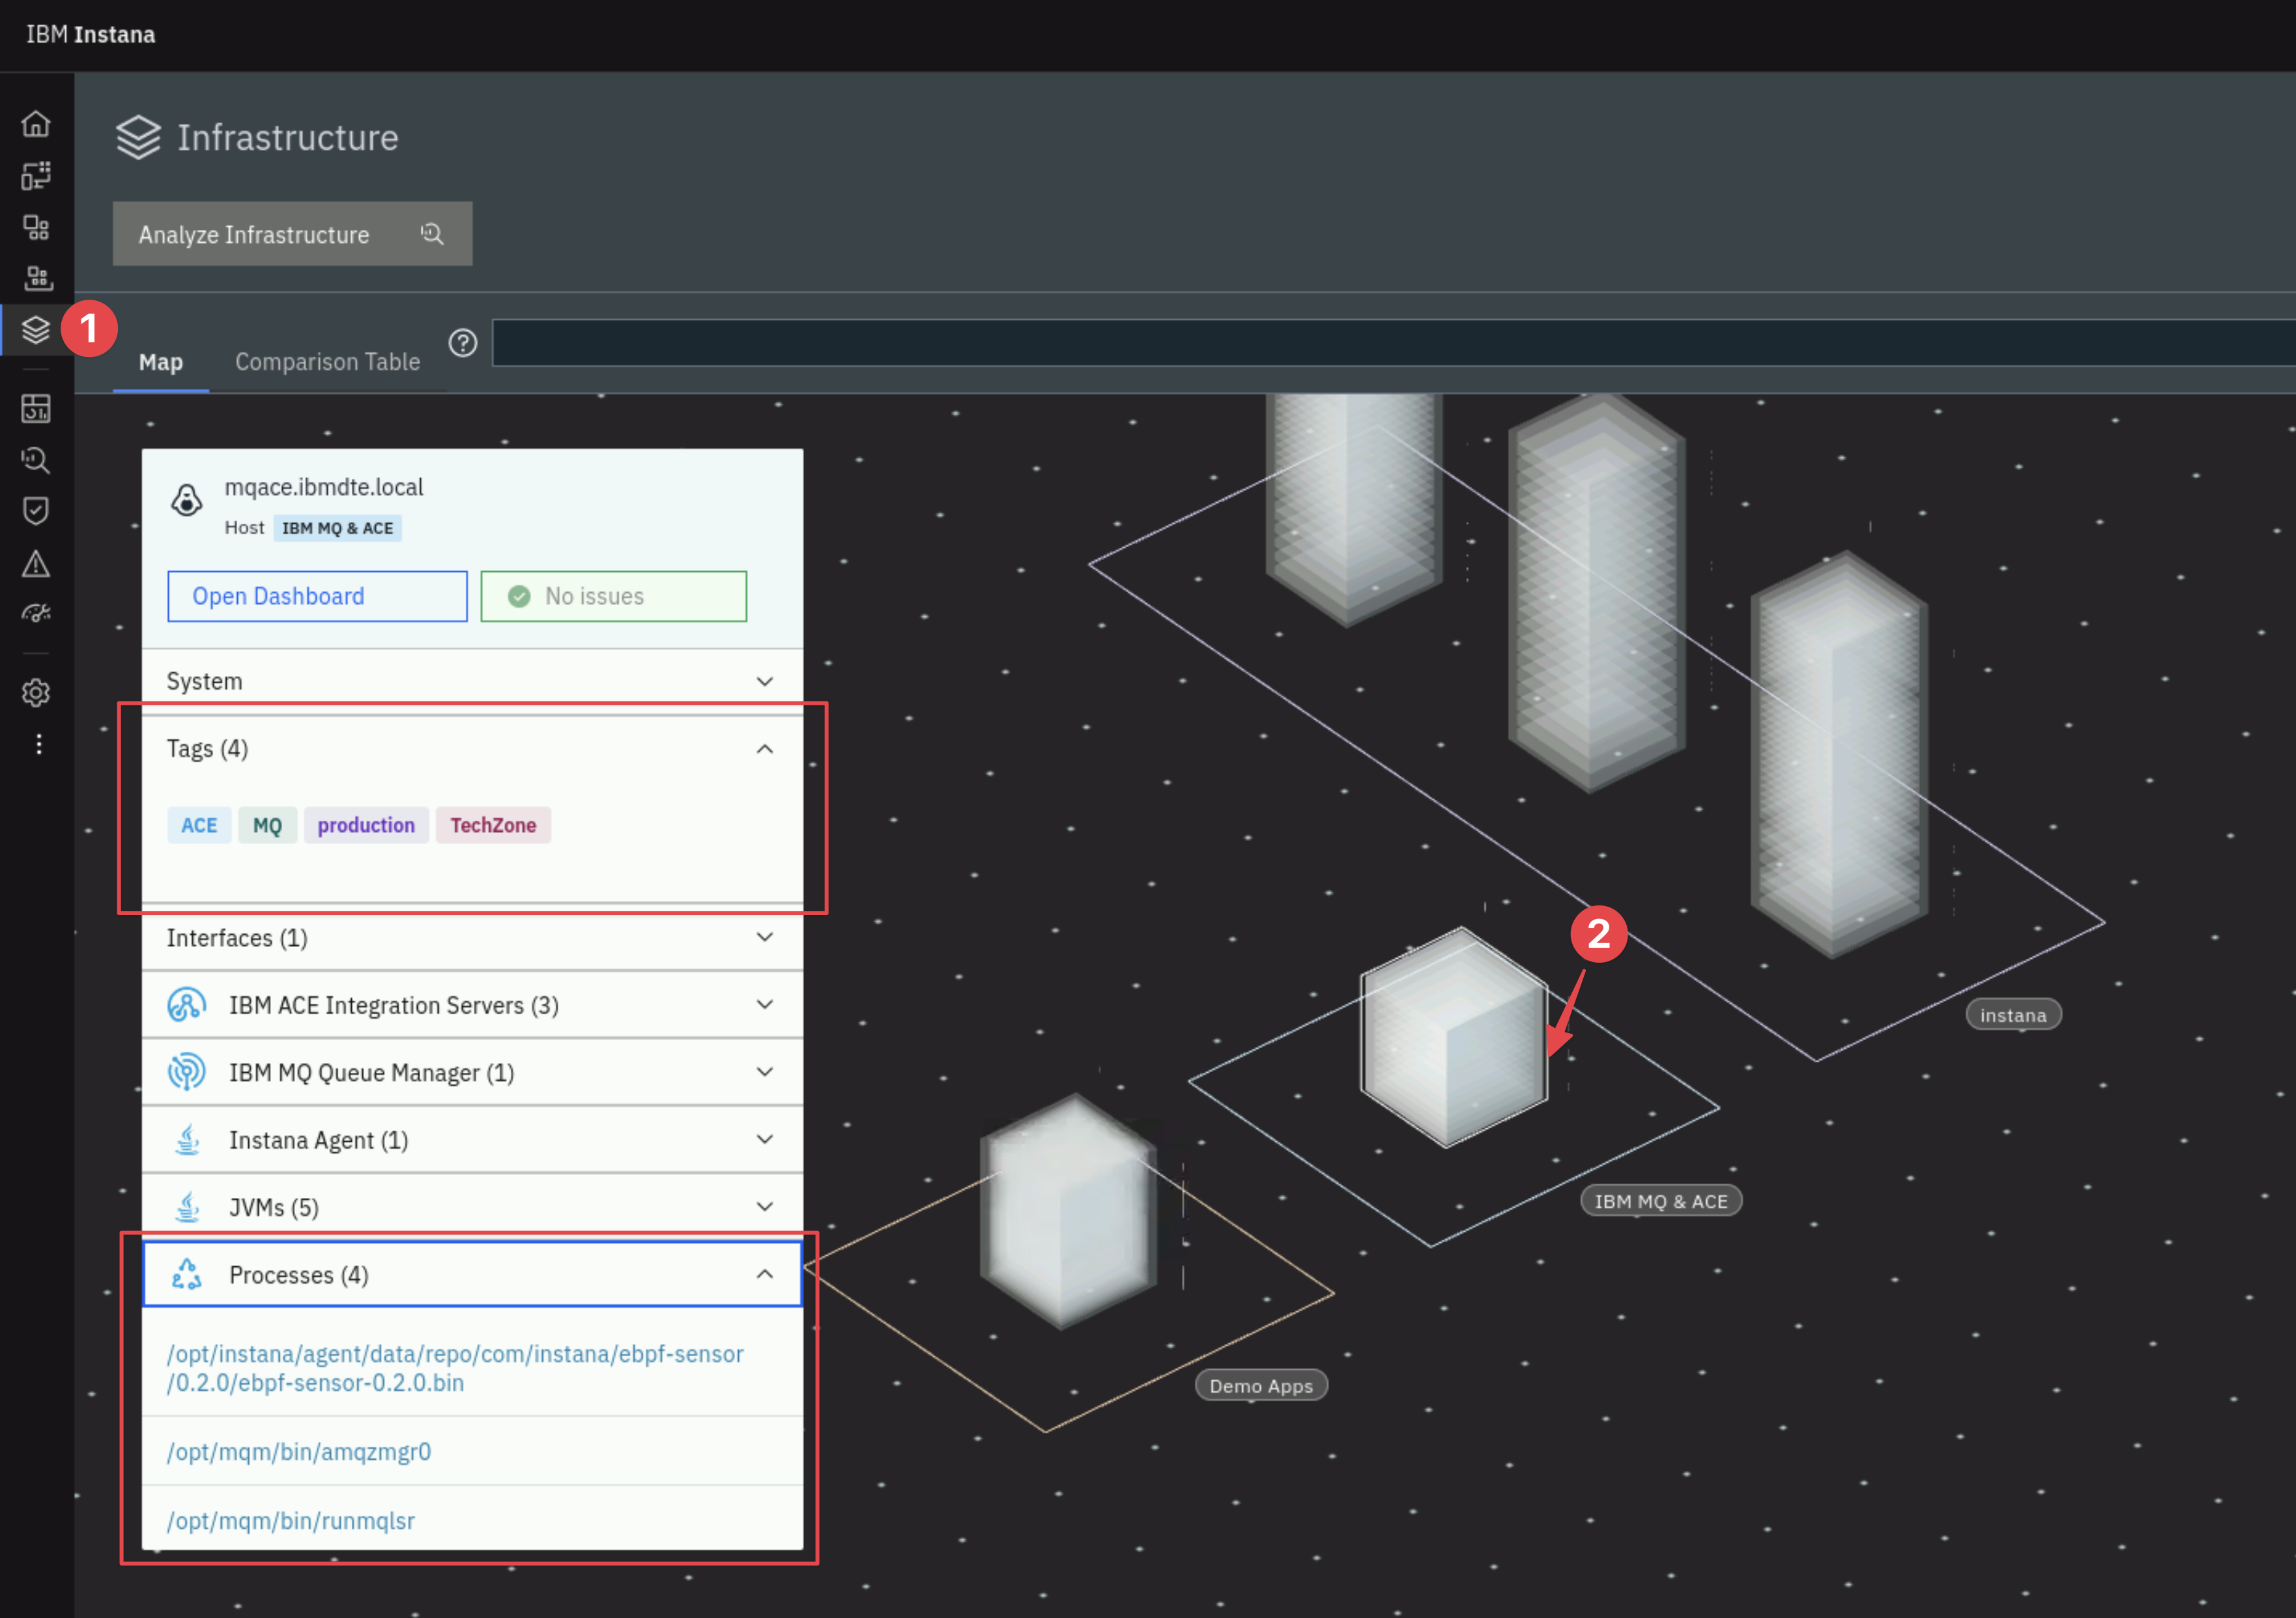
After installing an Instana Agent, one of the first things you want to do is set a Zone name. This allows you to organize your Agents to make them easier to find. The Zones can also be used for custom queries, threshold distribution, and more. In this environment the zone for the mqace server is MQACE, lets update that to IBM MQ & ACE.
Once again open the configuration.yaml file for editing:
vi configuration.yaml
Scroll down until you see the section titled # Hardware & Zone. Uncomment
the 3 lines of text starting with com.instana.plugin.generic.hardware. Change
the availability-zone to IBM MQ & ACE.
The section of the configuration.yaml file should look as follows:
This demo environment is provisioned
# Hardware & Zone
com.instana.plugin.generic.hardware:
  enabled: true # disabled by default
  availability-zone: "IBM MQ & ACE"
In addition to configuring the Zone name, you can specify tags within the configuration.yaml file.
Search for the section within the configuration.yaml file titled # Host. Within that section, you see a section for tags. By default this section will be commented out. Uncomment the com.instana.plugin.host section and specify some tags. Add the following:
- production tag to indicate that this system is a production server.
- MQ tag to indicate the application running on this server.
- ACE tag to indicate the application running on this server.
- TechZone tag to indicate the the server resides in IBM Tech Zone.
com.instana.plugin.host:
  tags:
    - "production"
    - "MQ"
    - "ACE"
    - "TechZone"
It is possible to specify tags for the Docker and OpenShift versions of the Instana Agent, but we are not going to cover that in this lab.
Zones and Tags can be used for a number of purposes within instana:
- Search for systems within the UI or via the APIs
- Assign thresholds to systems with a specific tag or zone name
- Build custom dashboards using the tags or zone names and more...
By default, Instana will monitor key processes that are related to the applications/middleware that are being monitored. It will also monitor processes that are consuming large amounts of CPU or Memory. Sometimes, customers want to ensure that specific processes are monitoring. Let's edit the configuration.yaml file to specify some key processes on this ACE/MQ server.
Search within the configuration.yaml file for # Custom processes
The section will be commented out by default. Uncomment the section and specify the following processes for monitoring. One process is the cron daemon, which customers frequently want to monitor. The other two process are related to IBM MQ. The section should look like this:
com.instana.plugin.process:
  processes:
    - "crond"
    - "amqzmgr0"
    - "runmqlsr"
Another option is to specify combineTopProcesses as seen below. This option
causes Instana to monitor the top 10 processes in terms of CPU usage and the top
10 based on memory usage
com.instana.plugin.host:
  combineTopProcesses: true
There is also a section in the configuration.yaml file where you can specify processes that you want to ignore. Search for com.instana.ignore.
Save and exit the configuration.yaml file. Press the esc key to enter Command Mode and then write your changes and exit the file by typing:
:wq
As soon as you save your changes to the file, Instana will detect those changes and will start to implement what you have configured.
After a few minutes you will see the updates displayed in the Instana UI on the Infrastructure Page
The main Instana agent log file is located at
/opt/instana/agent/data/log/agent.log. You can watch the log output to see the
agent discovering entities and potentially any errors or warnings it encounters.
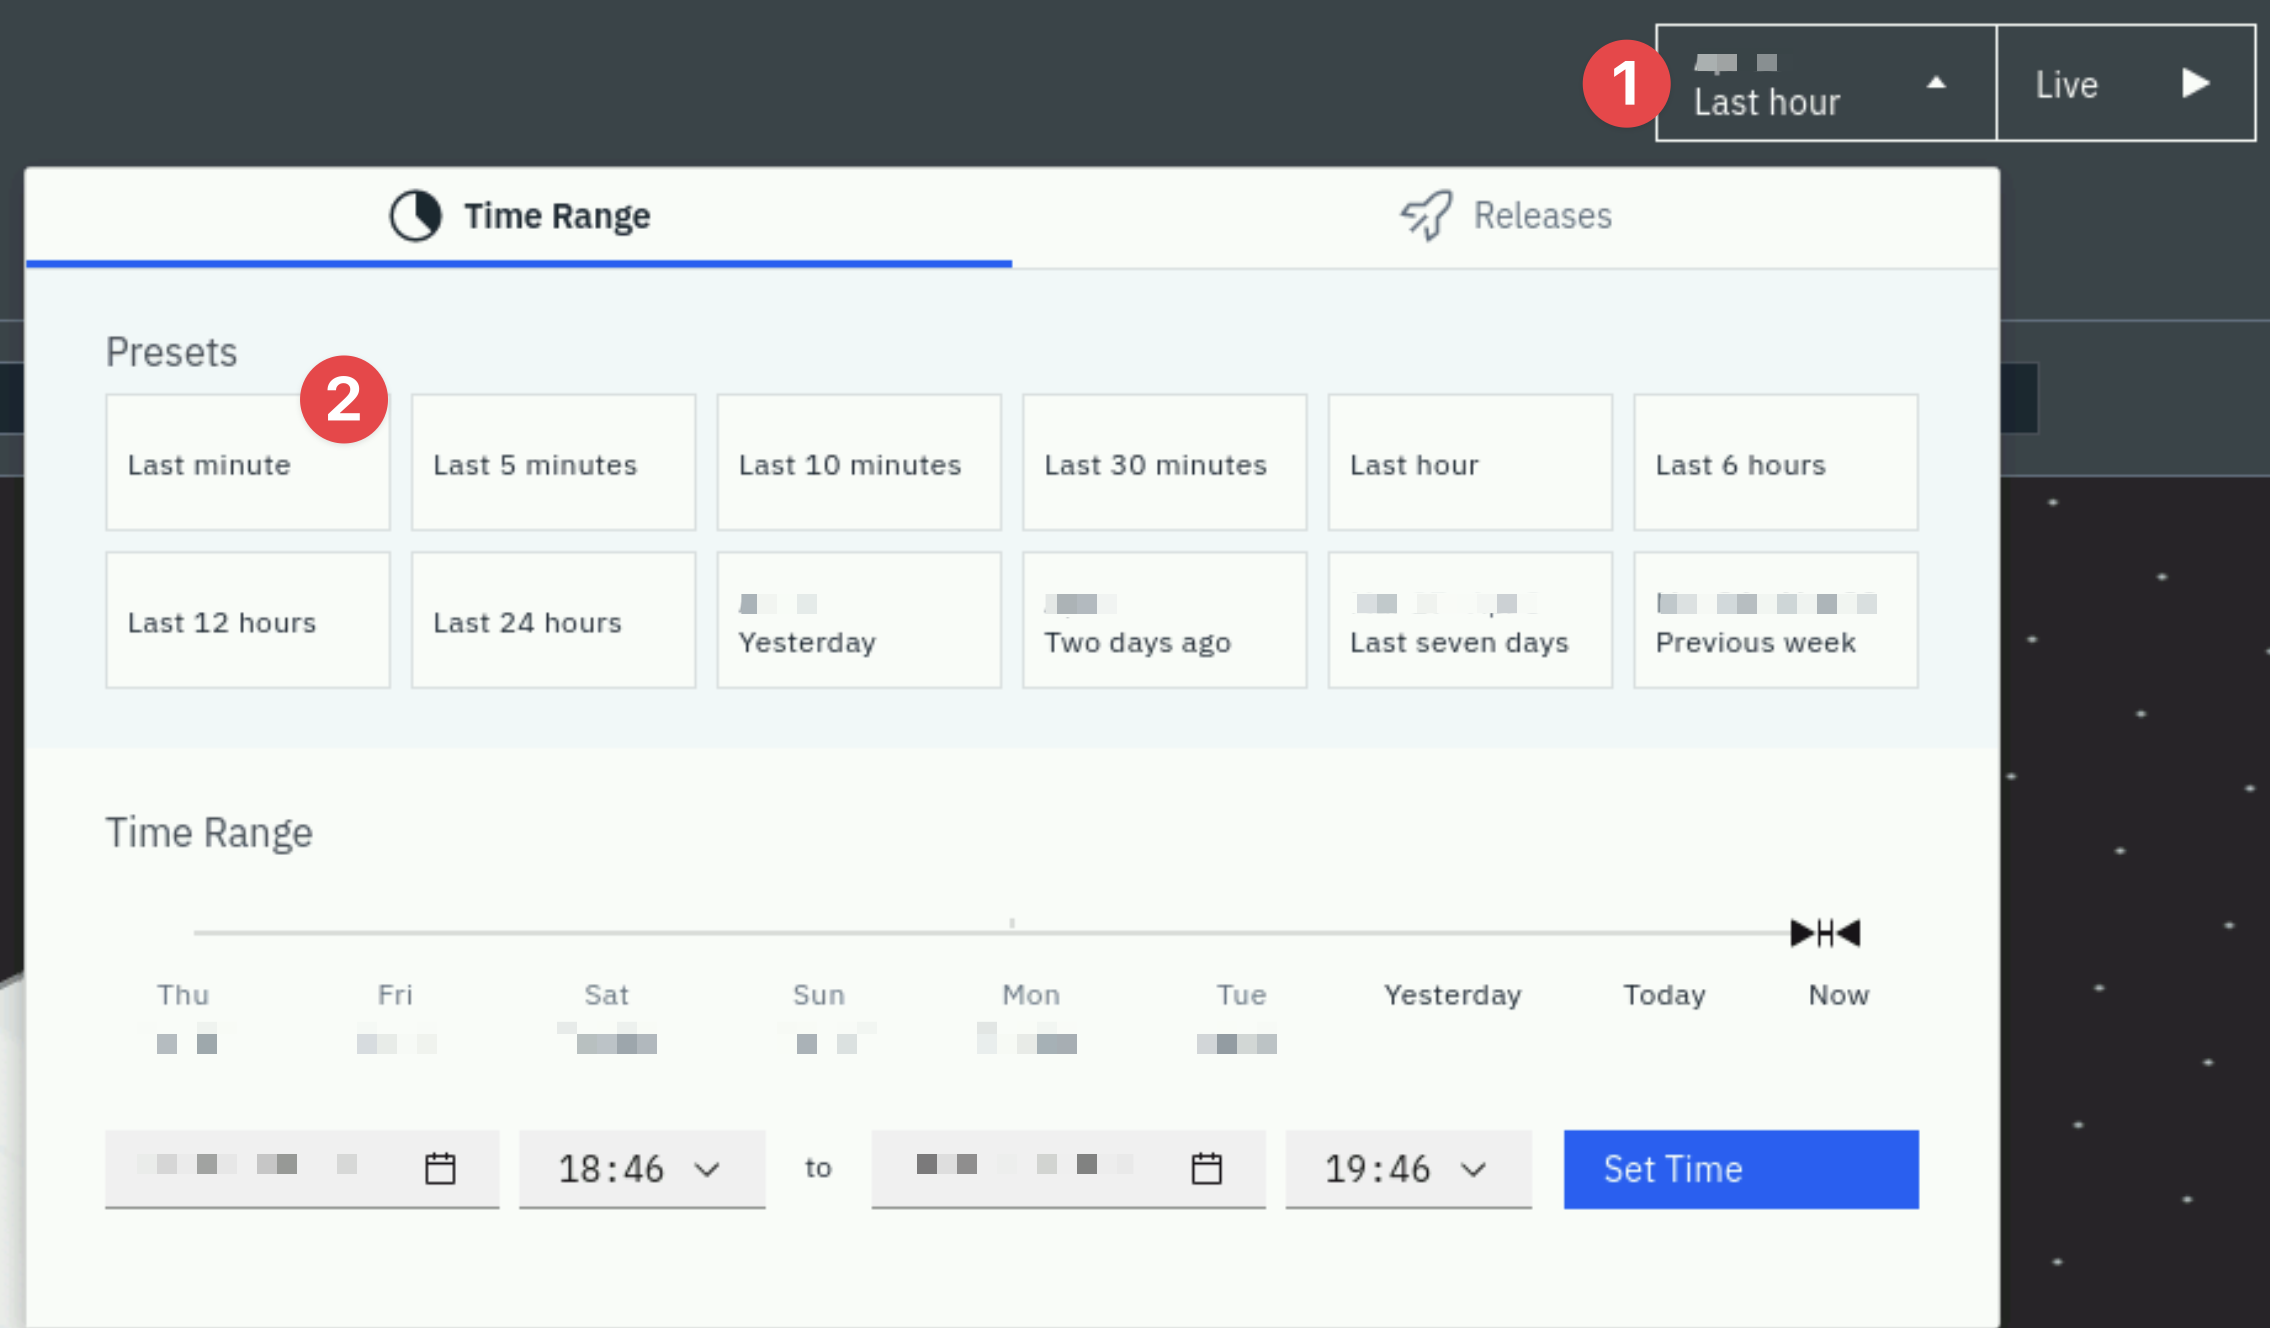
If you haven't seen updates in the Instana UI after 5 minutes you can try adjusting your time range filter. Select a shorter range or enable Live.
4.6: Summary
You learned how to configure the Instana sensor for IBM App Connect Enterprise (ACE) and IBM MQ. This includes customizations such as;
- Configuring tags
- Setting the zone name
- Configuring specific processes to monitor.