Explore Instana
Follow this tutorial to explore some key Instana capabilities including:
- Monitoring of Kubernetes
- Monitoring of applications
- Monitoring of infrastructure
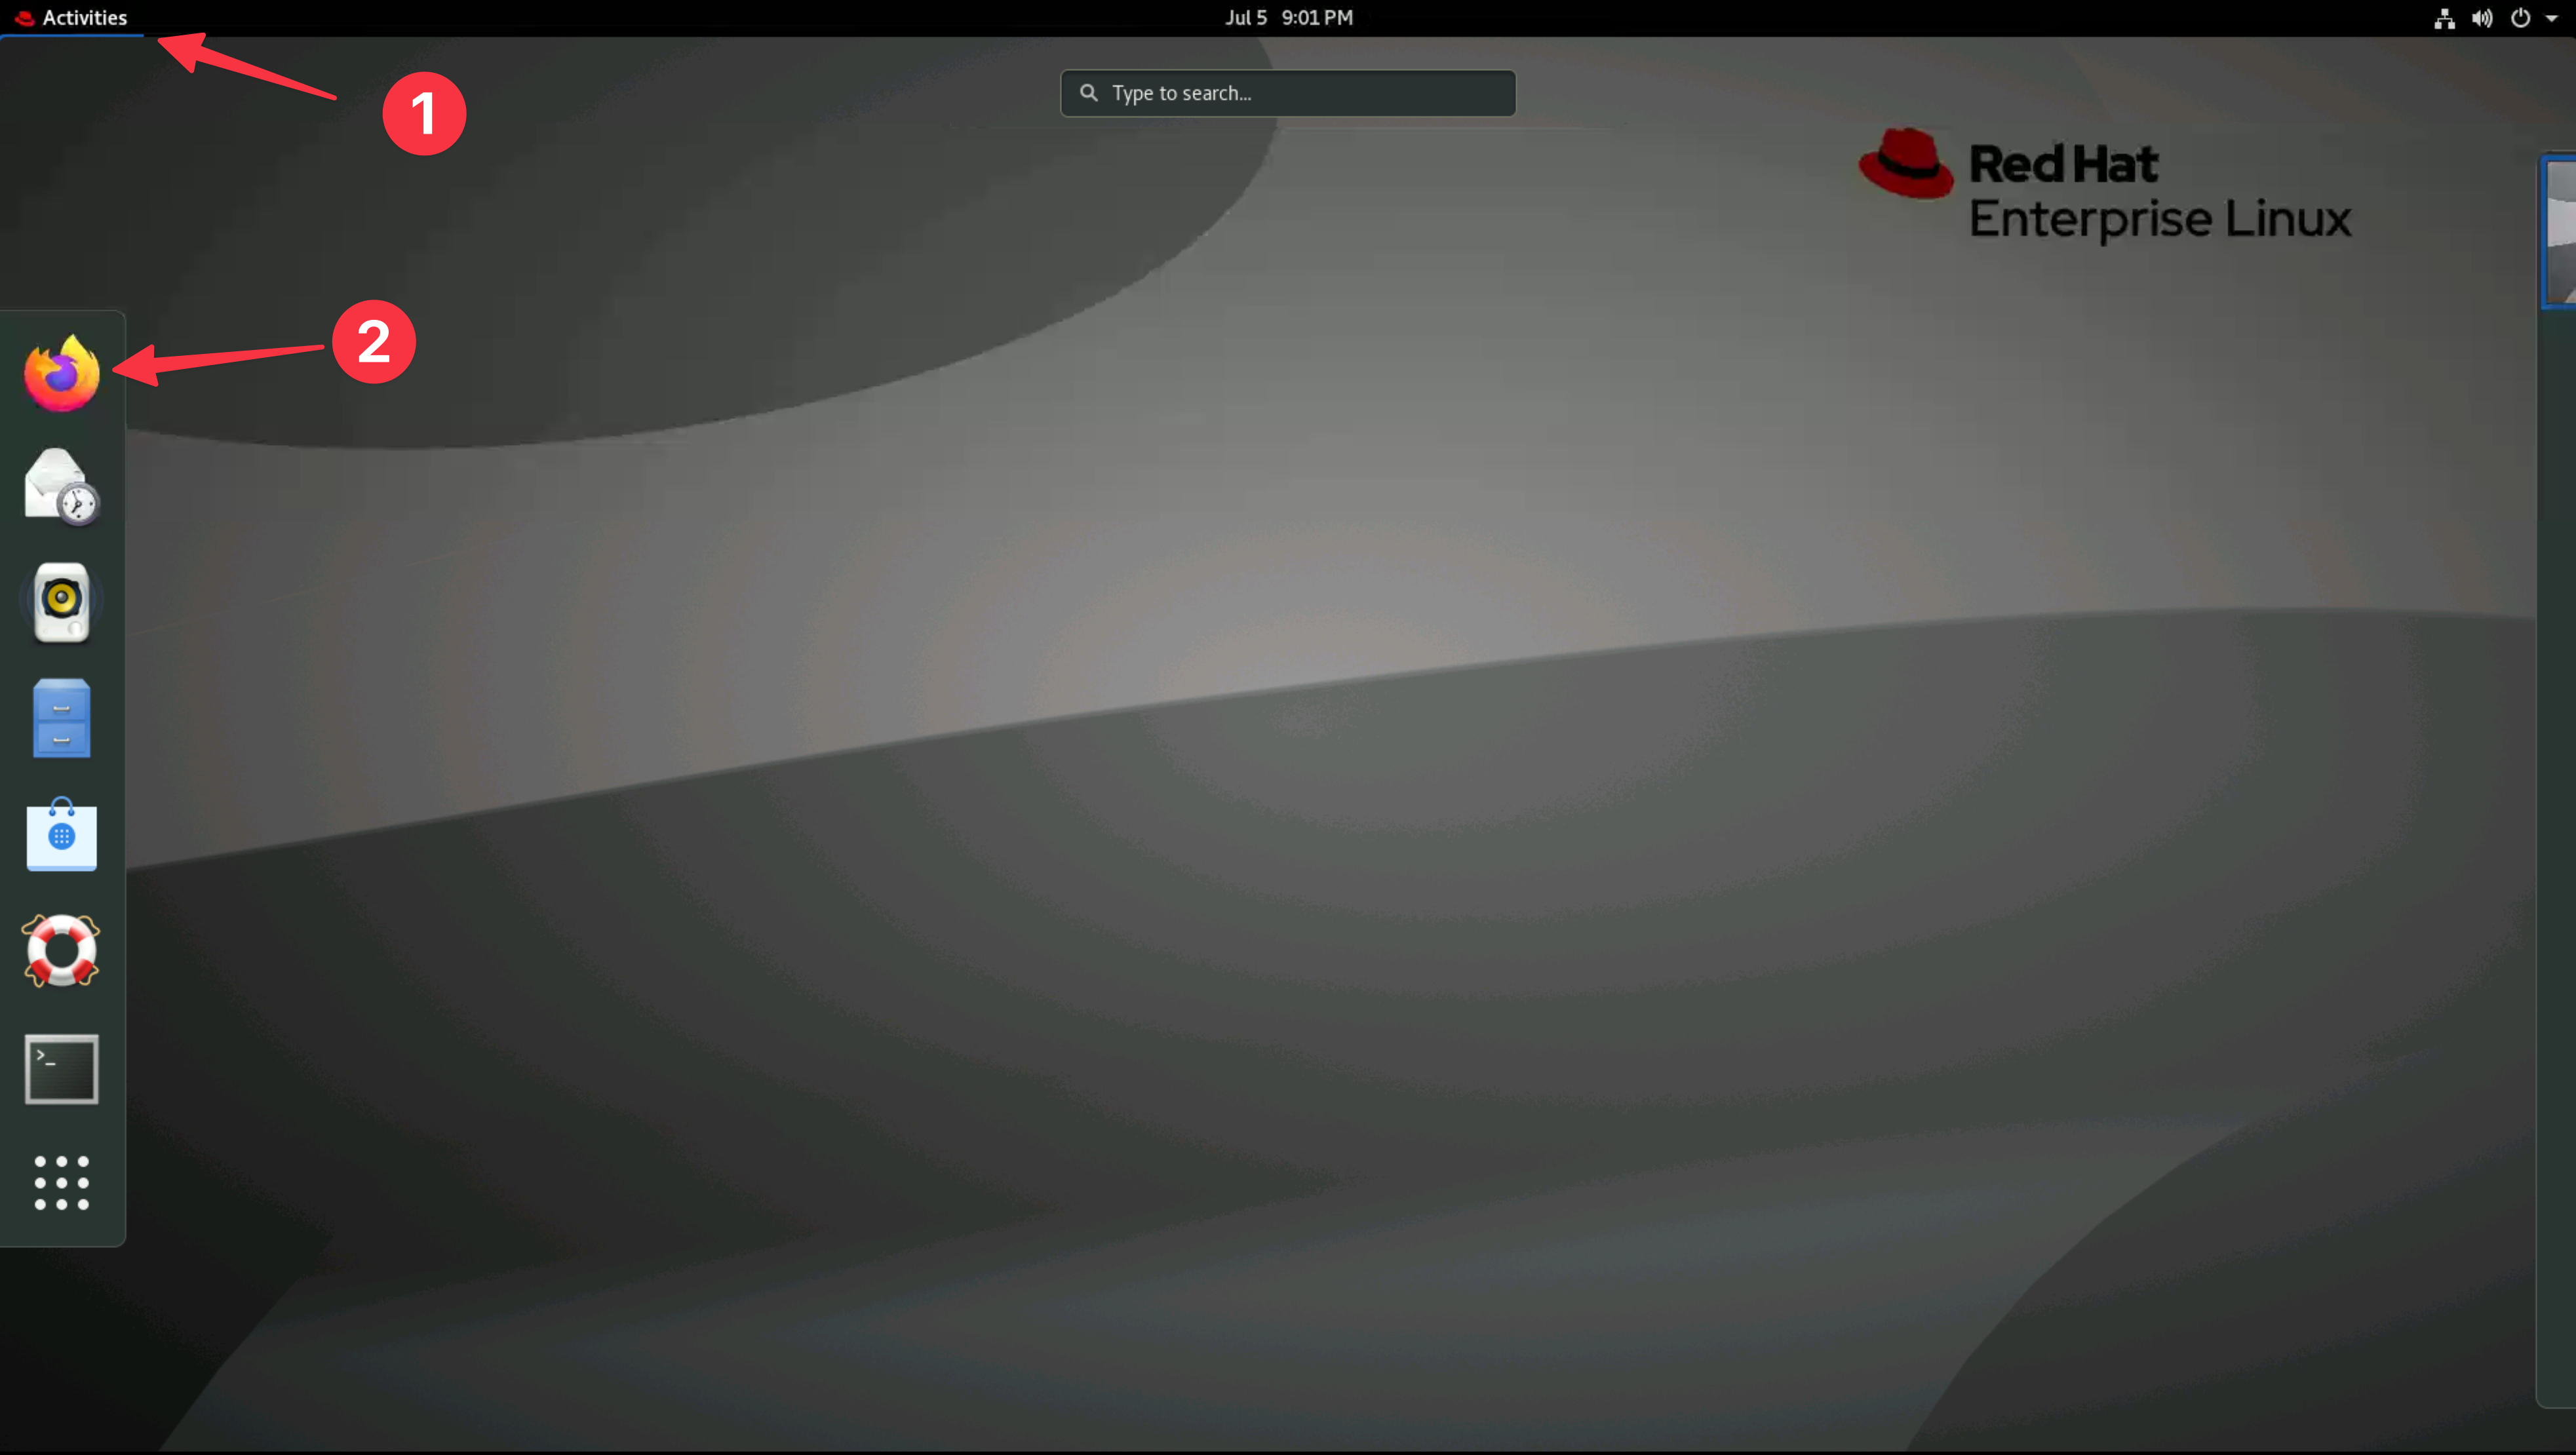
From the Bastion host open the Firefox browser and select the Instana bookmark.
If you are unsure how to get access to the Bastion host (Guacamole) see Accessing a Lab Environment
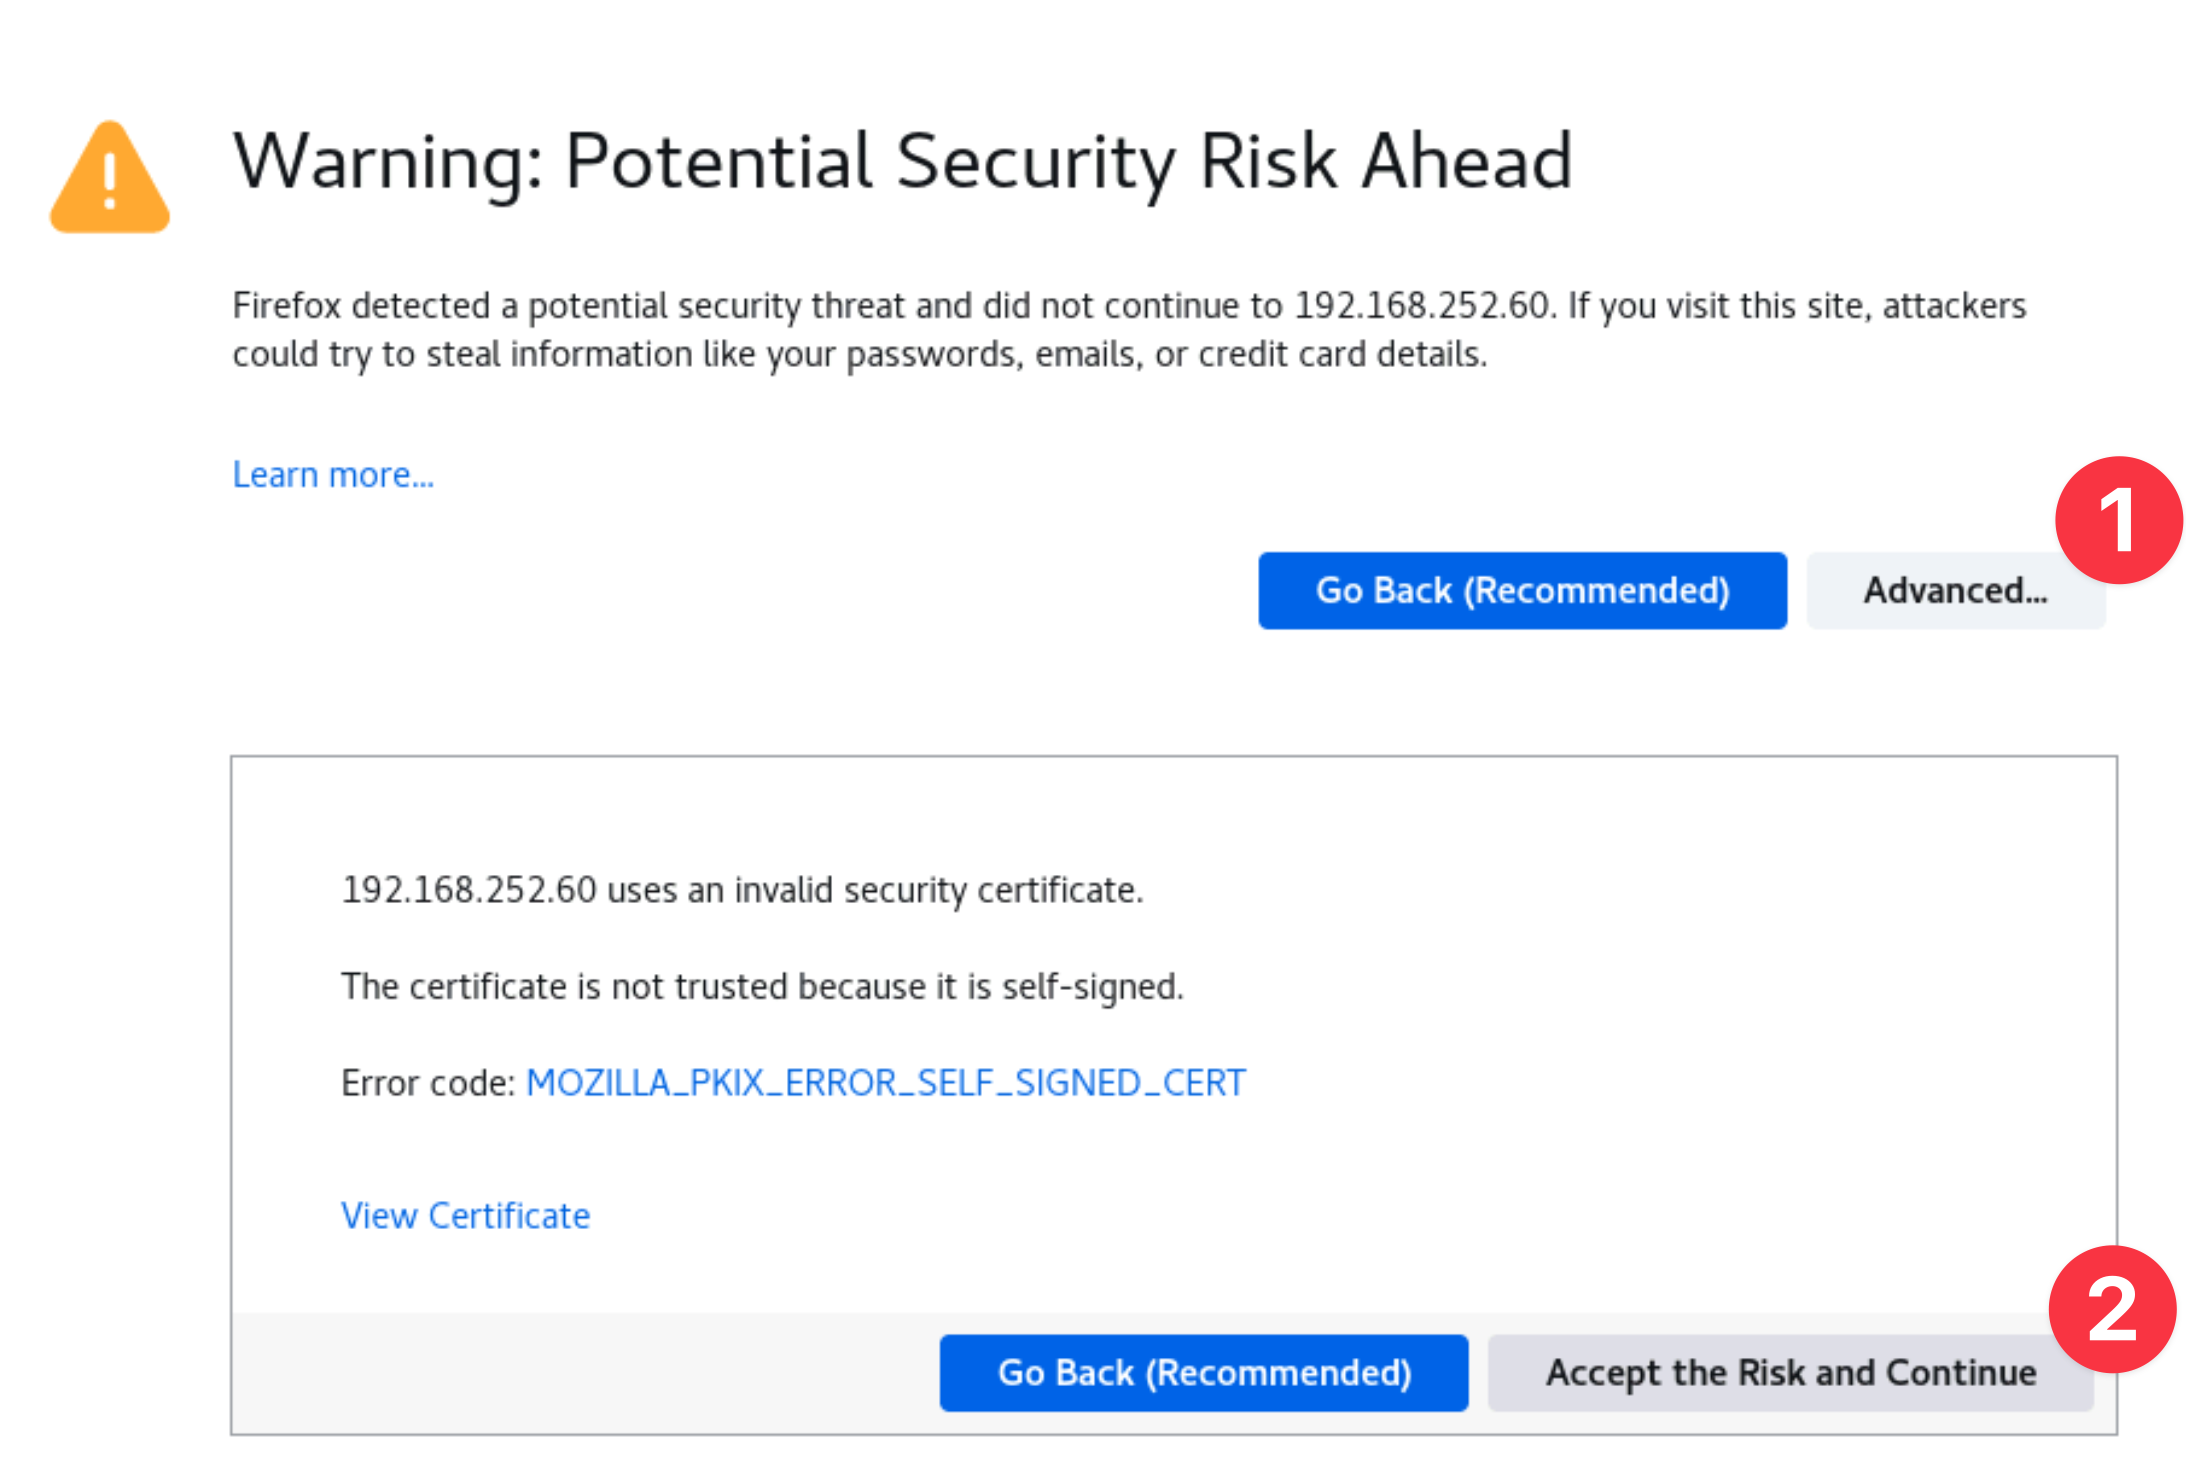
You can safely ignore the warning about the certificate being untrusted.
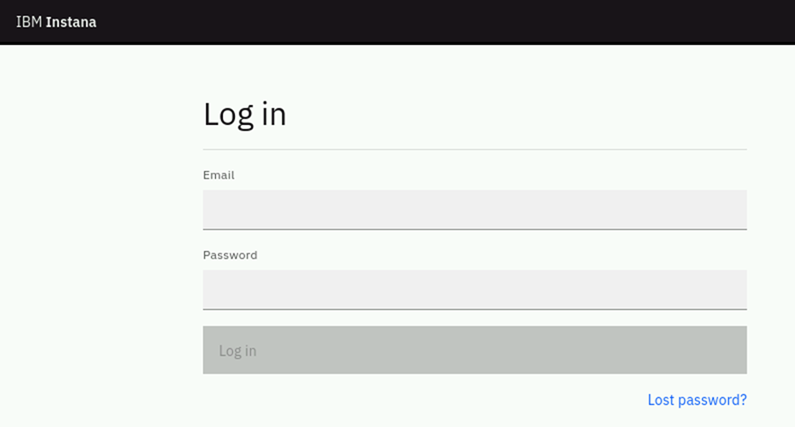
When prompted, enter the username and password that you updated earlier.
- Email: admin@instana.local
- Password: Passw0rd
3.1: Explore Kubernetes
Use the left navigation to select Platforms and then Kubernetes
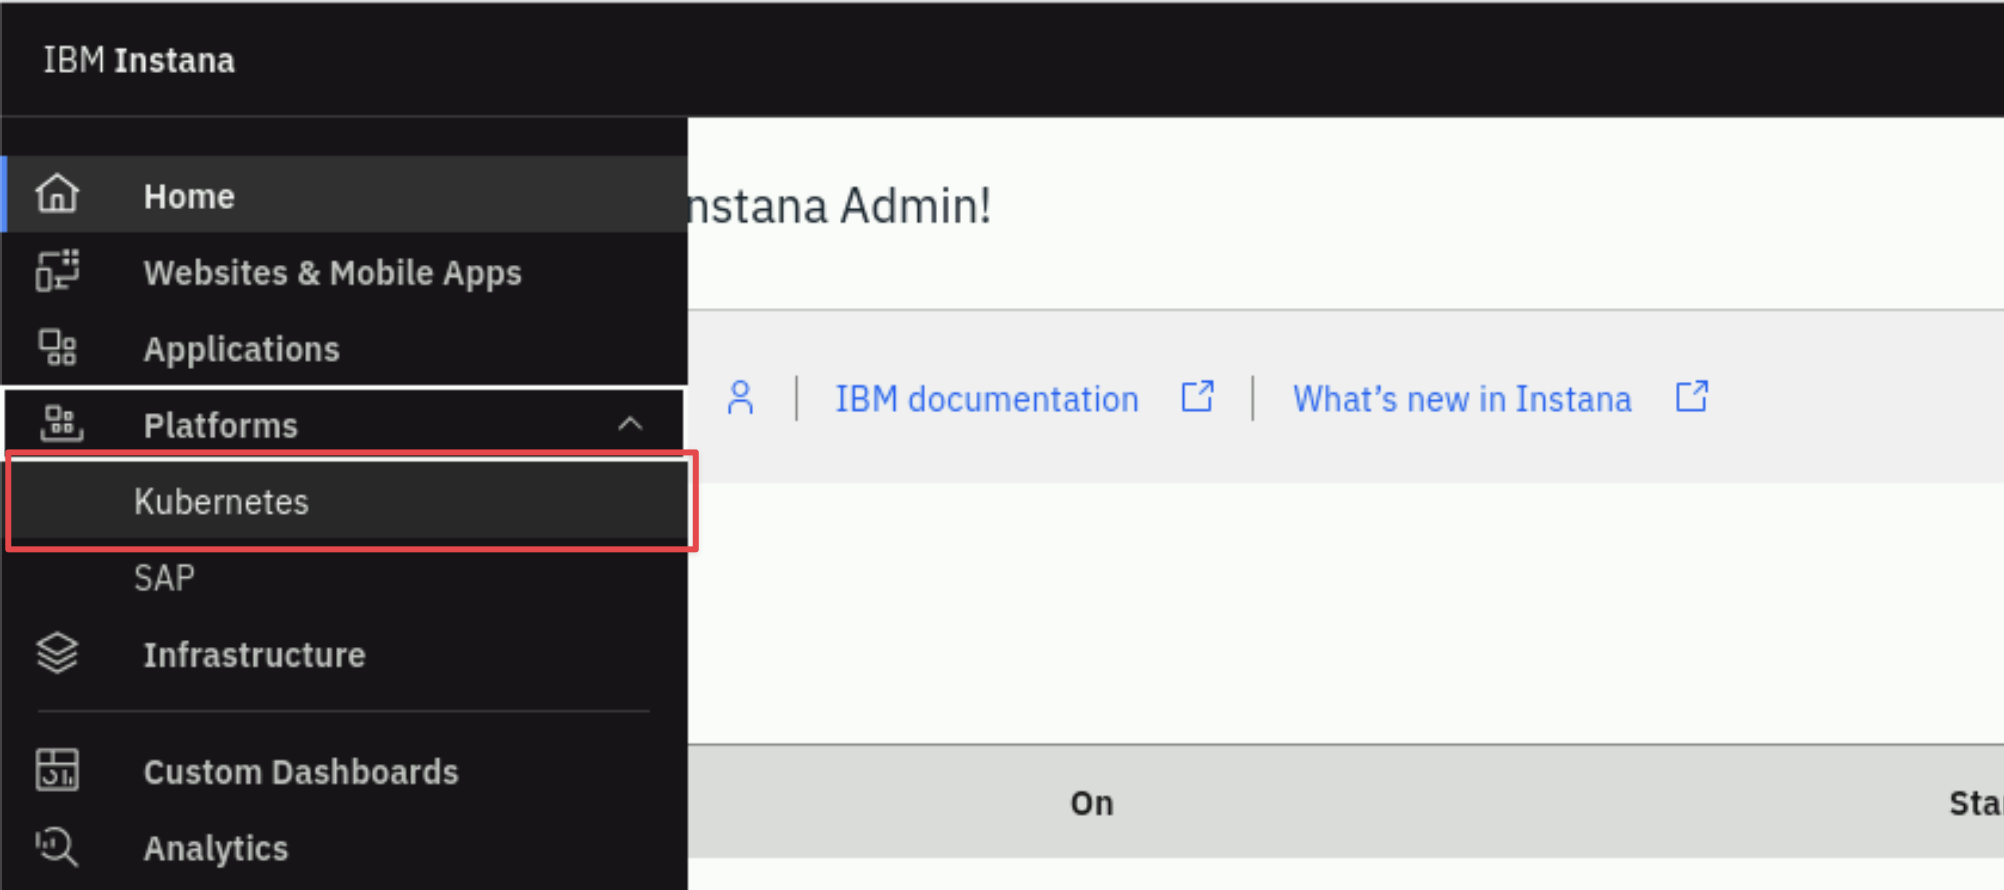
When you select Platforms in the classroom environment, you will only see kubernetes and SAP. But, there are additional feature flags that can be enabled to add in other technologies like VMware, Cloud Foundry, Power HMC, and Z HMC.
You will see a list of Kubernetes clusters. In this environment there is the cluster Instana is running on and the K3s cluster named demo-apps where QOTD, Robot Shop and the Instana Agent have been installed.

Click the demo-apps cluster name to open the dashboard.
You should see a screen similar to the one below where you can see overall utilization of the Kubernetes cluster.
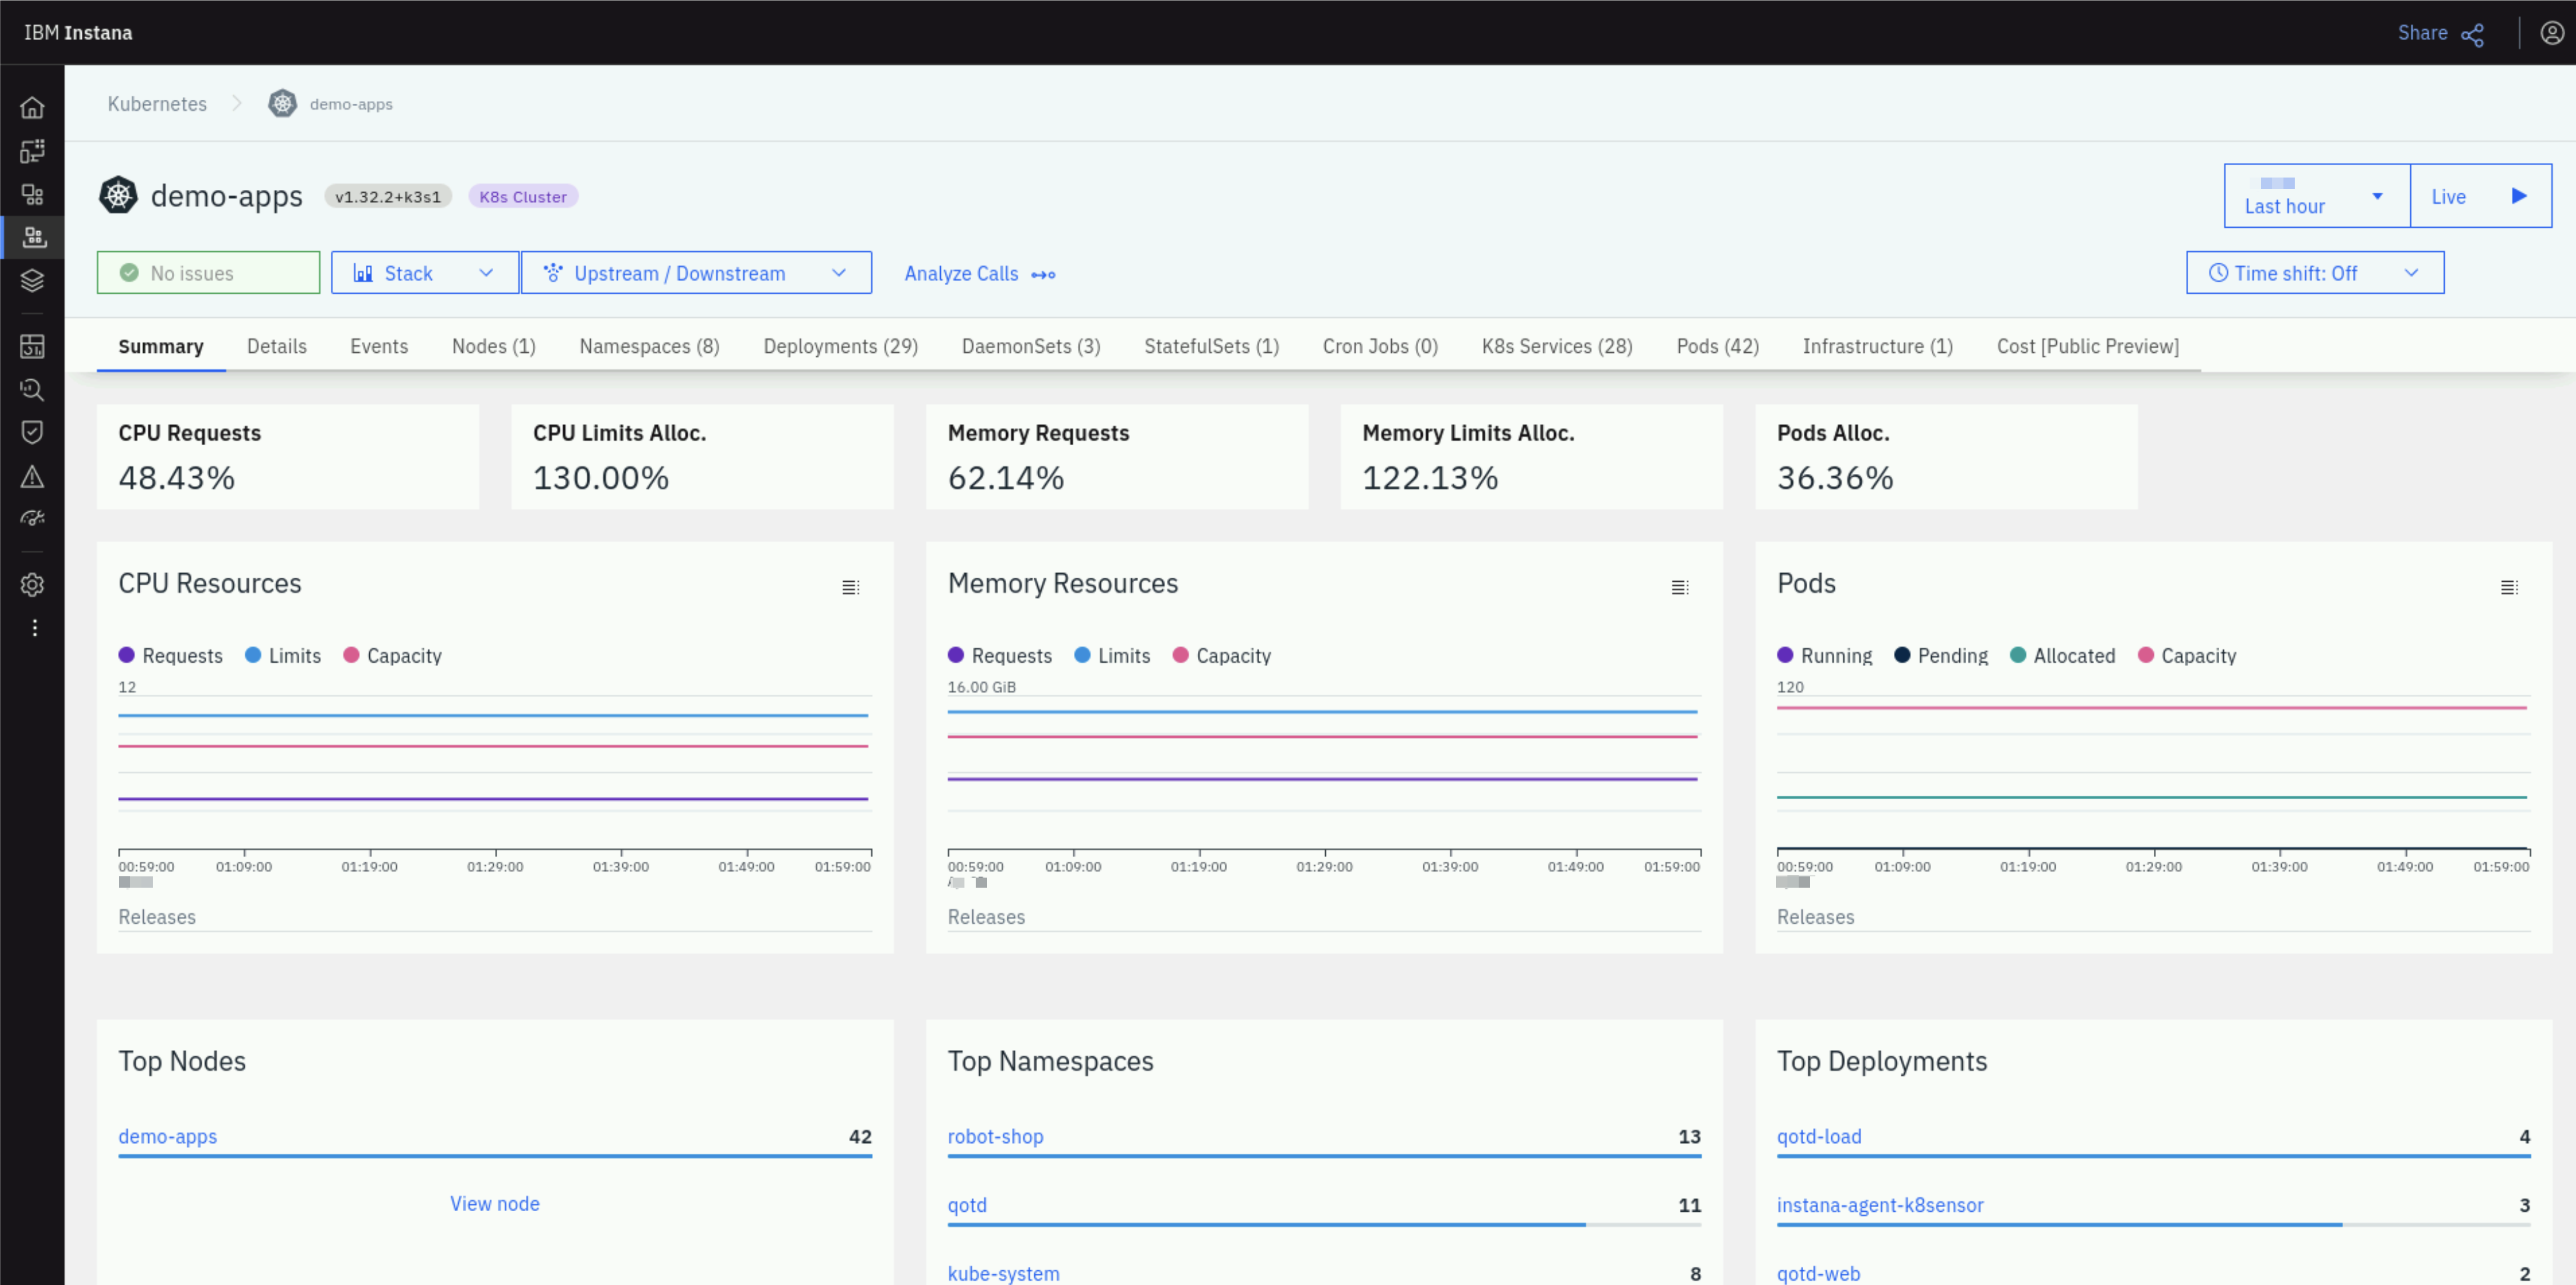
Select some of the other tabs to explore the Kubernetes monitoring. We recommend you look at the Events, Nodes, and Pods tabs. When you select the pods tab, you will see a list of all pods running within the cluster.
In the upper right corner of the Pods tab, you can filter by the current pod phase. You'll notice that it will filter the list pods by the phase selected.
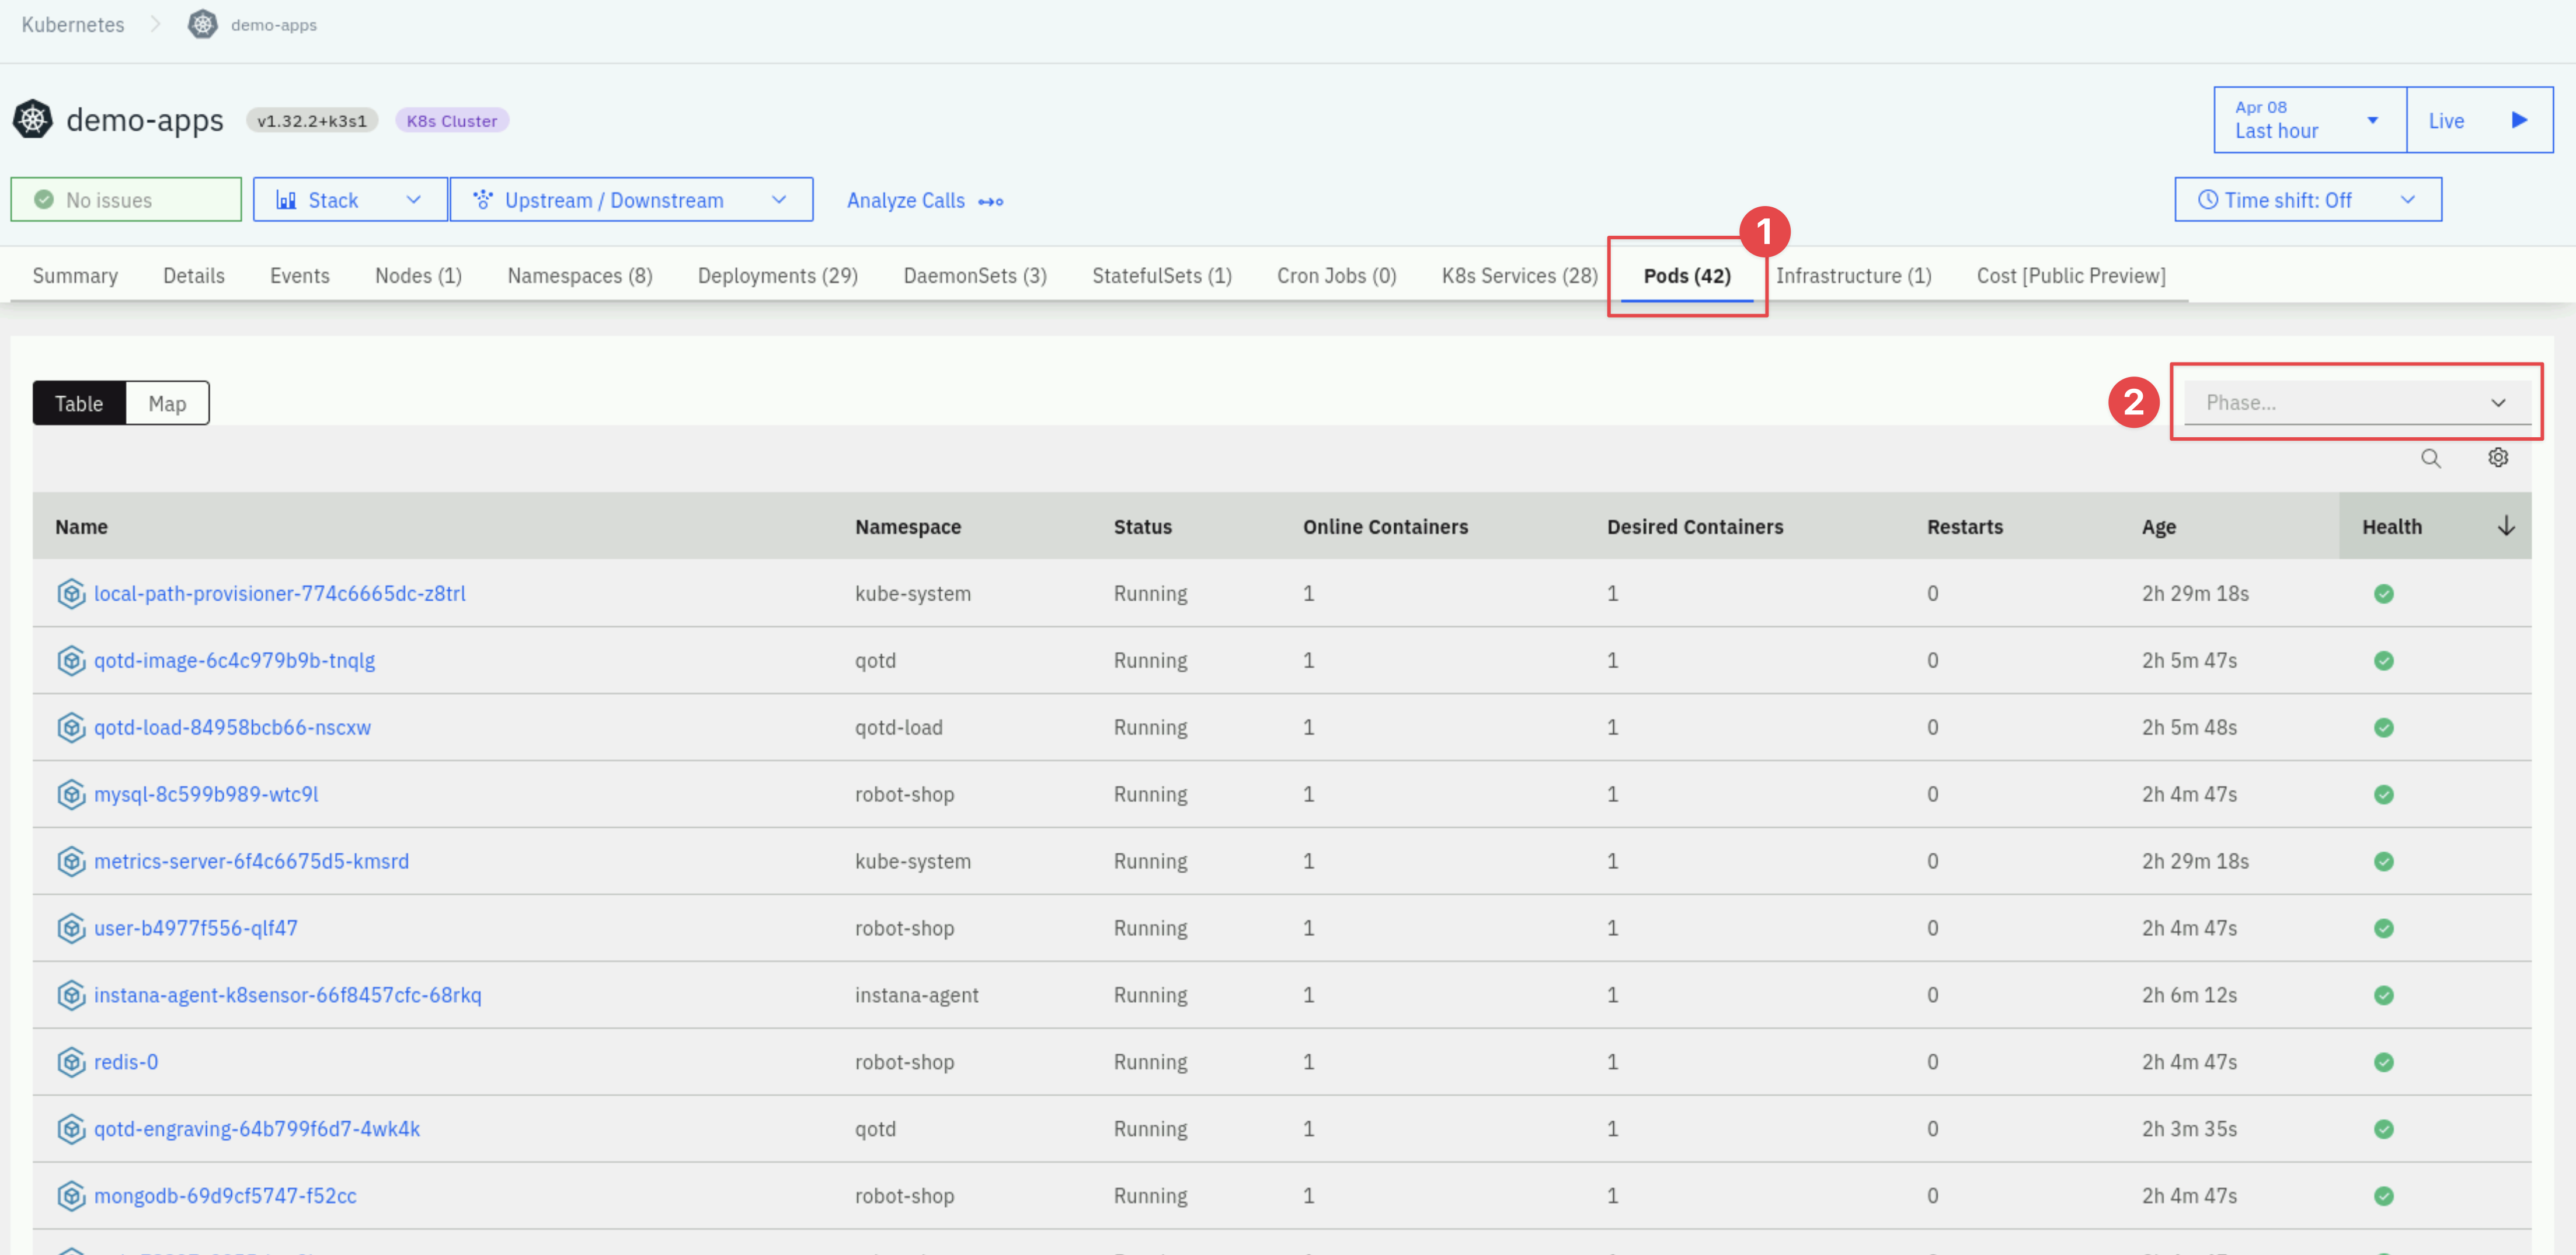
Click on one of the pod names to the left to drill into the pod utilization details.
3.2: Explore the Infrastructure View
Next, explore the Infrastructure view. To do this, click on the Infrastructure menu item on the left navigation.
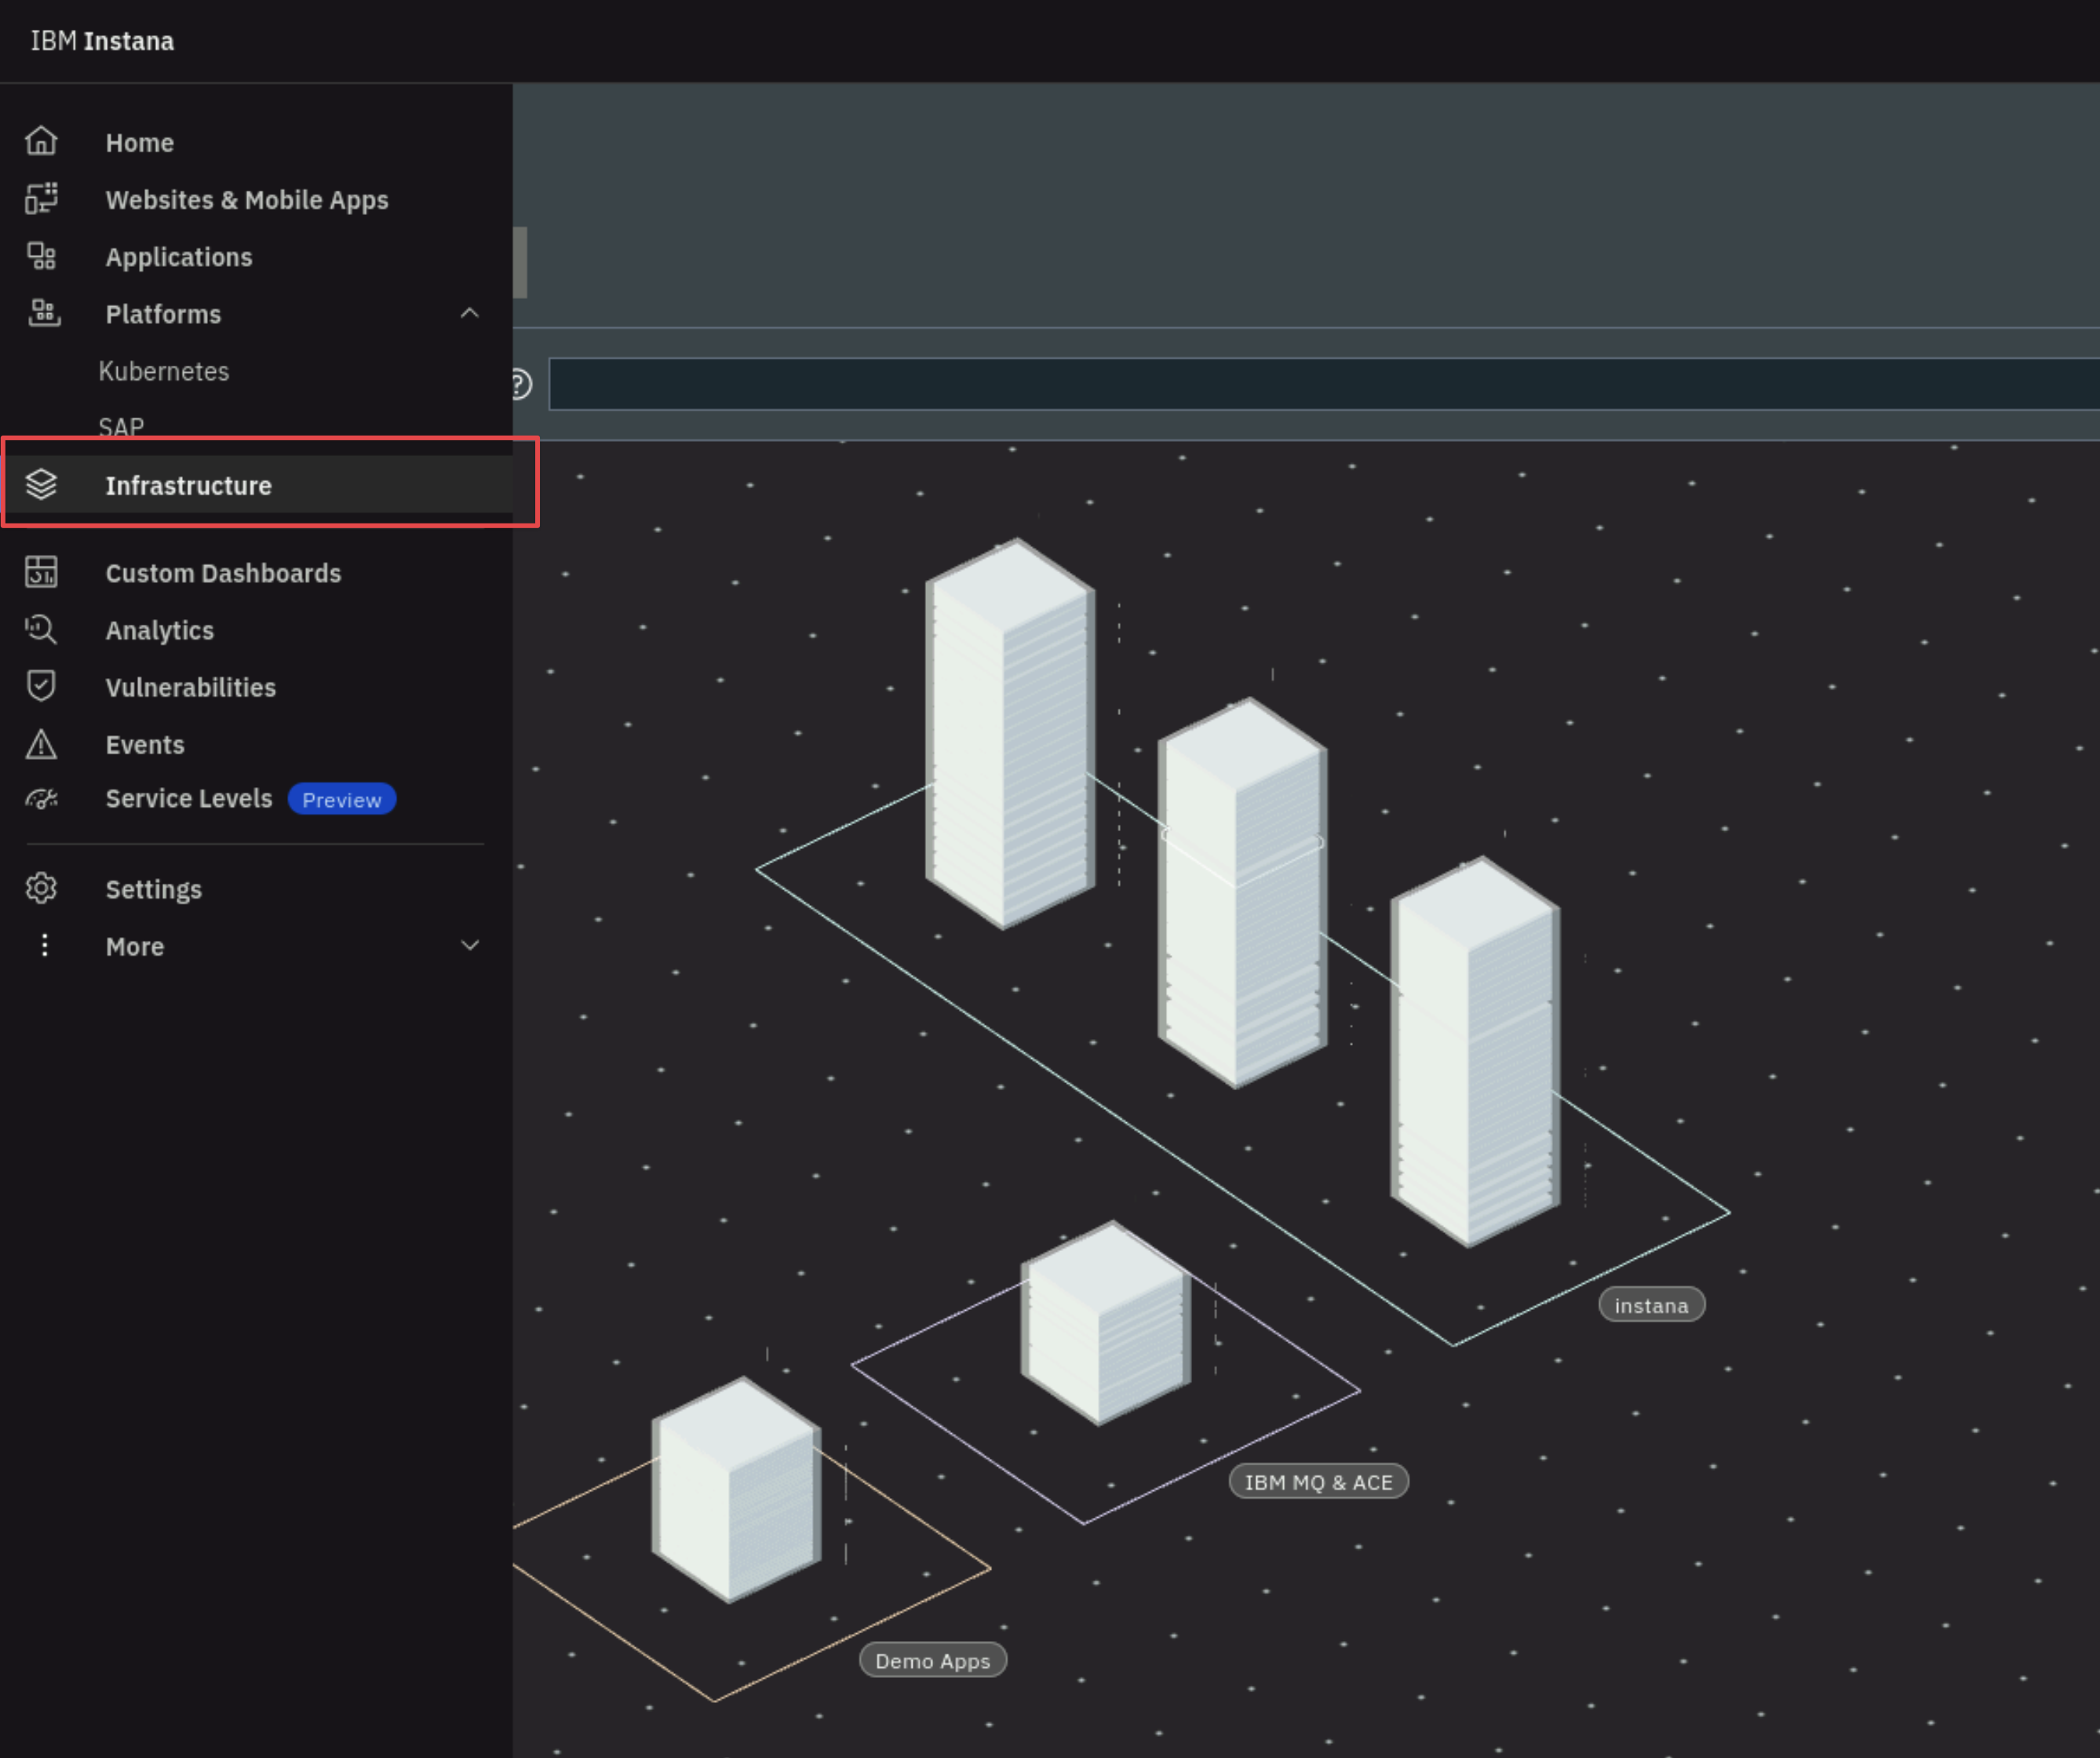
You'll notice that there is a box surrounding the towers with the zone names that have been configured in the Agent configurations. The box is a zone. In previous labs a zone name was specified during the install of the Instana Agent or added to the Instana Agent configuration file. The towers contained within the zones represents the Demo Apps Kubernetes cluster, the Instana server, and the virtual machine running ACE and MQ.
If a zone name was not defined after installing an Agent the host would show up in the 'Undefined Zone'.
In a large environment, it can be difficult to find the server or zone that you are looking for. Fortunately, there are a number of ways that you can search for things within the Infrastructure view.
In the bottom right corner, click on some of the icons and explore different ways of organizing and filtering the Infrastructure view.
Or, you can use the lucene query language in the filter/search bar at the top of the page. Before beginning the search, flyover one of the towers and identify the hostname of one of the servers. For example mqace
- Click in the filter bar and select Entity
- A list will popup. Start typing host and you will see the list filtered to "host". Once you see the single entry, select host.
- Once you have selected "Host", another list will popup. Select name.
- Now, you will see "entity.host.name:". After the ":", you can do a wildcard search. For example "entity.host.name:*abc*". Type in a wildcard string that matches the beginning of the hostname you found earlier. In my example, I could specify "entity.host.name:*mqace*" to filter on the MQ/ACE server.
Once you have specified the filter, you'll see that the infrastructure view is filtered to just a single server that matches your search.
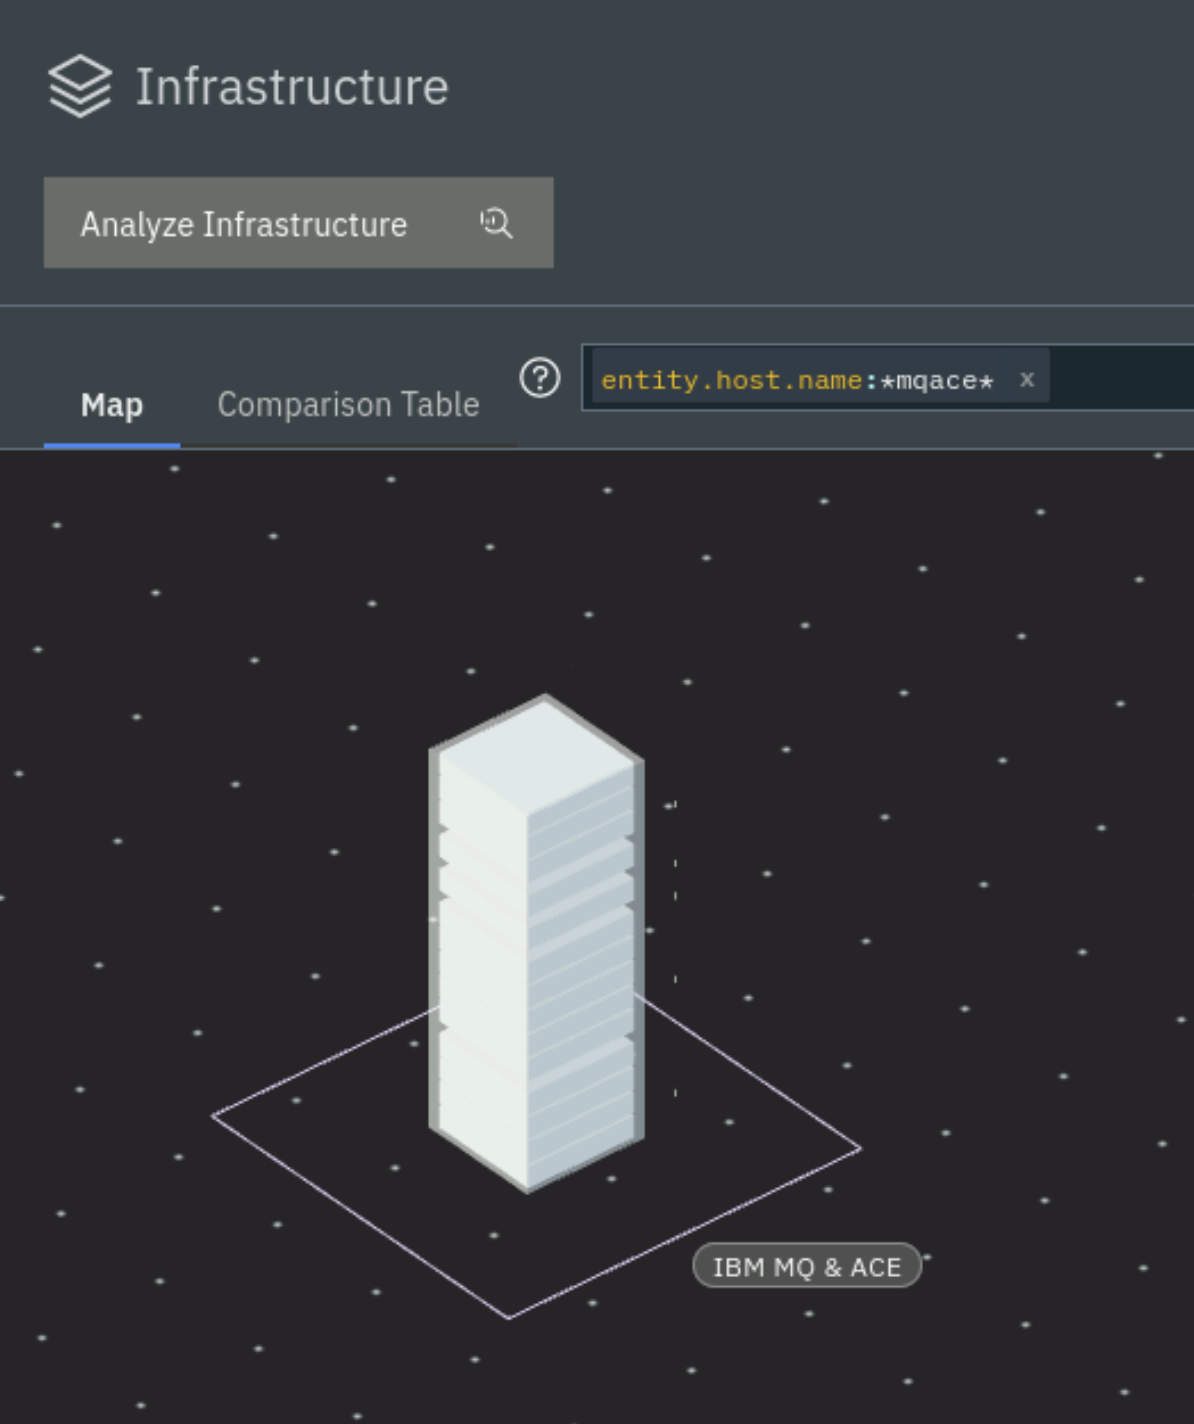
There are many other types of queries that can be executed using the filter/search bar. For example, you can specify AND, OR, and NOT conditions. You can find detailed information on the lucene query language in the product documentation found here: lucene query language
Clear the filter at the top of the page by clicking on the X
Next, flyover one of the three towers that represents the Instana server. These towers are taller than the others because there are more discovered entities running on it.

You'll notice that a number of components were automatically discovered and are instrumented for monitoring.
Next, flyover the MQ & ACE tower.

This is the MQ and ACE server. You can see the MQ and ACE components along with a discovered JVM, and more.
Next, click on the Comparison Table near the top of the page.

This table shows a sortable and searchable list of the Hosts that make up this environment. You can quickly find hosts consuming high CPU, high memory, or have poor health.
In addition, if you select where is says Hosts, there is a dropdown list that allows you to see lists of JVMs, containers, etc.
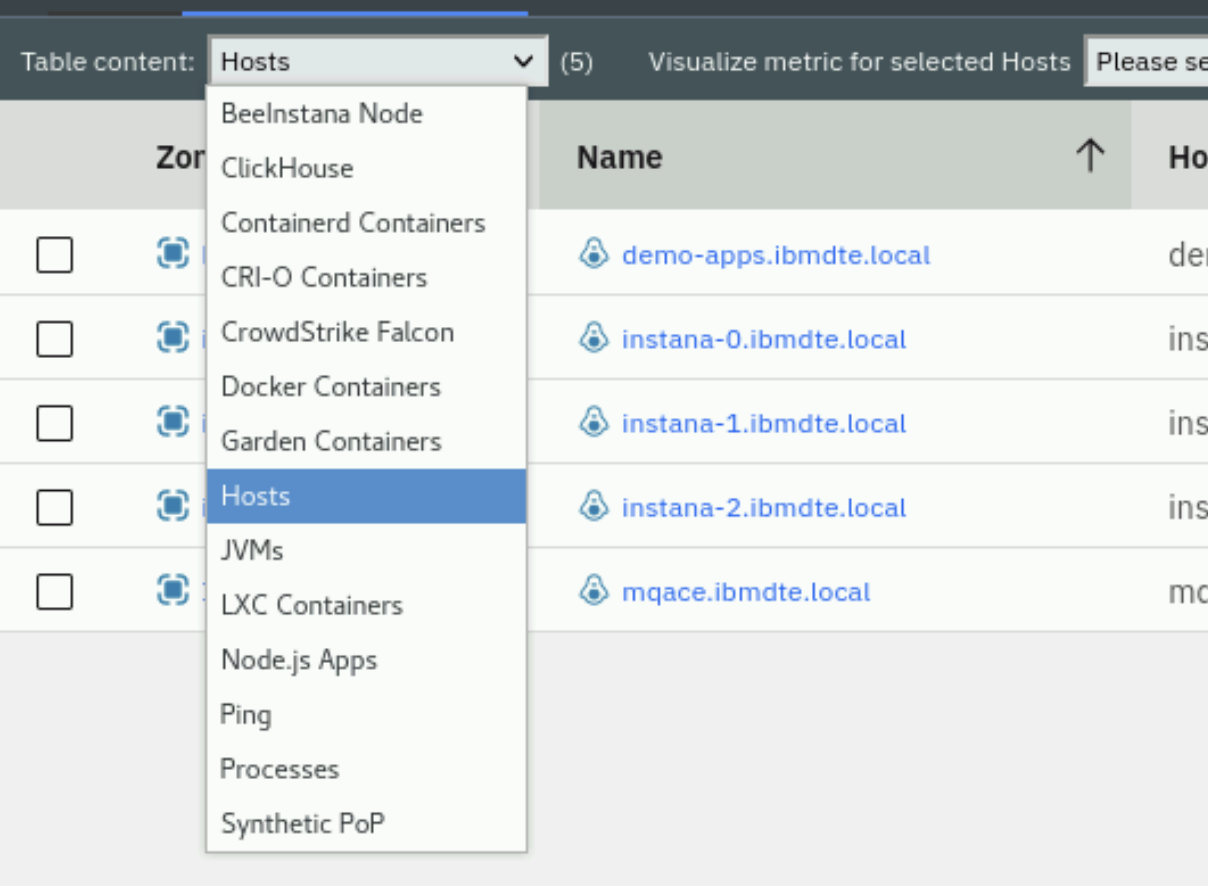
Change from Hosts to Containerd Containers in the dropdown list and you'll see a complete list of containers and their utilization and health.
Switch back to the Map view by clicking on Map to the left of Comparison Table.
Zoom in with the plus sign in the bottom right corner.

You'll notice that each tower is actually comprised of multiple pizza boxes. Each one represents an Entity such as an MQ Queue Manager or an ACE Integration Node.
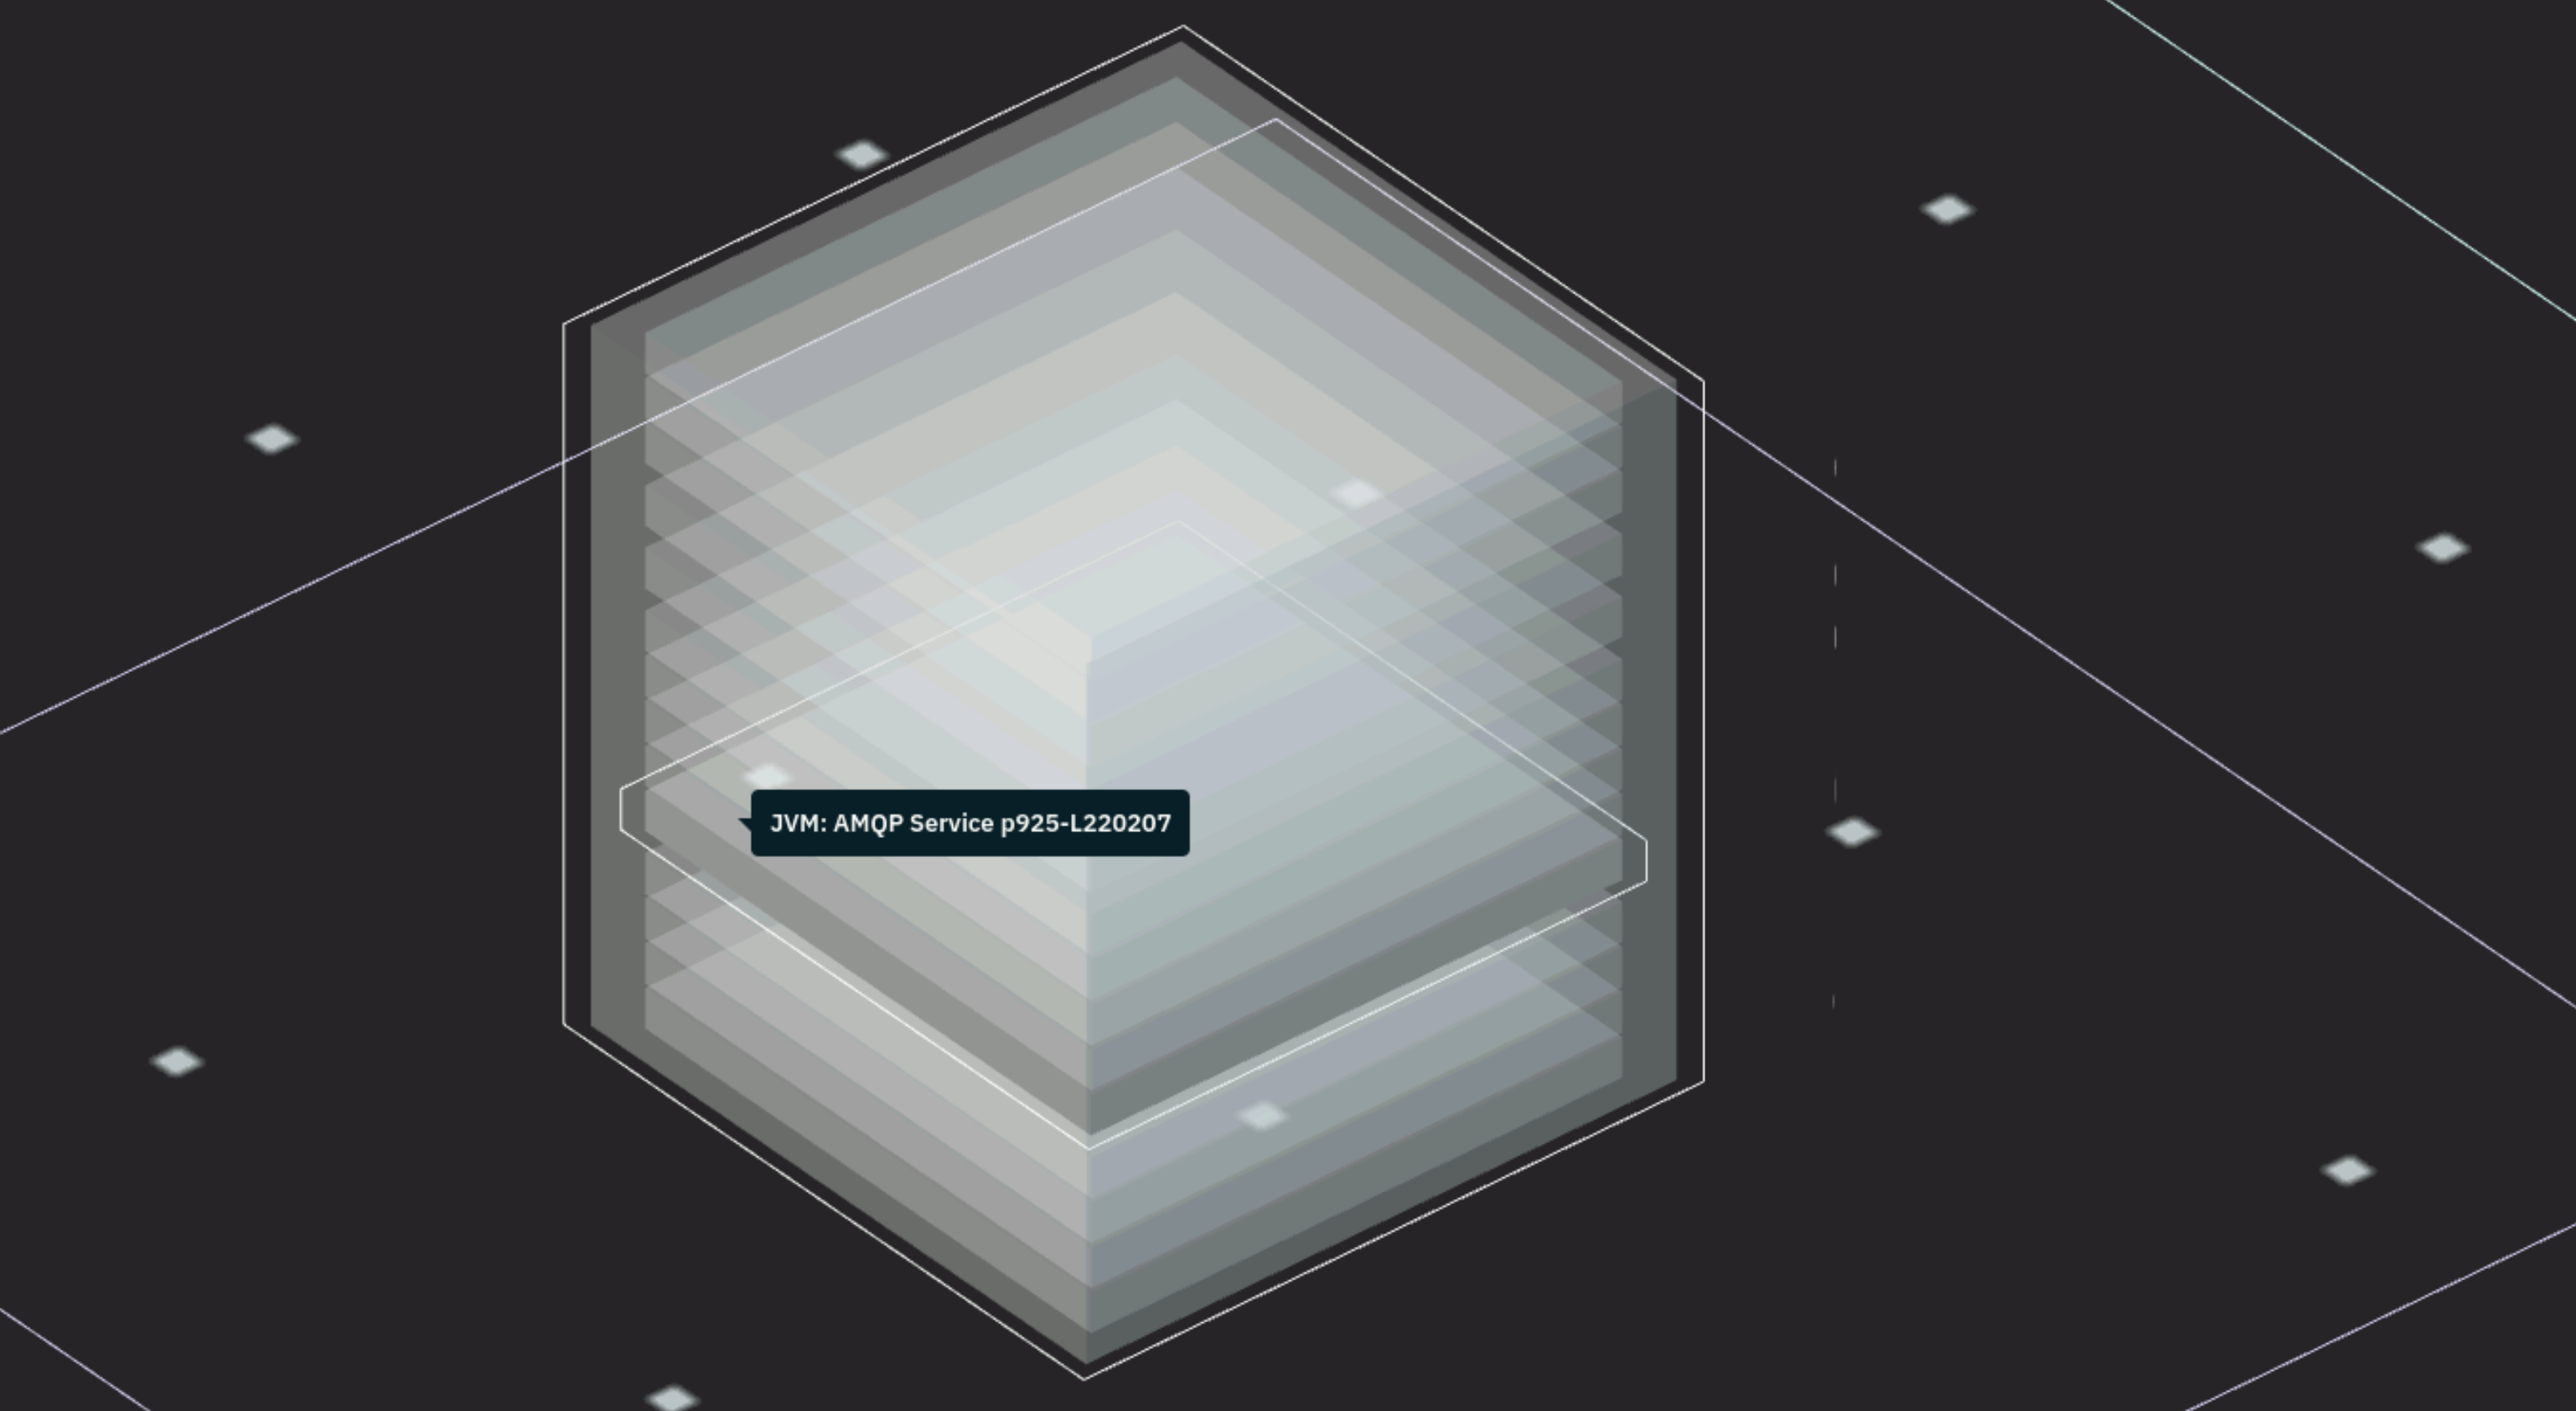
Flyover the MQ & ACE server again until you see a list of all discovered Entities. If you only see 1 entity, move your mouse to one of the corners of the tower. Once you see all of the entities, click your mouse. You'll see a dialog open
Use the scroll bar to scroll down. You'll notice that you see each of the types of Entities that were discovered. Expand the MQ entity type and you'll see the Queue Manager that was discovered.
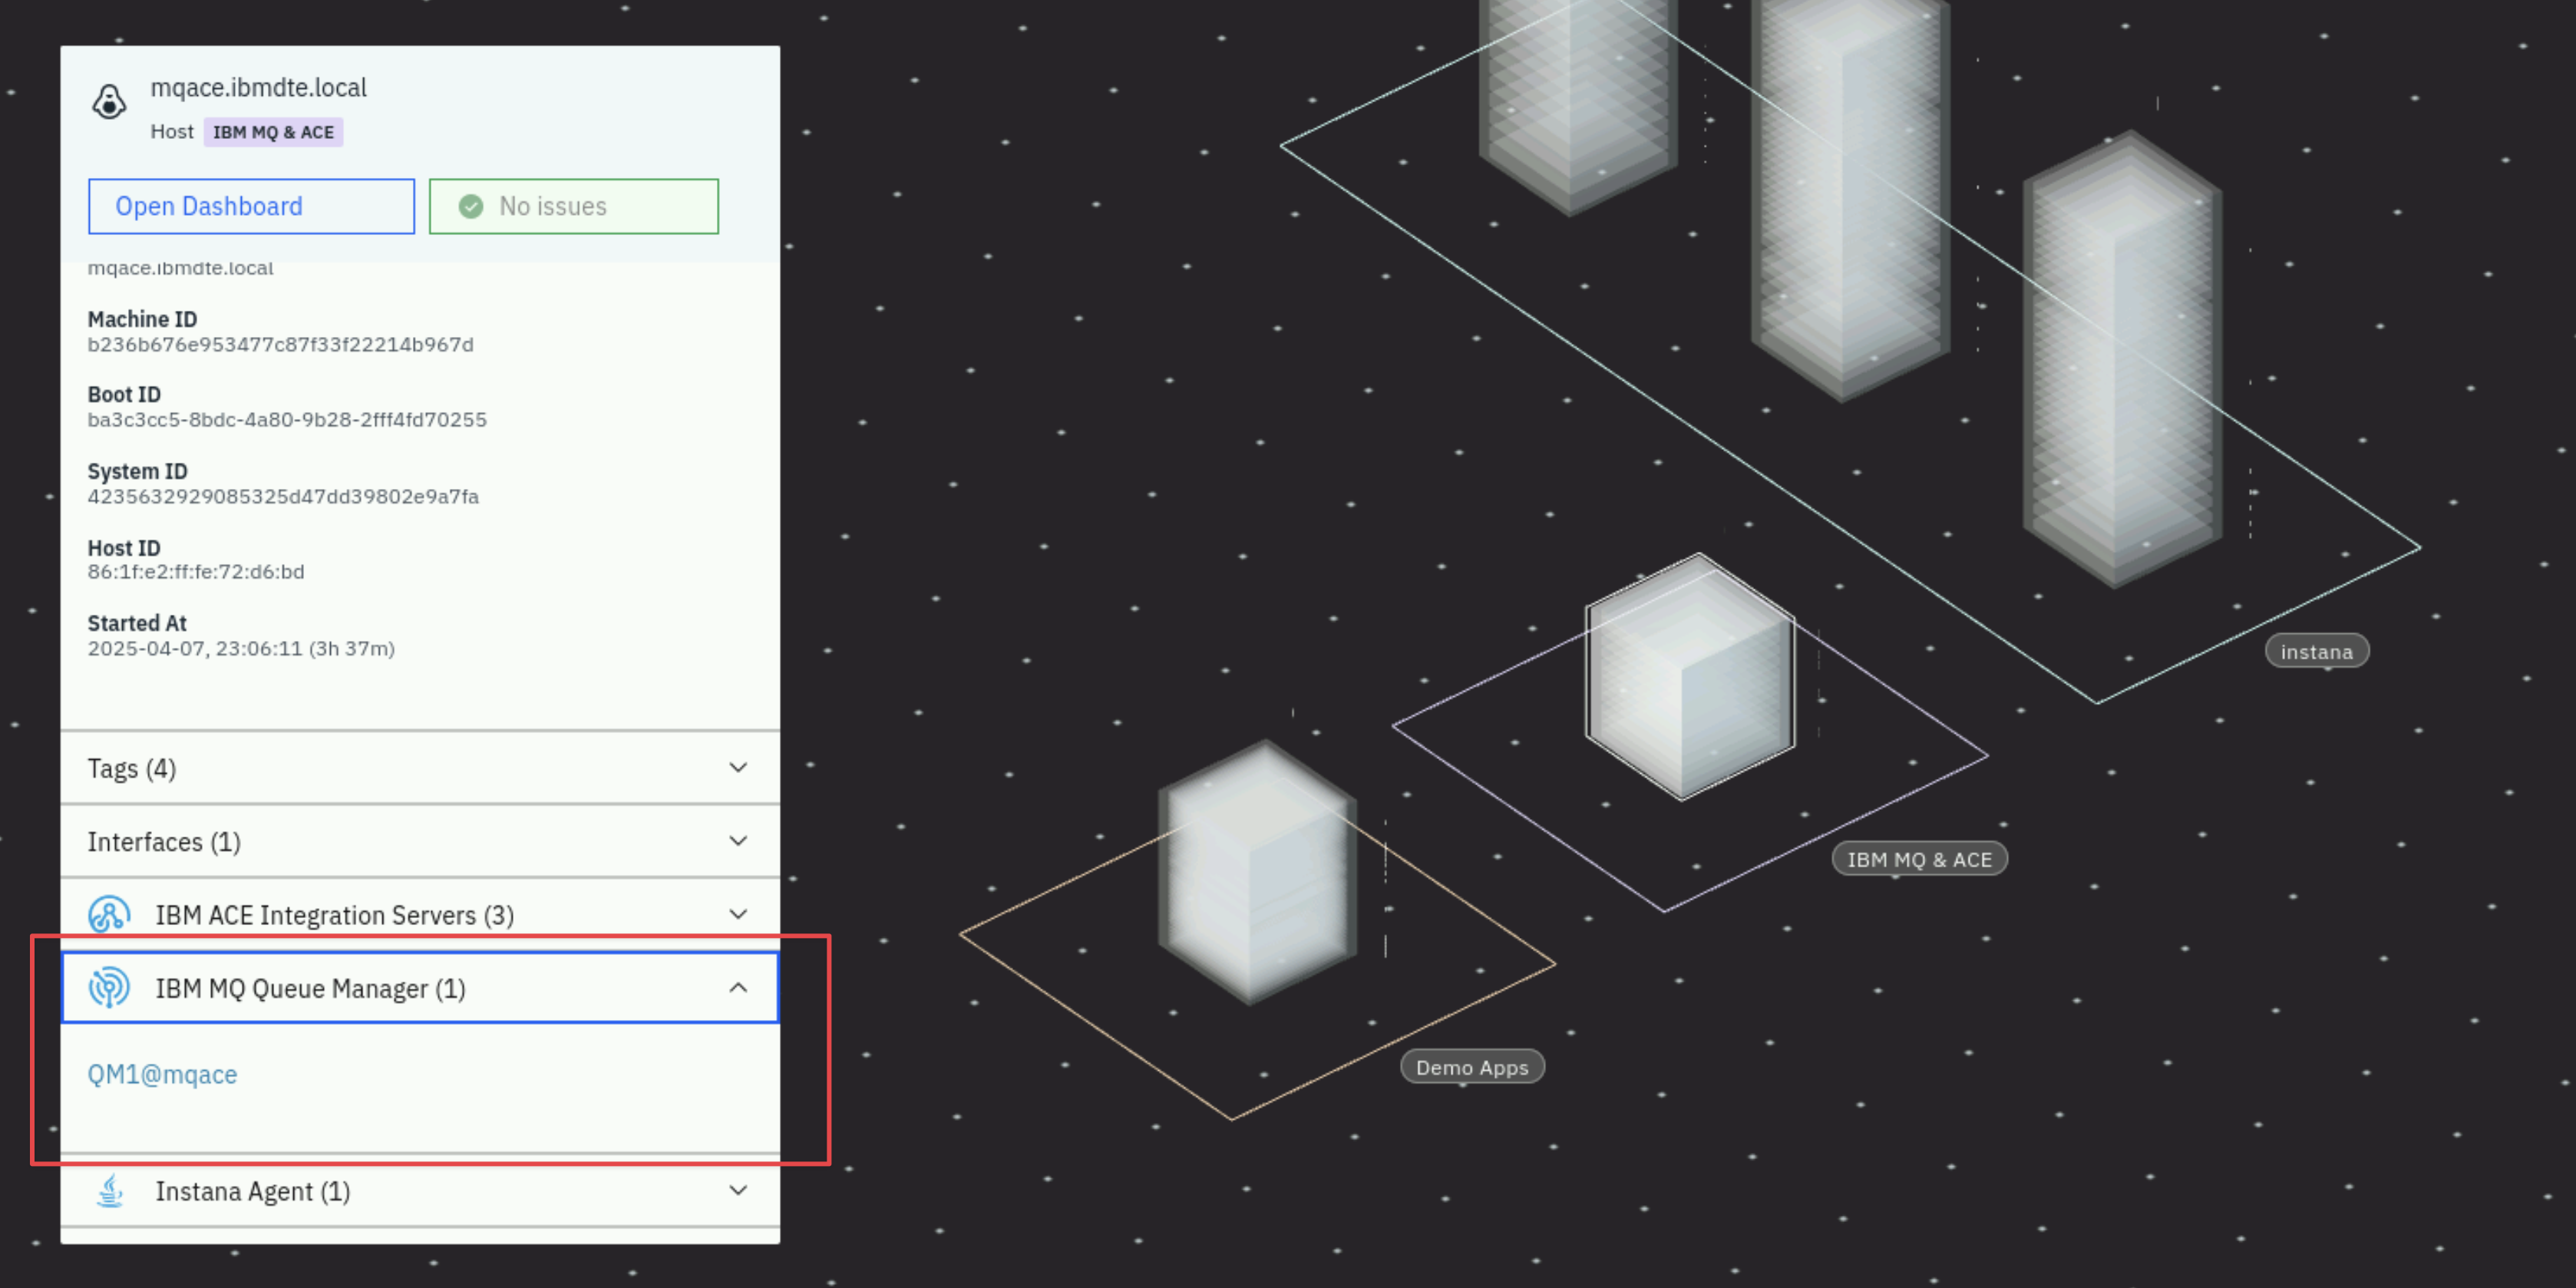
It is possible to click on either the "Open Dashboard" button or the links for the individual entities.
Click on the Open Dashboard button and we'll examine the Host Agent dashboard.
After you click on the button you'll see a screen that looks like this:
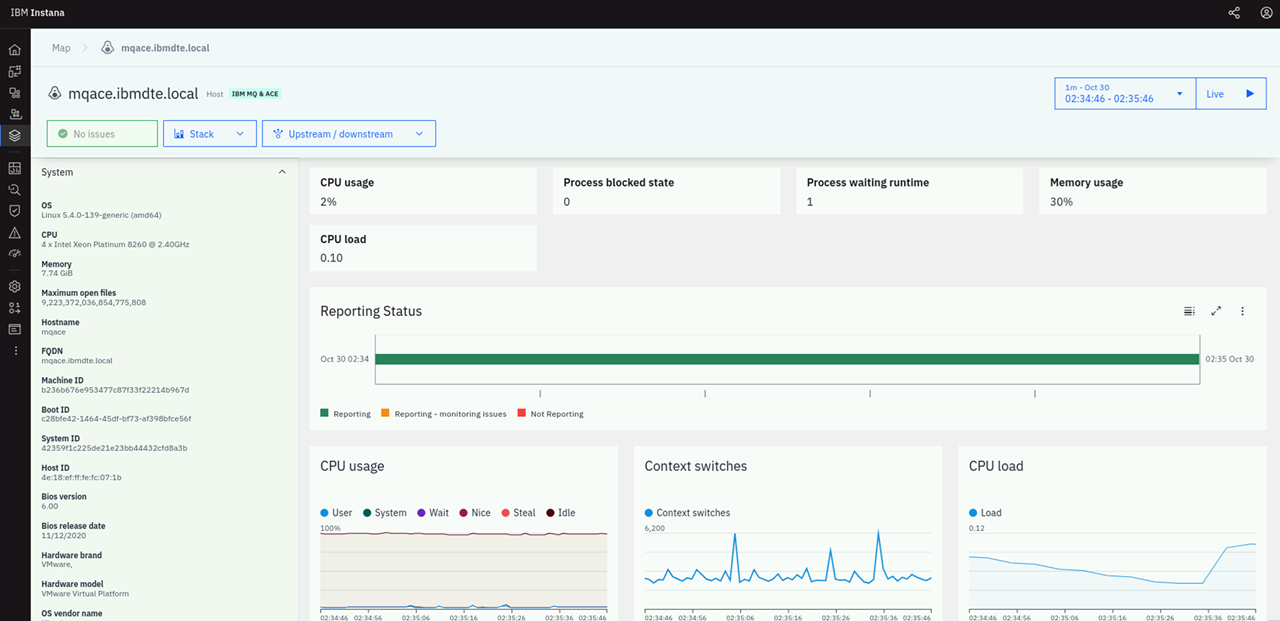
You can see fine grained metric data for the Host operating system. Most metrics are gathered at 1 second granularity. This can be very valuable in diagnosing problems. To see the 1 second metric data, let's shorten the time interval on the screen. Click on the time range dropdown in the upper right corner and select last minute. This will filter the data to the last minute of metric data.
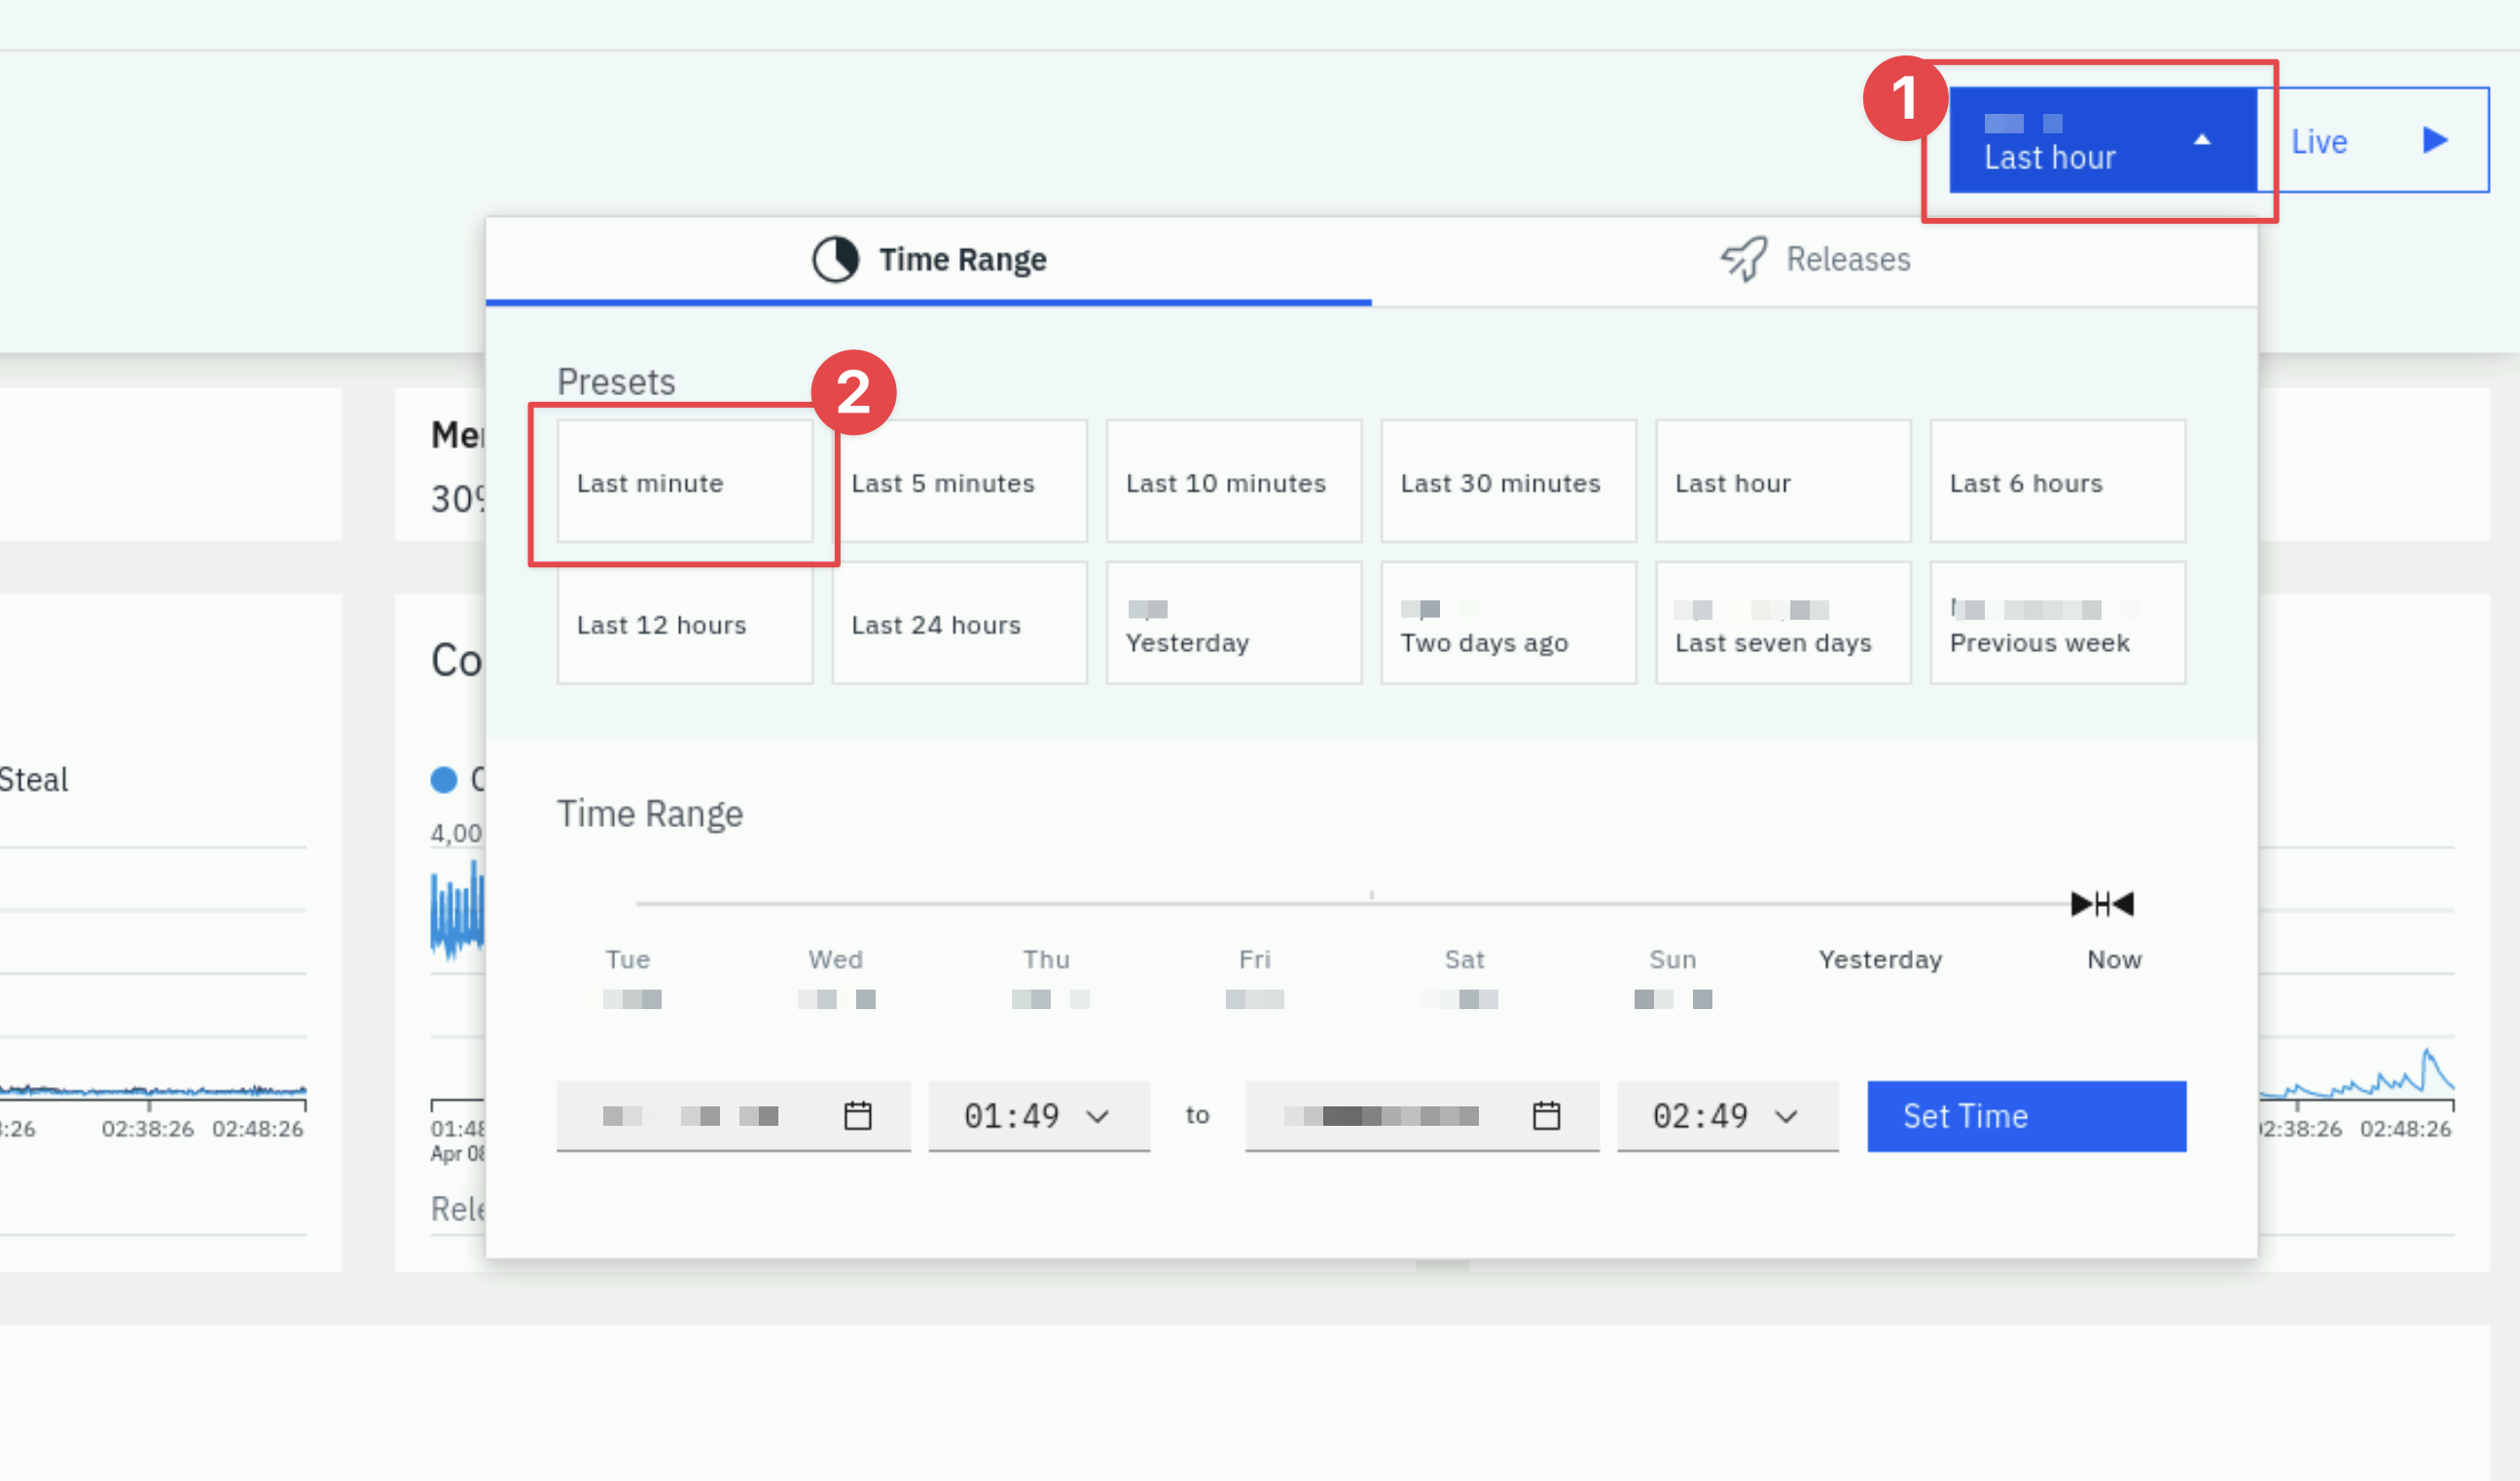
Now, click the Live button in the upper right corner. This will show you Live data as it is streaming into the Instana server in near-realtime.
After examining the data, click the time range dropdown and select Last Hour to look at a more typical view within Instana.
Scroll down and explore the other metrics on the page.
As you scroll down the page, you'll notice a section on the left side of the screen that contains a list of Entity types that were discovered. This is the same list that you saw earlier on the Infrastructure view. By placing these links in context and leveraging the relationships that are discovered by Instana, it makes it easier to diagnose problems.
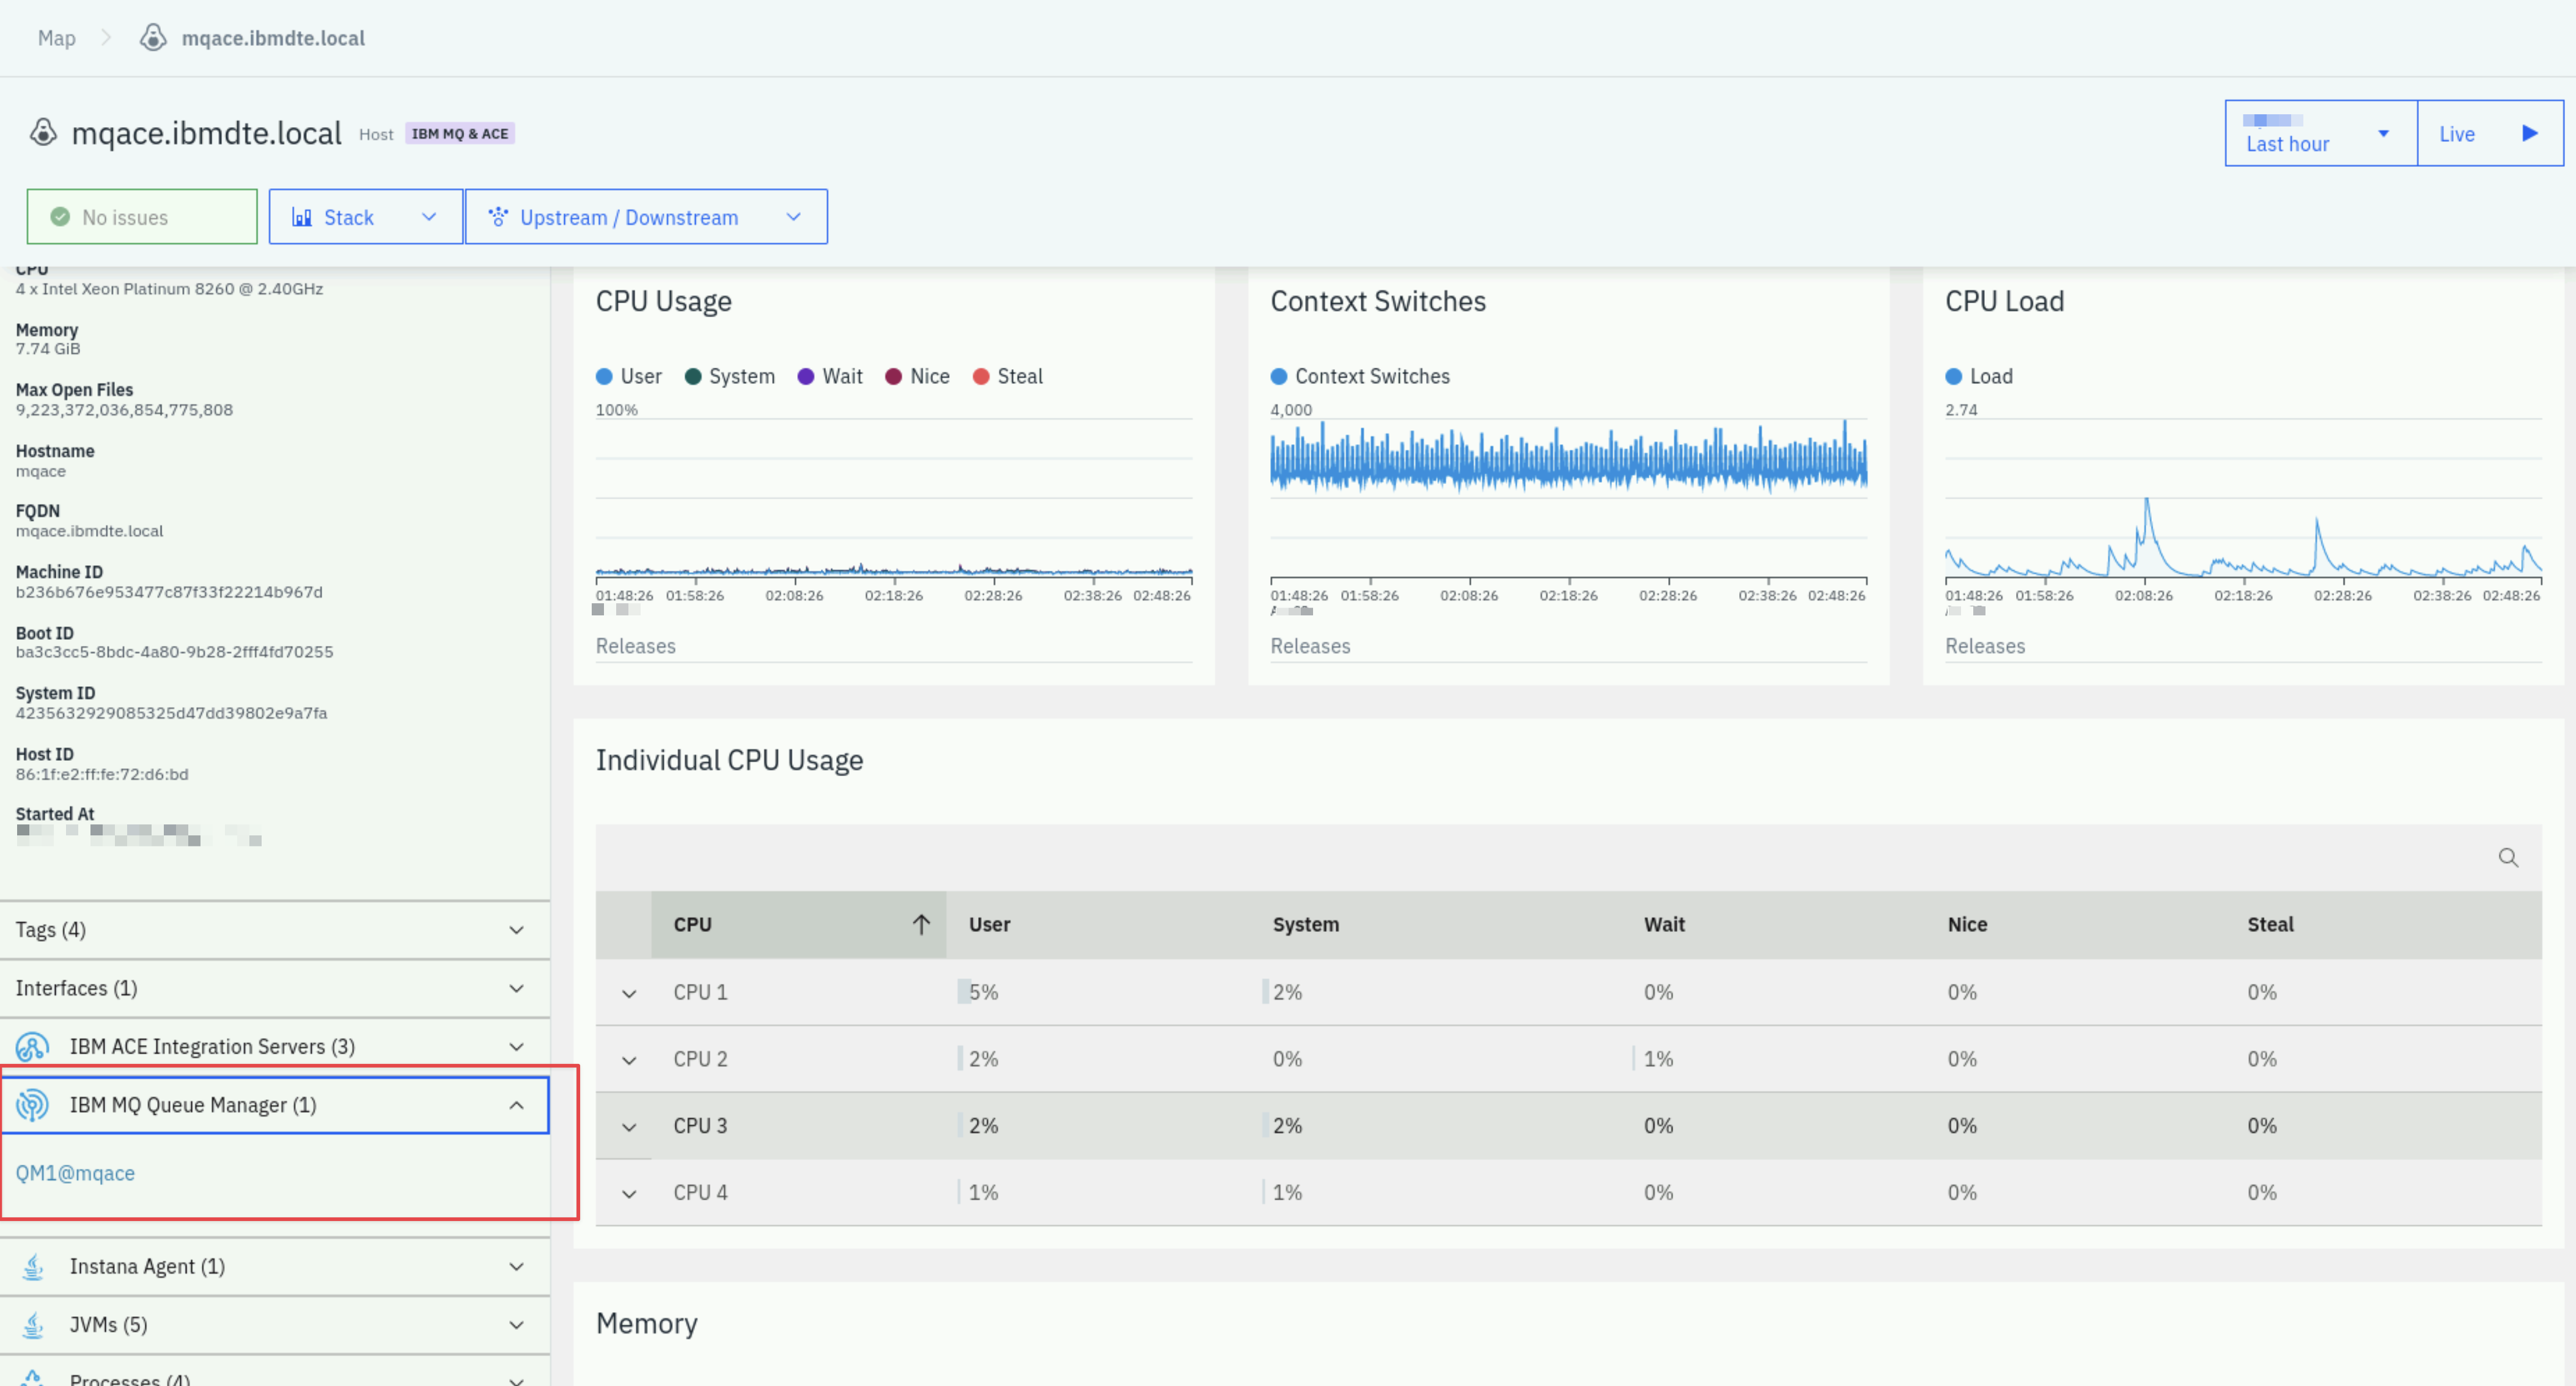
Expand the IBM MQ Queue Manager section and select the link for the QM1@mqace queue manager
You will navigate to the dashboard for the MQ Queue Manager. Scroll down the page and examine the metrics. There are many tables that contain links that would allow you to drill into the listener, topics, queues, channels, and more. Let's focus on the Channels. Scroll down to the table labeled Channels.
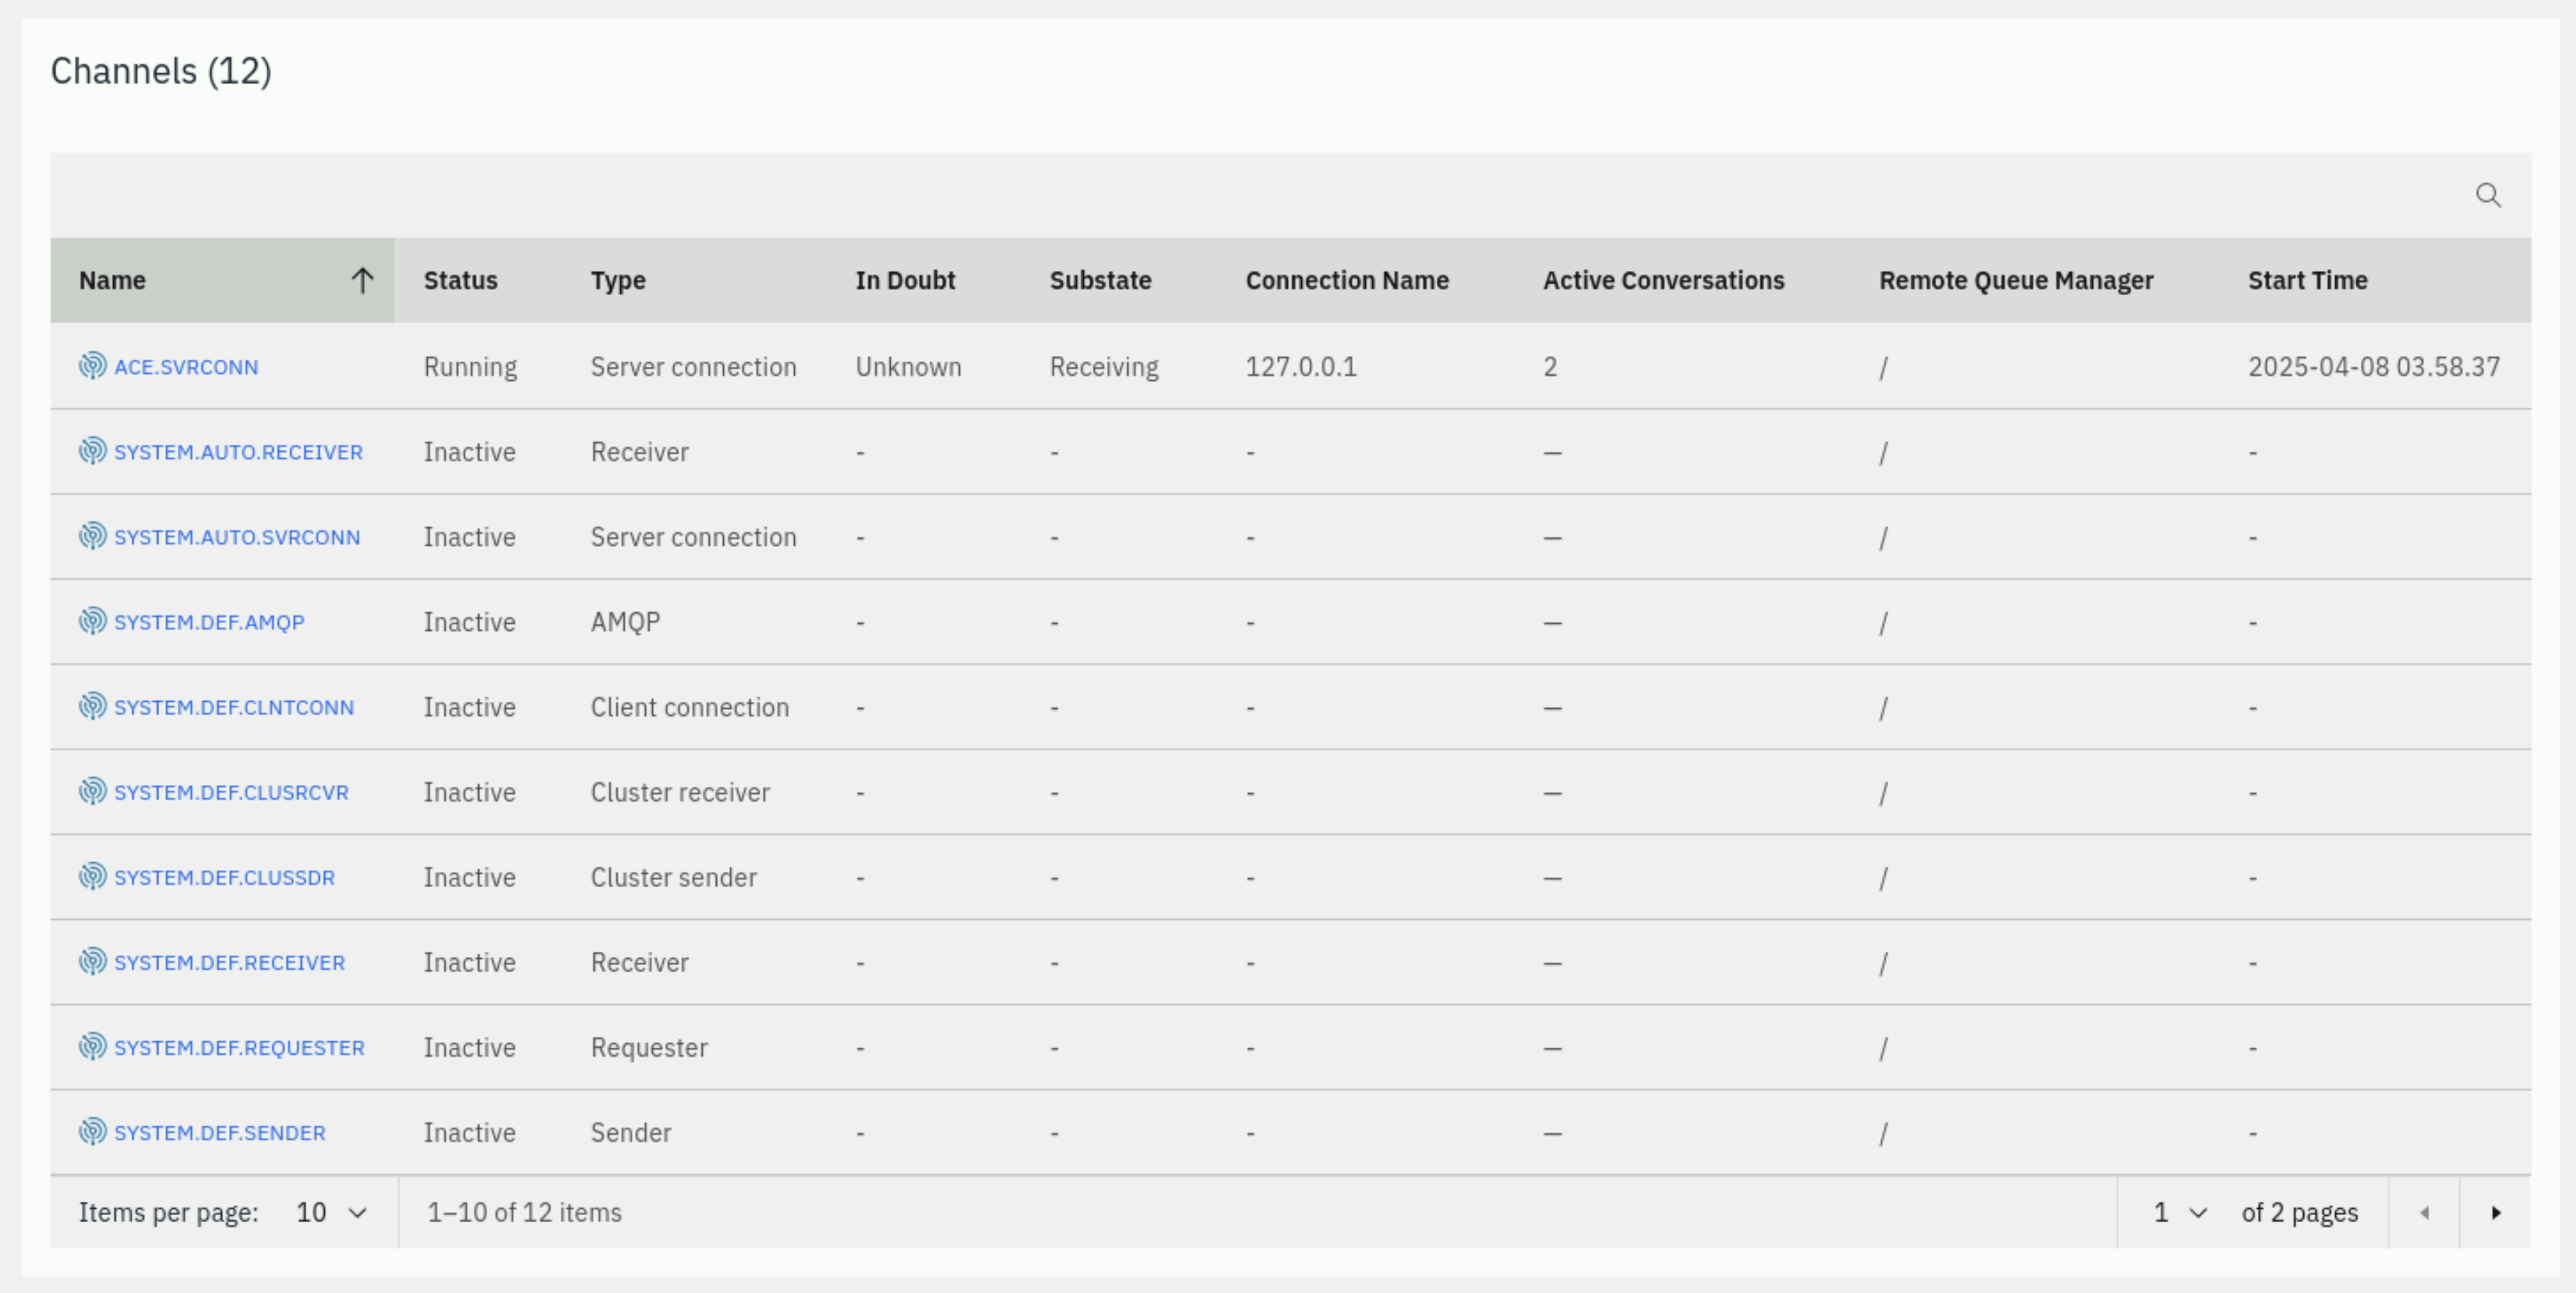
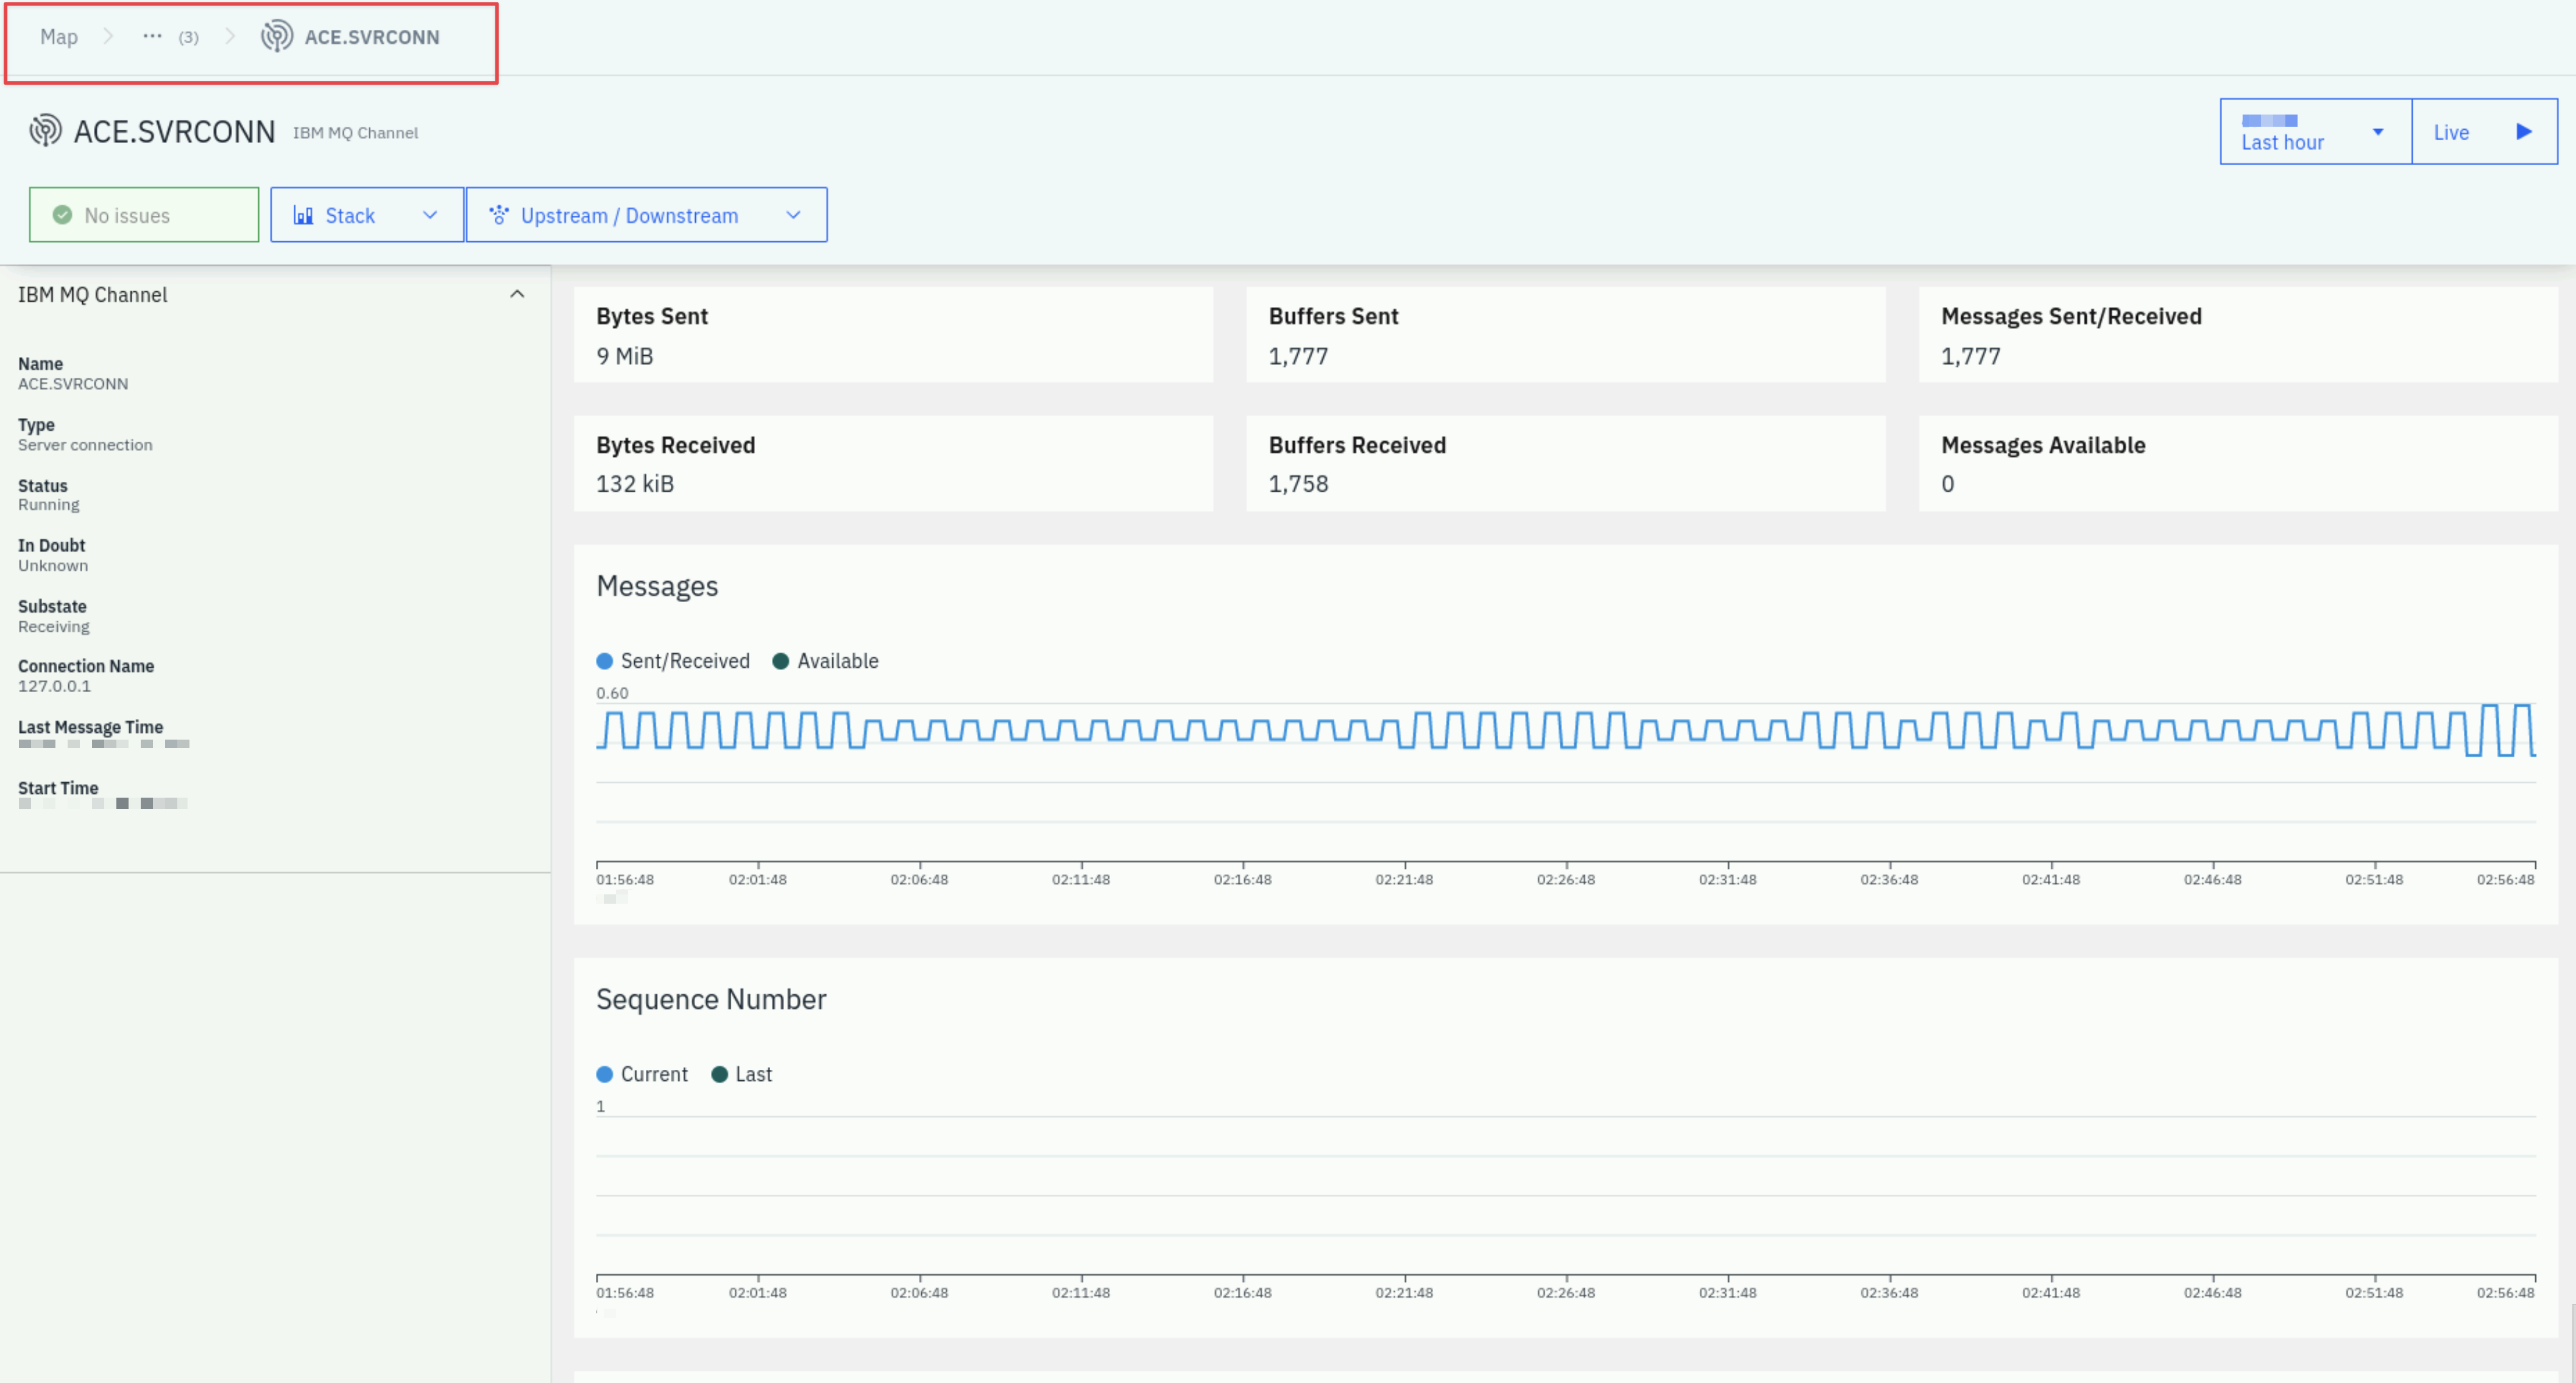
Click on the blue text that says ACE.SRVCONN on the left to drill into the Channel. Examine the Channel metrics on the page.
Next, look at the top of the screen. You'll notice that this is a breadcrumb that allows you to navigate back to where you were earlier in your navigation. It is also possible to use the back button in your browser.
If time permits at the end of the lab, you can explore some of the other elements within the MQ sensor or other middleware such as ACE.
3.3: Create an Application Perspective for Robot Shop
Before we can investigate Applications within Instana, we need to create an Application Perspective. This section describes how to define the Application Perspective.
Application Perspectives allow you to group together a number of different services and endpoints into dashboard that shows the health and performance of a business application. In this section, you will create an Application Perspective for the Robot Shop application.
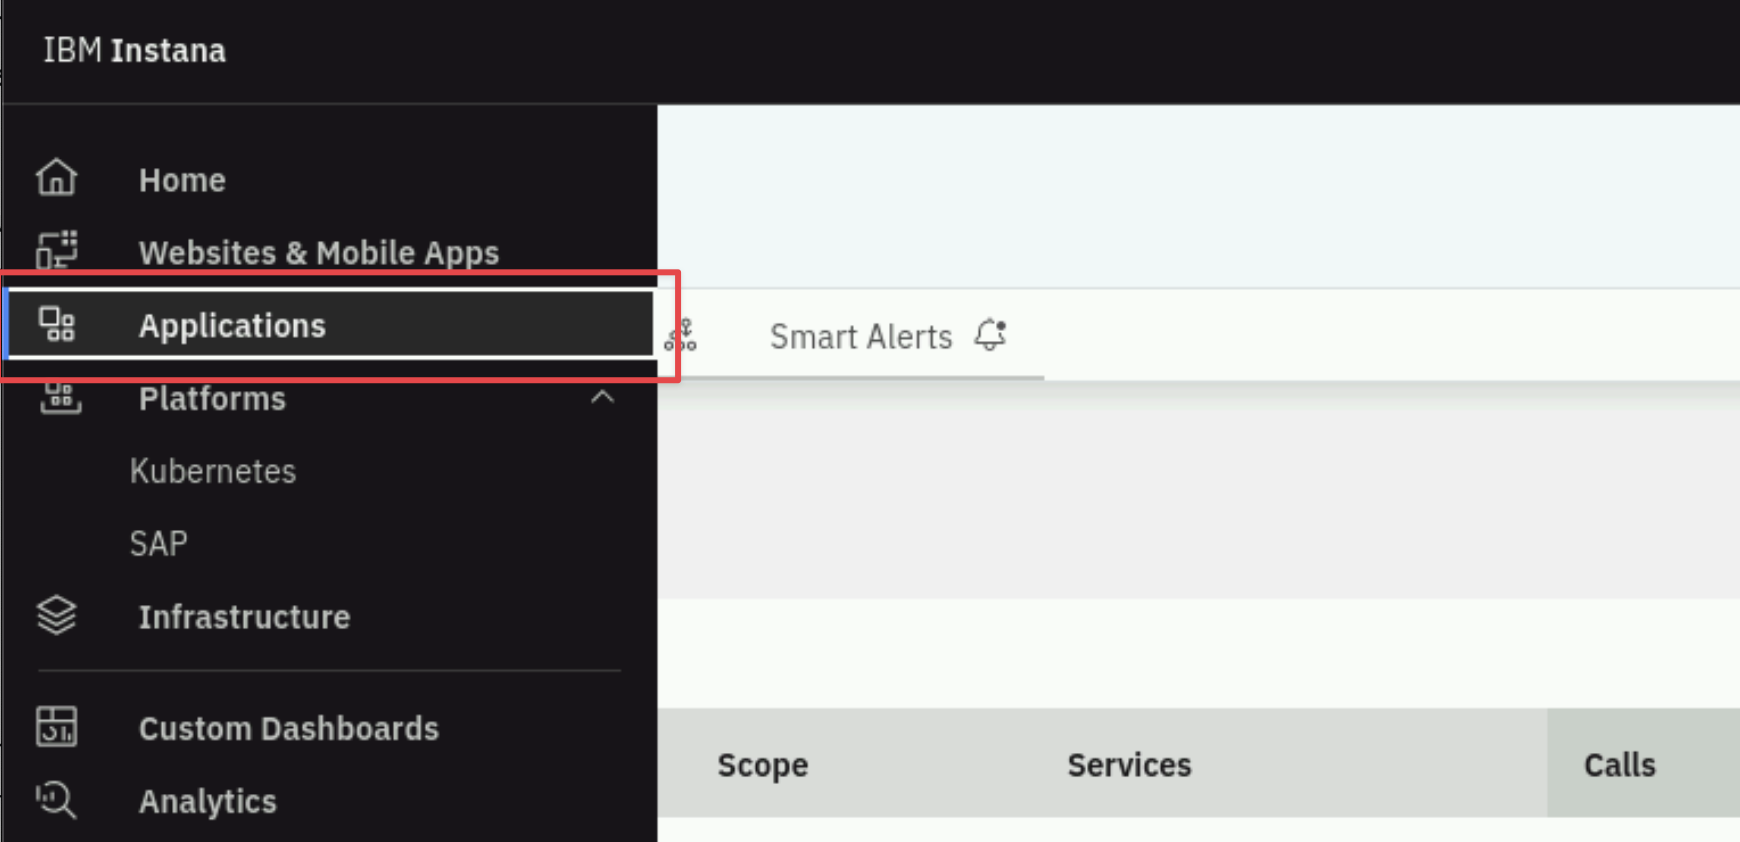
On the left hand navigation, select Applications.
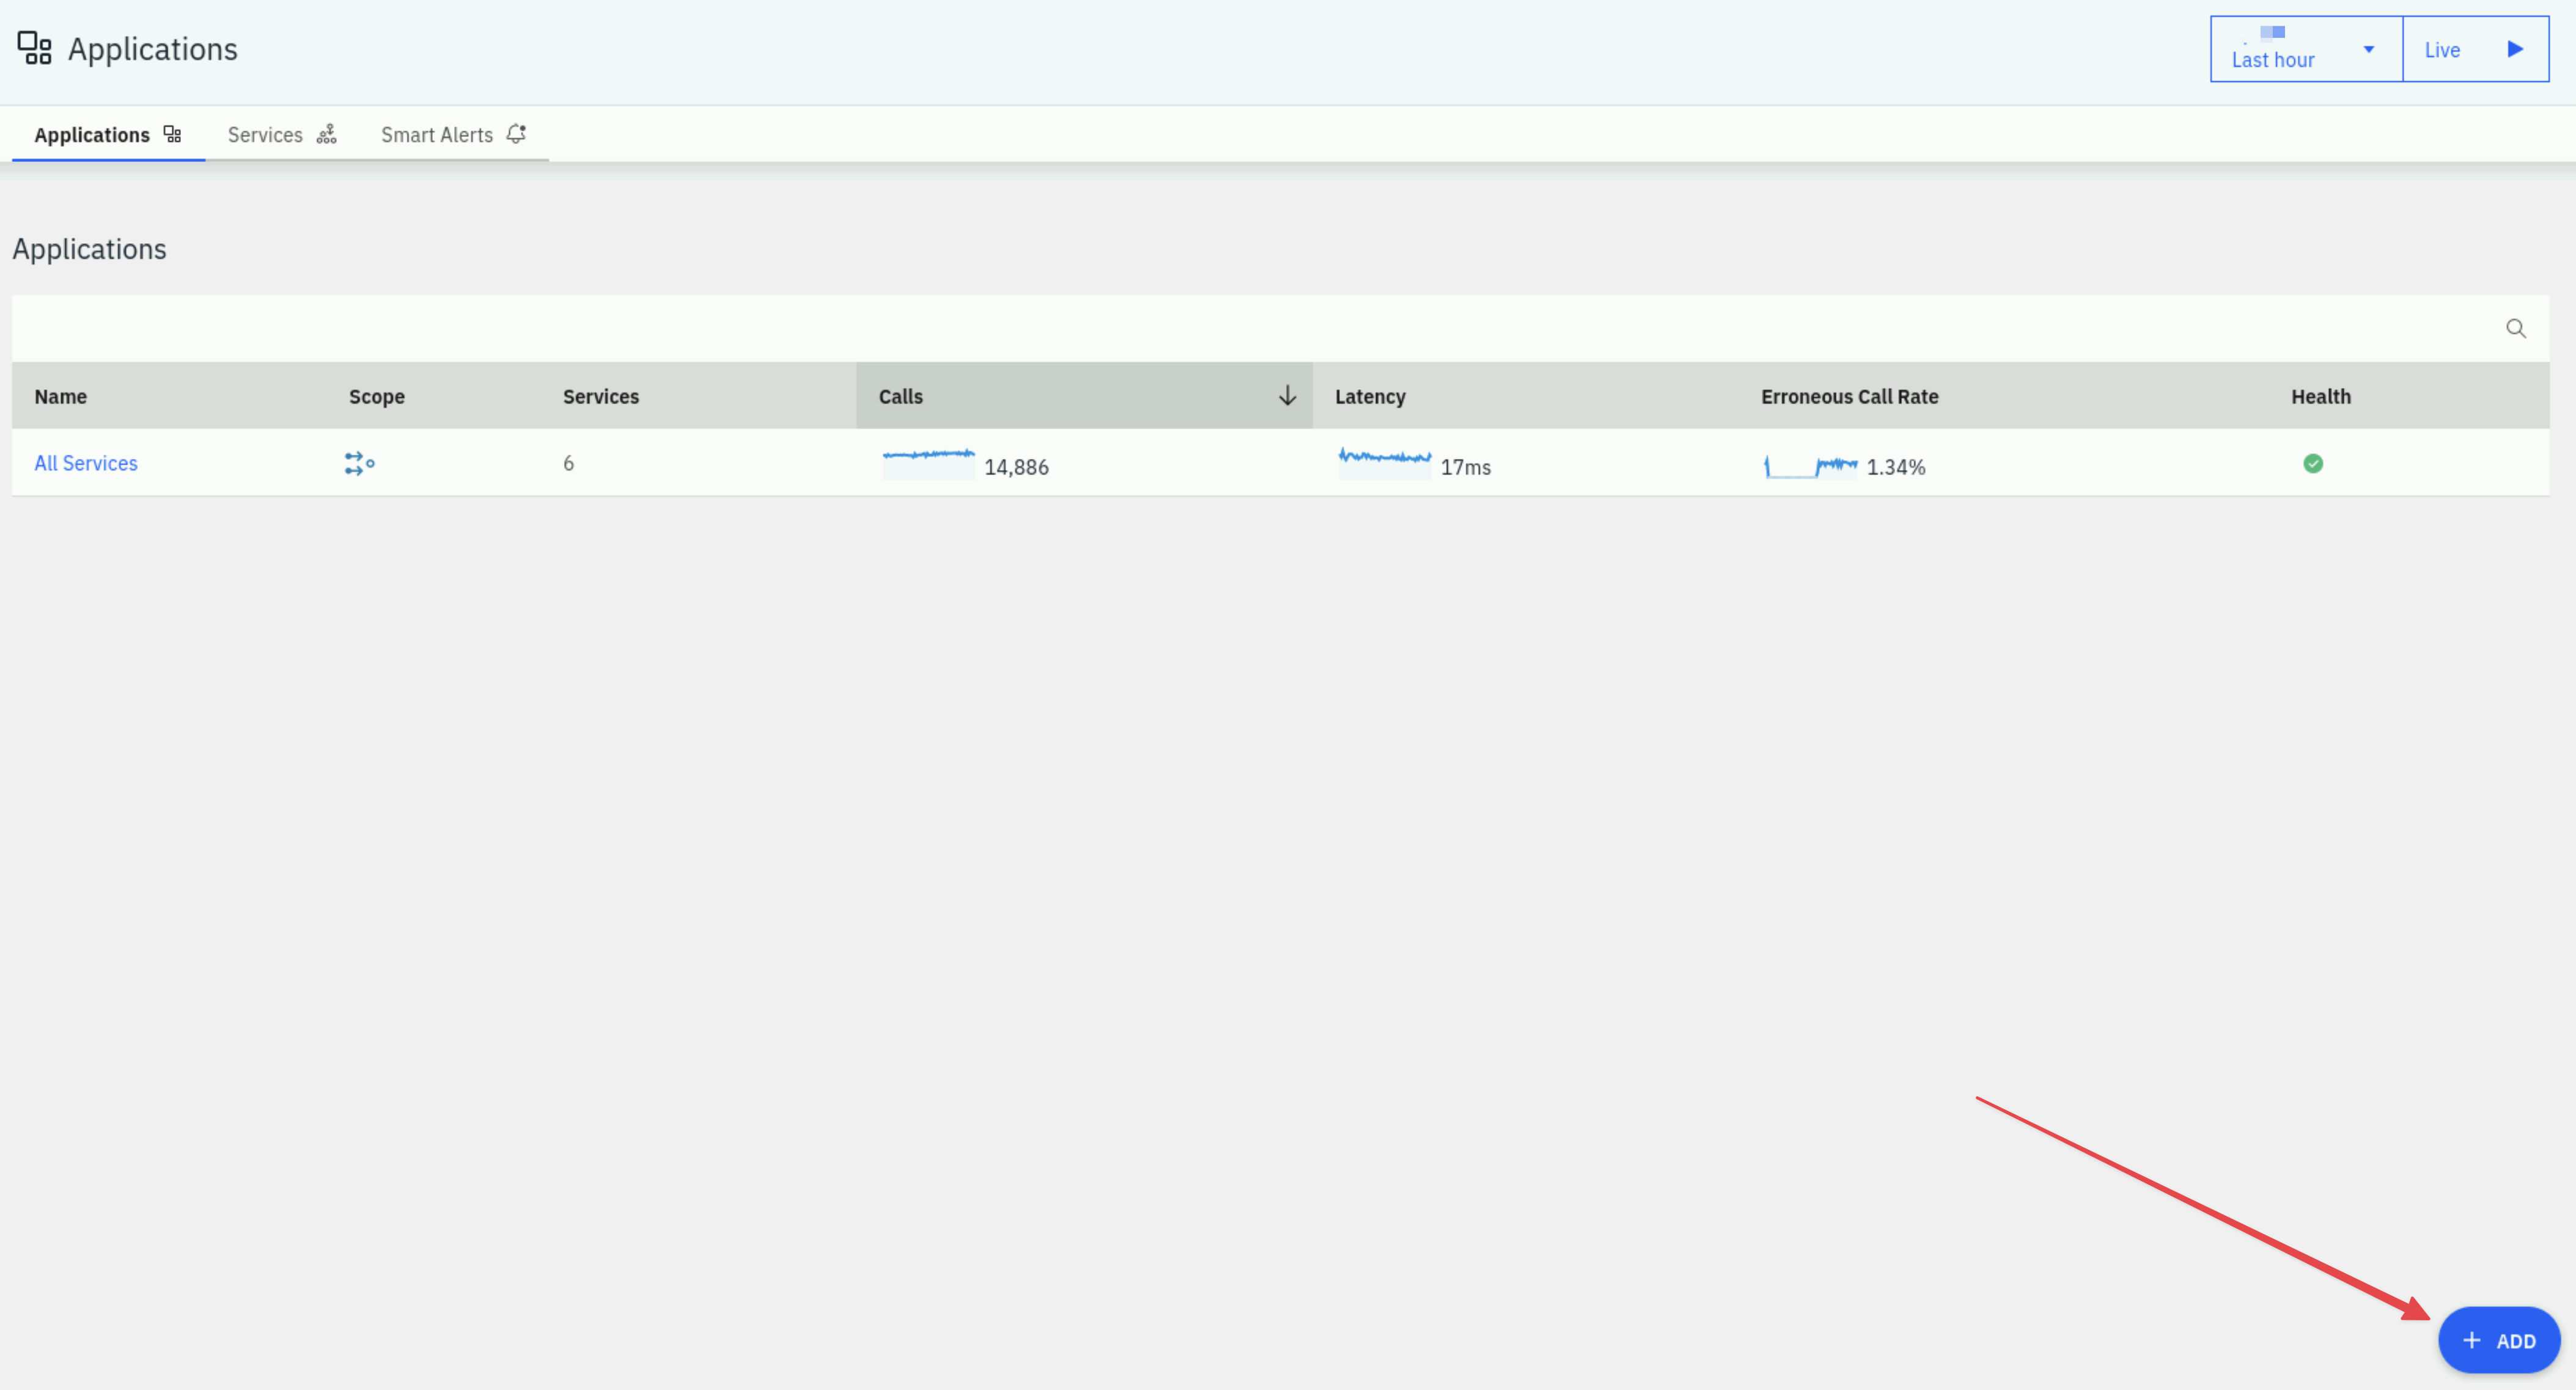
You will see a list of all applications that are defined in the environment. Initially, this list only has one entry called All Services.
Define a new application. Select the Add button in the bottom right corner.
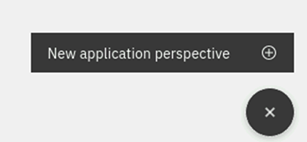
Select New Application Perspective
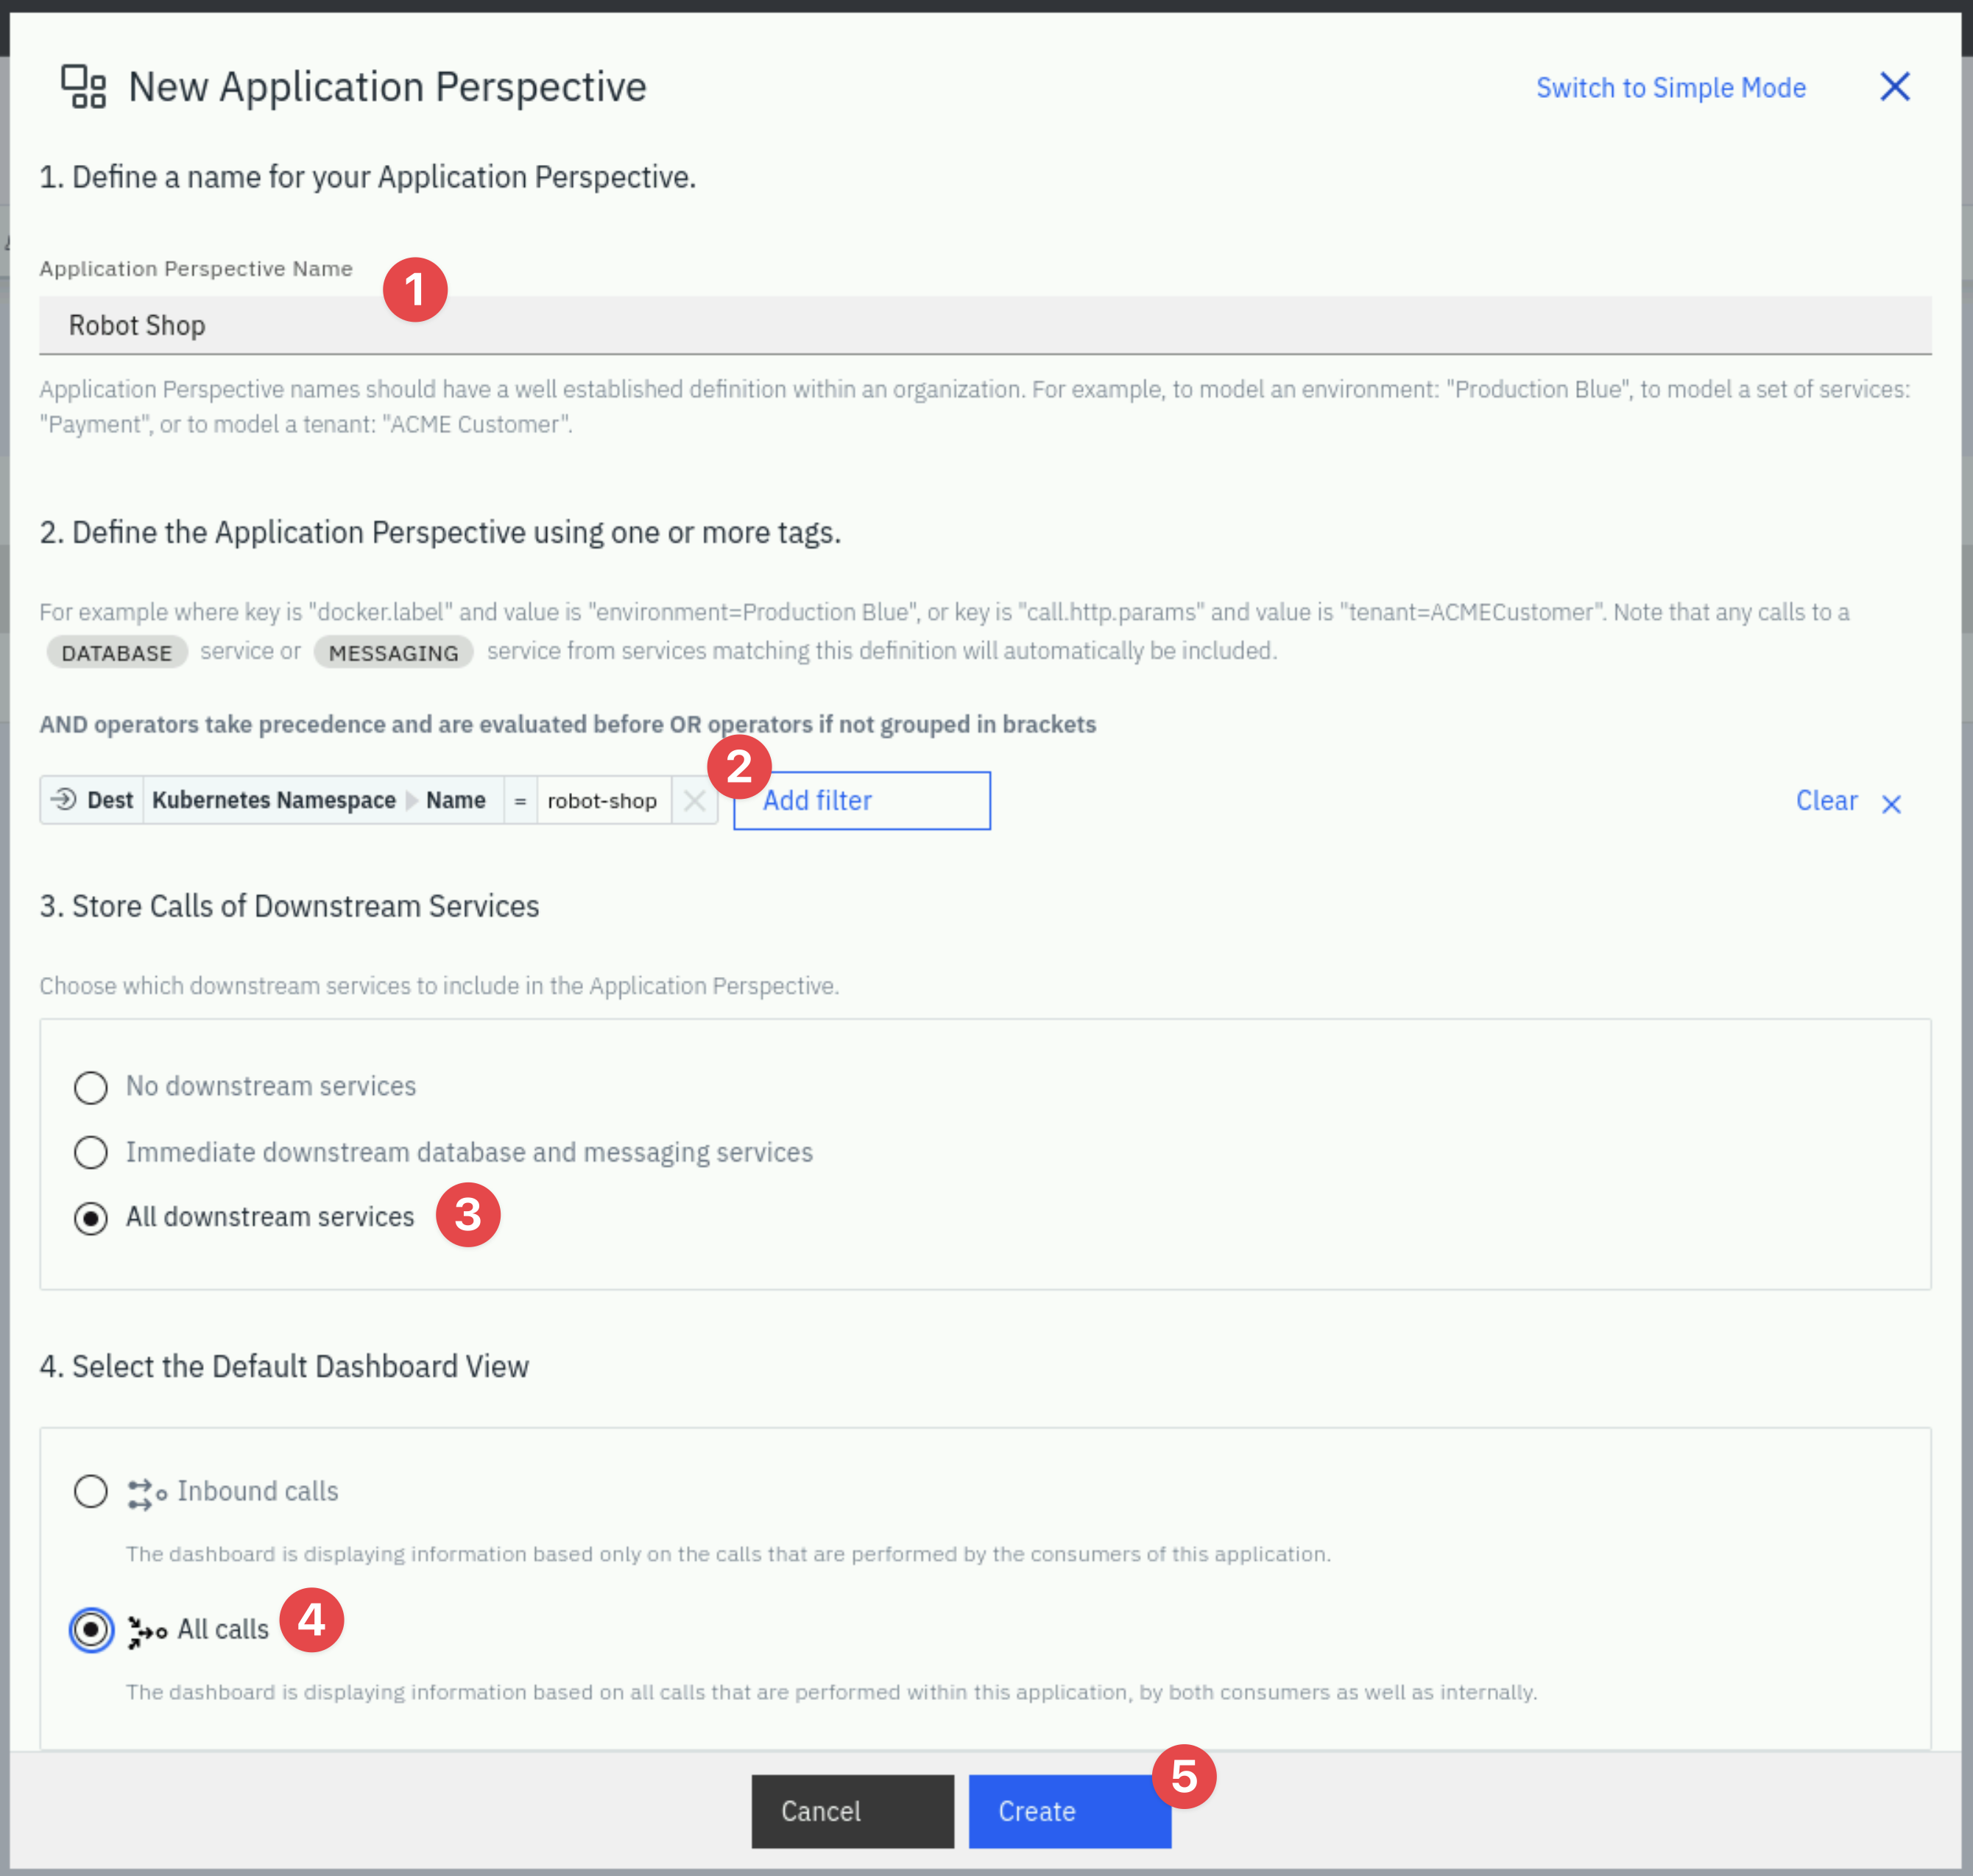
Switch to the Advanced Mode in the upper right corner. Complete the definition to look like below.
- Name the Application Perspective
Robot Shop - Add a filter, type in kubernetes namespace and then select Kubernetes namespace name. Then, click in the value field. You'll notice that when you click on it, the field is pre-populated with kubernetes namespaces that have applications being monitored. Select the robot-shop namespace.
- Select All downstream services. This selection will allow the application perspective to limit the scope to all transactions within the robot-shop kubernetes namespace.
- Select to include All Calls
- Click the Create button to create the application perspective.
3.4: Create an Application Perspective for QOTD
We can now repeat a similar process to the previous section to configure an Application Perspective for the Quote of the Day application.
On the left hand navigation, select Applications.
Click the "Add" button in the bottom right corner and select New Application Perspective
Swich to the Advanced Mode in the upper right corner. Then complete the definition to look like below.
- Name the Application Perspective
Quote of the Day - Add filters for Service Name, Kubernetes Namespace Name and Endpoint Name as per the image below. As you add filters, notice that you need to add a combination of AND and OR conditions to achieve the results that you want.
- Select All downstream services.
- Select to include All Calls
- Click the Create button to create the application perspective.
Pay close attention to the filters. The last filter is a not equal filter.
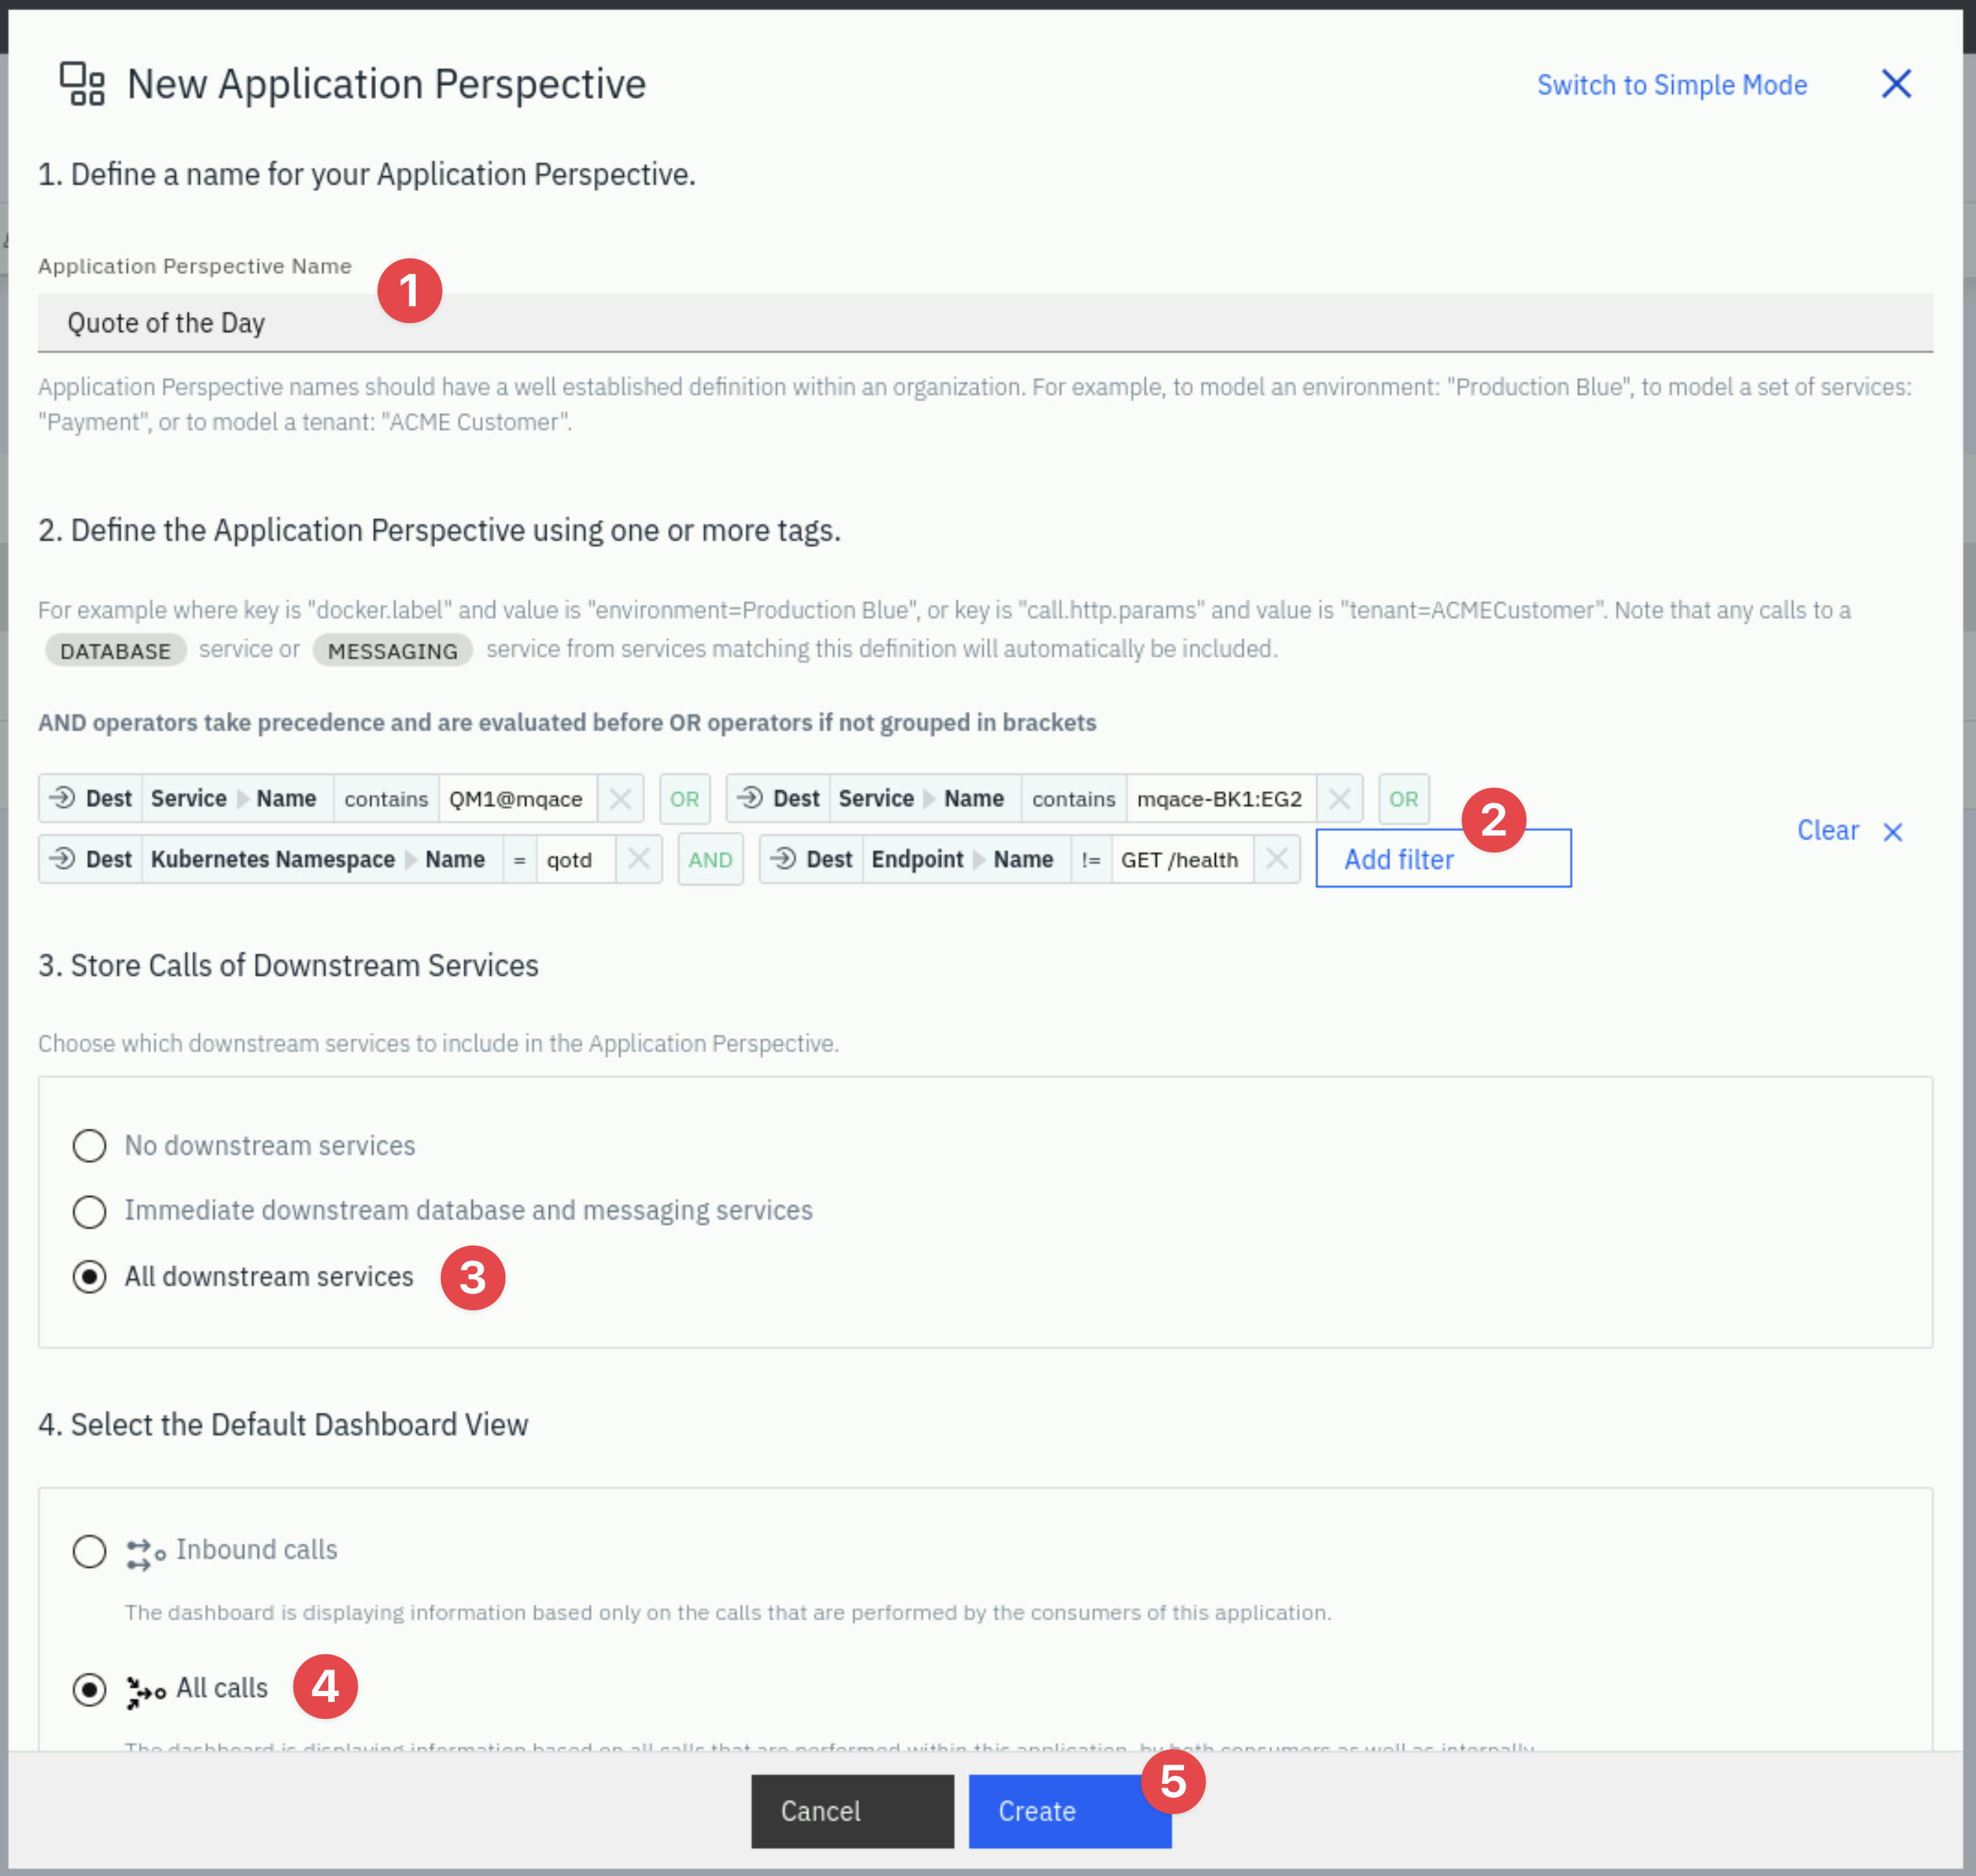
What this Application Perspective is doing is the following:
- We are including the MQ Service by matching any service that contains the Queue Manager Name of QM1@mqace.
- We're including any service that includes the name of our ACE Integration Server named mqace-BK1:EG2.
- We're including any transactions that are in the qotd kubernetes namespace where the Quote of the Day application is installed. Using namespaces makes it very easy to build Application Perspectives for cloud native applications.
- Finally we added a filter to filter OUT any trace that has an endpoint name of GET /health. The GET /health requests are the readiness probes (heartbeating) that happens within kubernetes to ensure the pods are healthy. These transactions are not part of the application, so we want to exclude them.
You have now created an Application Perspective for the Quote of the Day application. In the next section, you'll explore the application (it can take few minutes before the data for application is populated).
3.5: Explore the Application
After creating the application, your screen should have automatically changed context to show the Application Perspective that you just defined.
Initially, you probably won't see any metrics on the screen. In the upper right corner, click the Live button and change the filter to Last 5 minutes and within a short amount of time you should start to see metrics in the widgets.
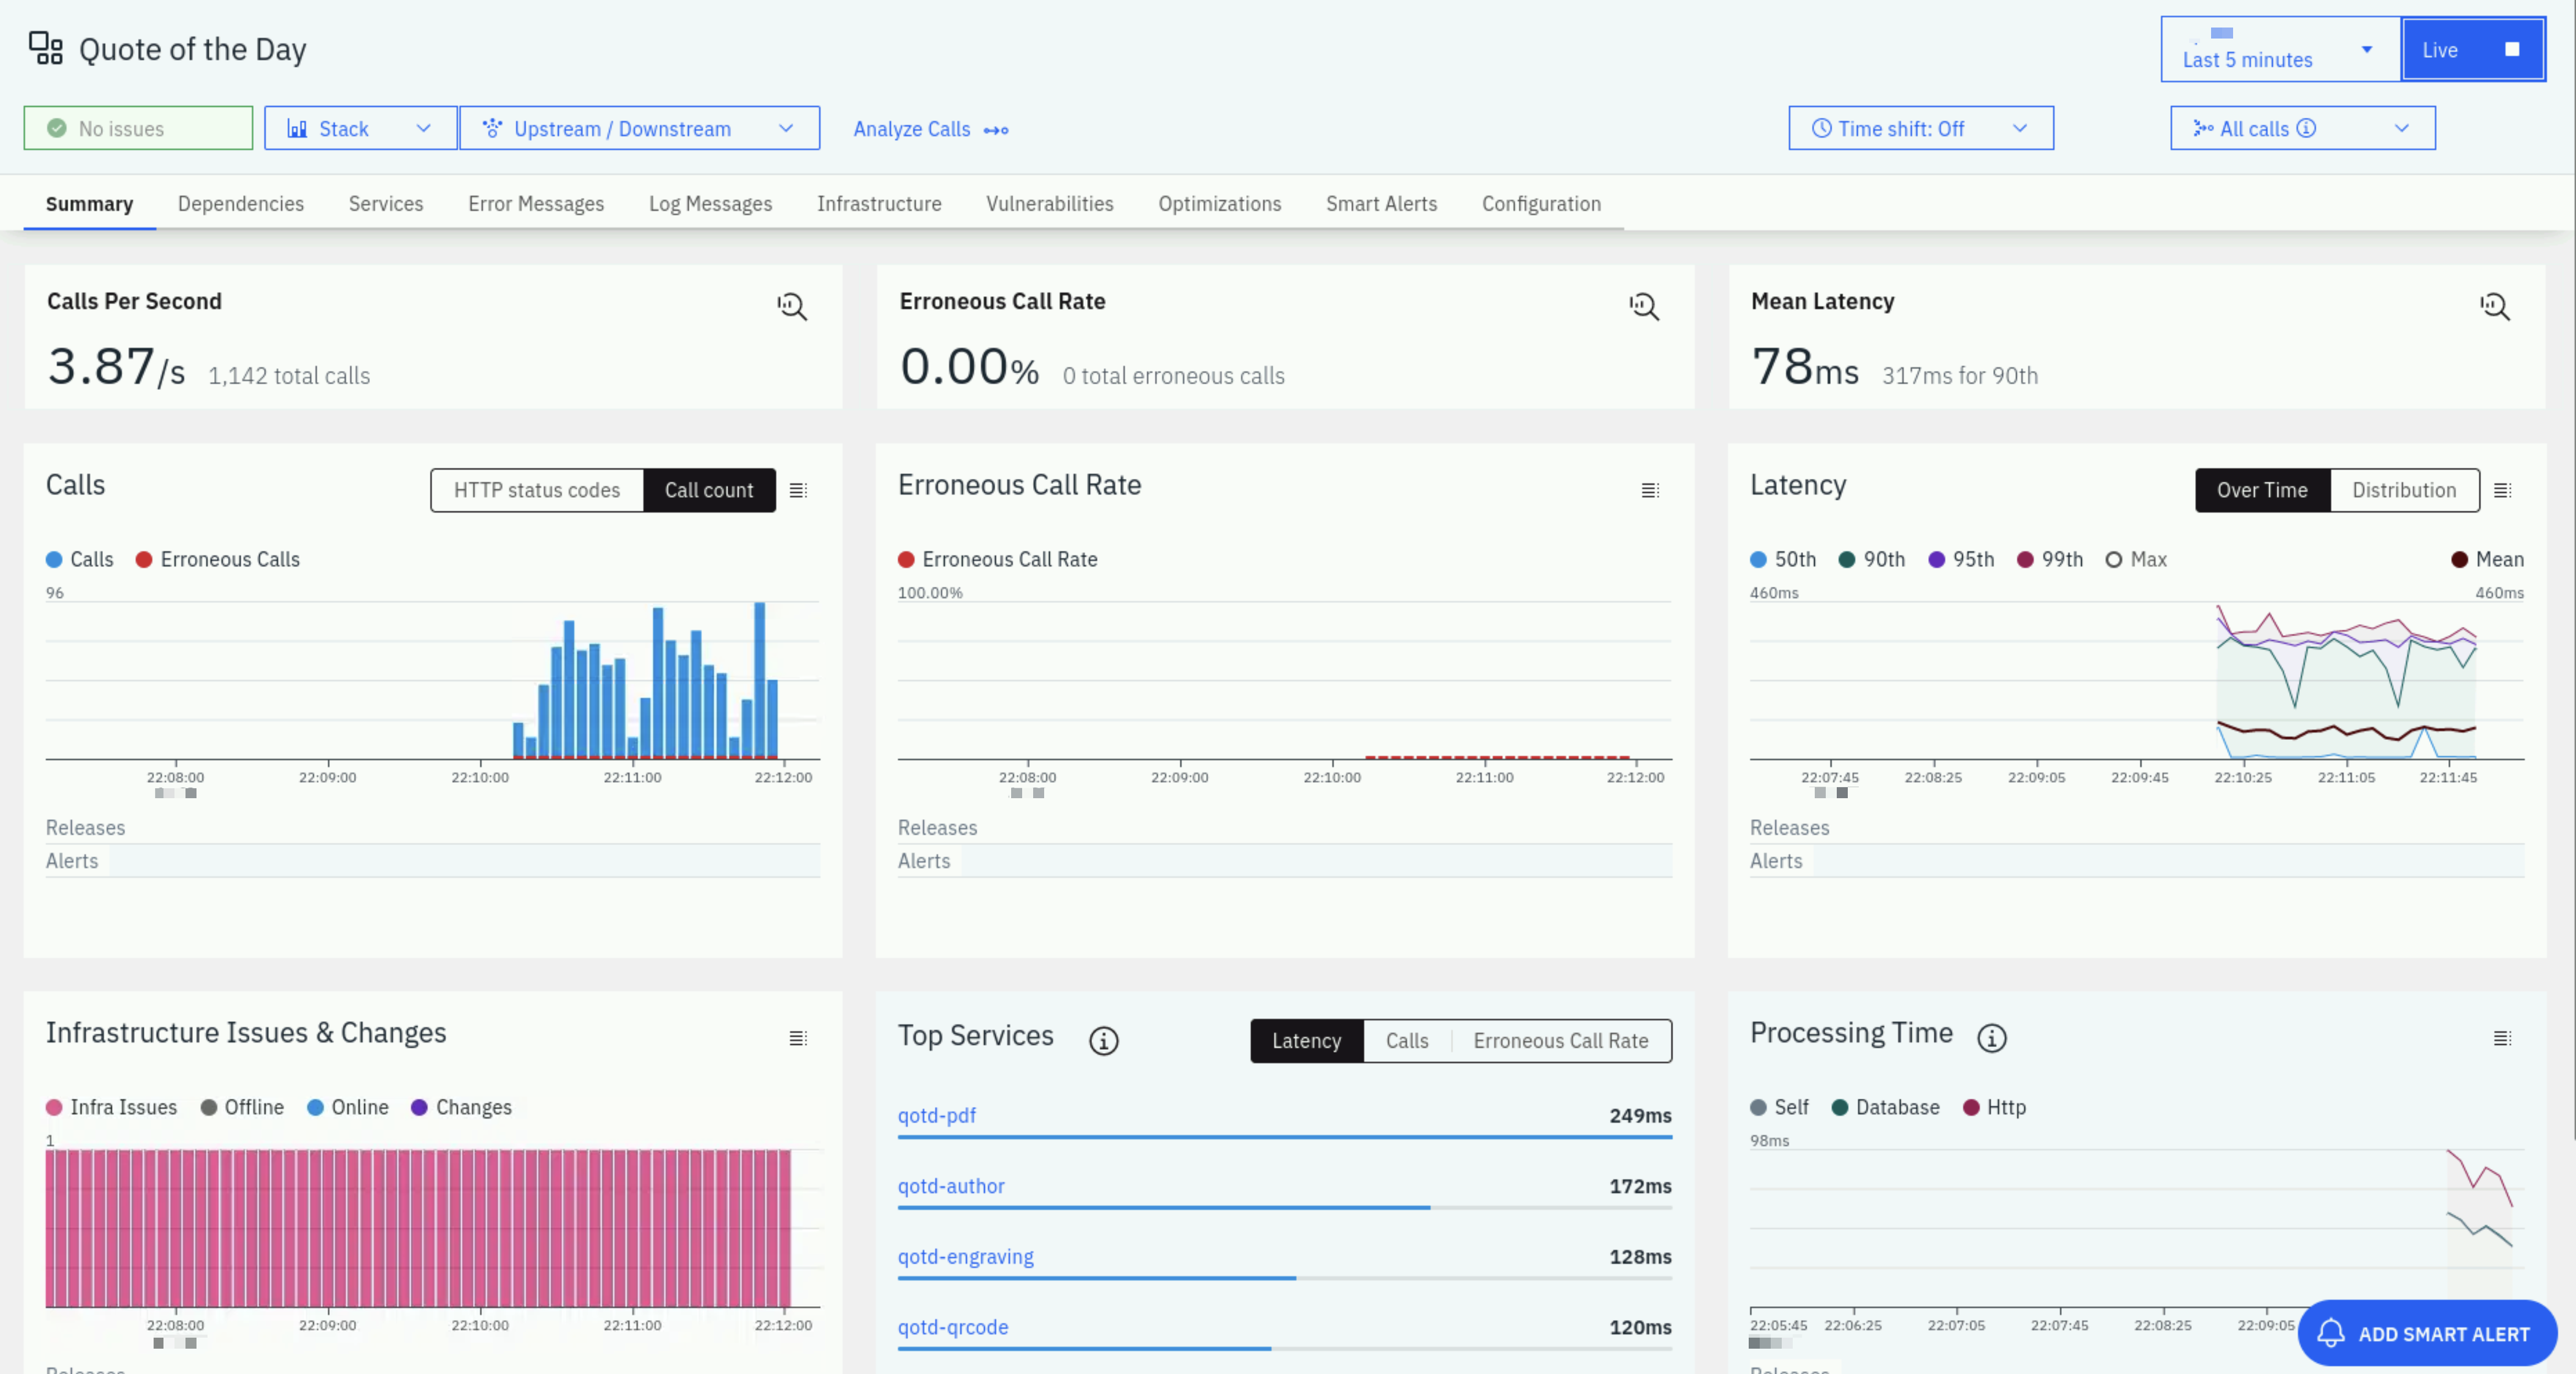
On this page you can see the golden signals which include transaction volumes, the number of erroneous calls, and latency. You'll also see the top services that make up the application.
You'll notice a number of tabs across the top of the screen. Explore these tabs. In particular, let's take a look at the Dependencies tab.
Click on the Dependencies tab.
You may need to wait a short while for Instana to generate the complete topology.
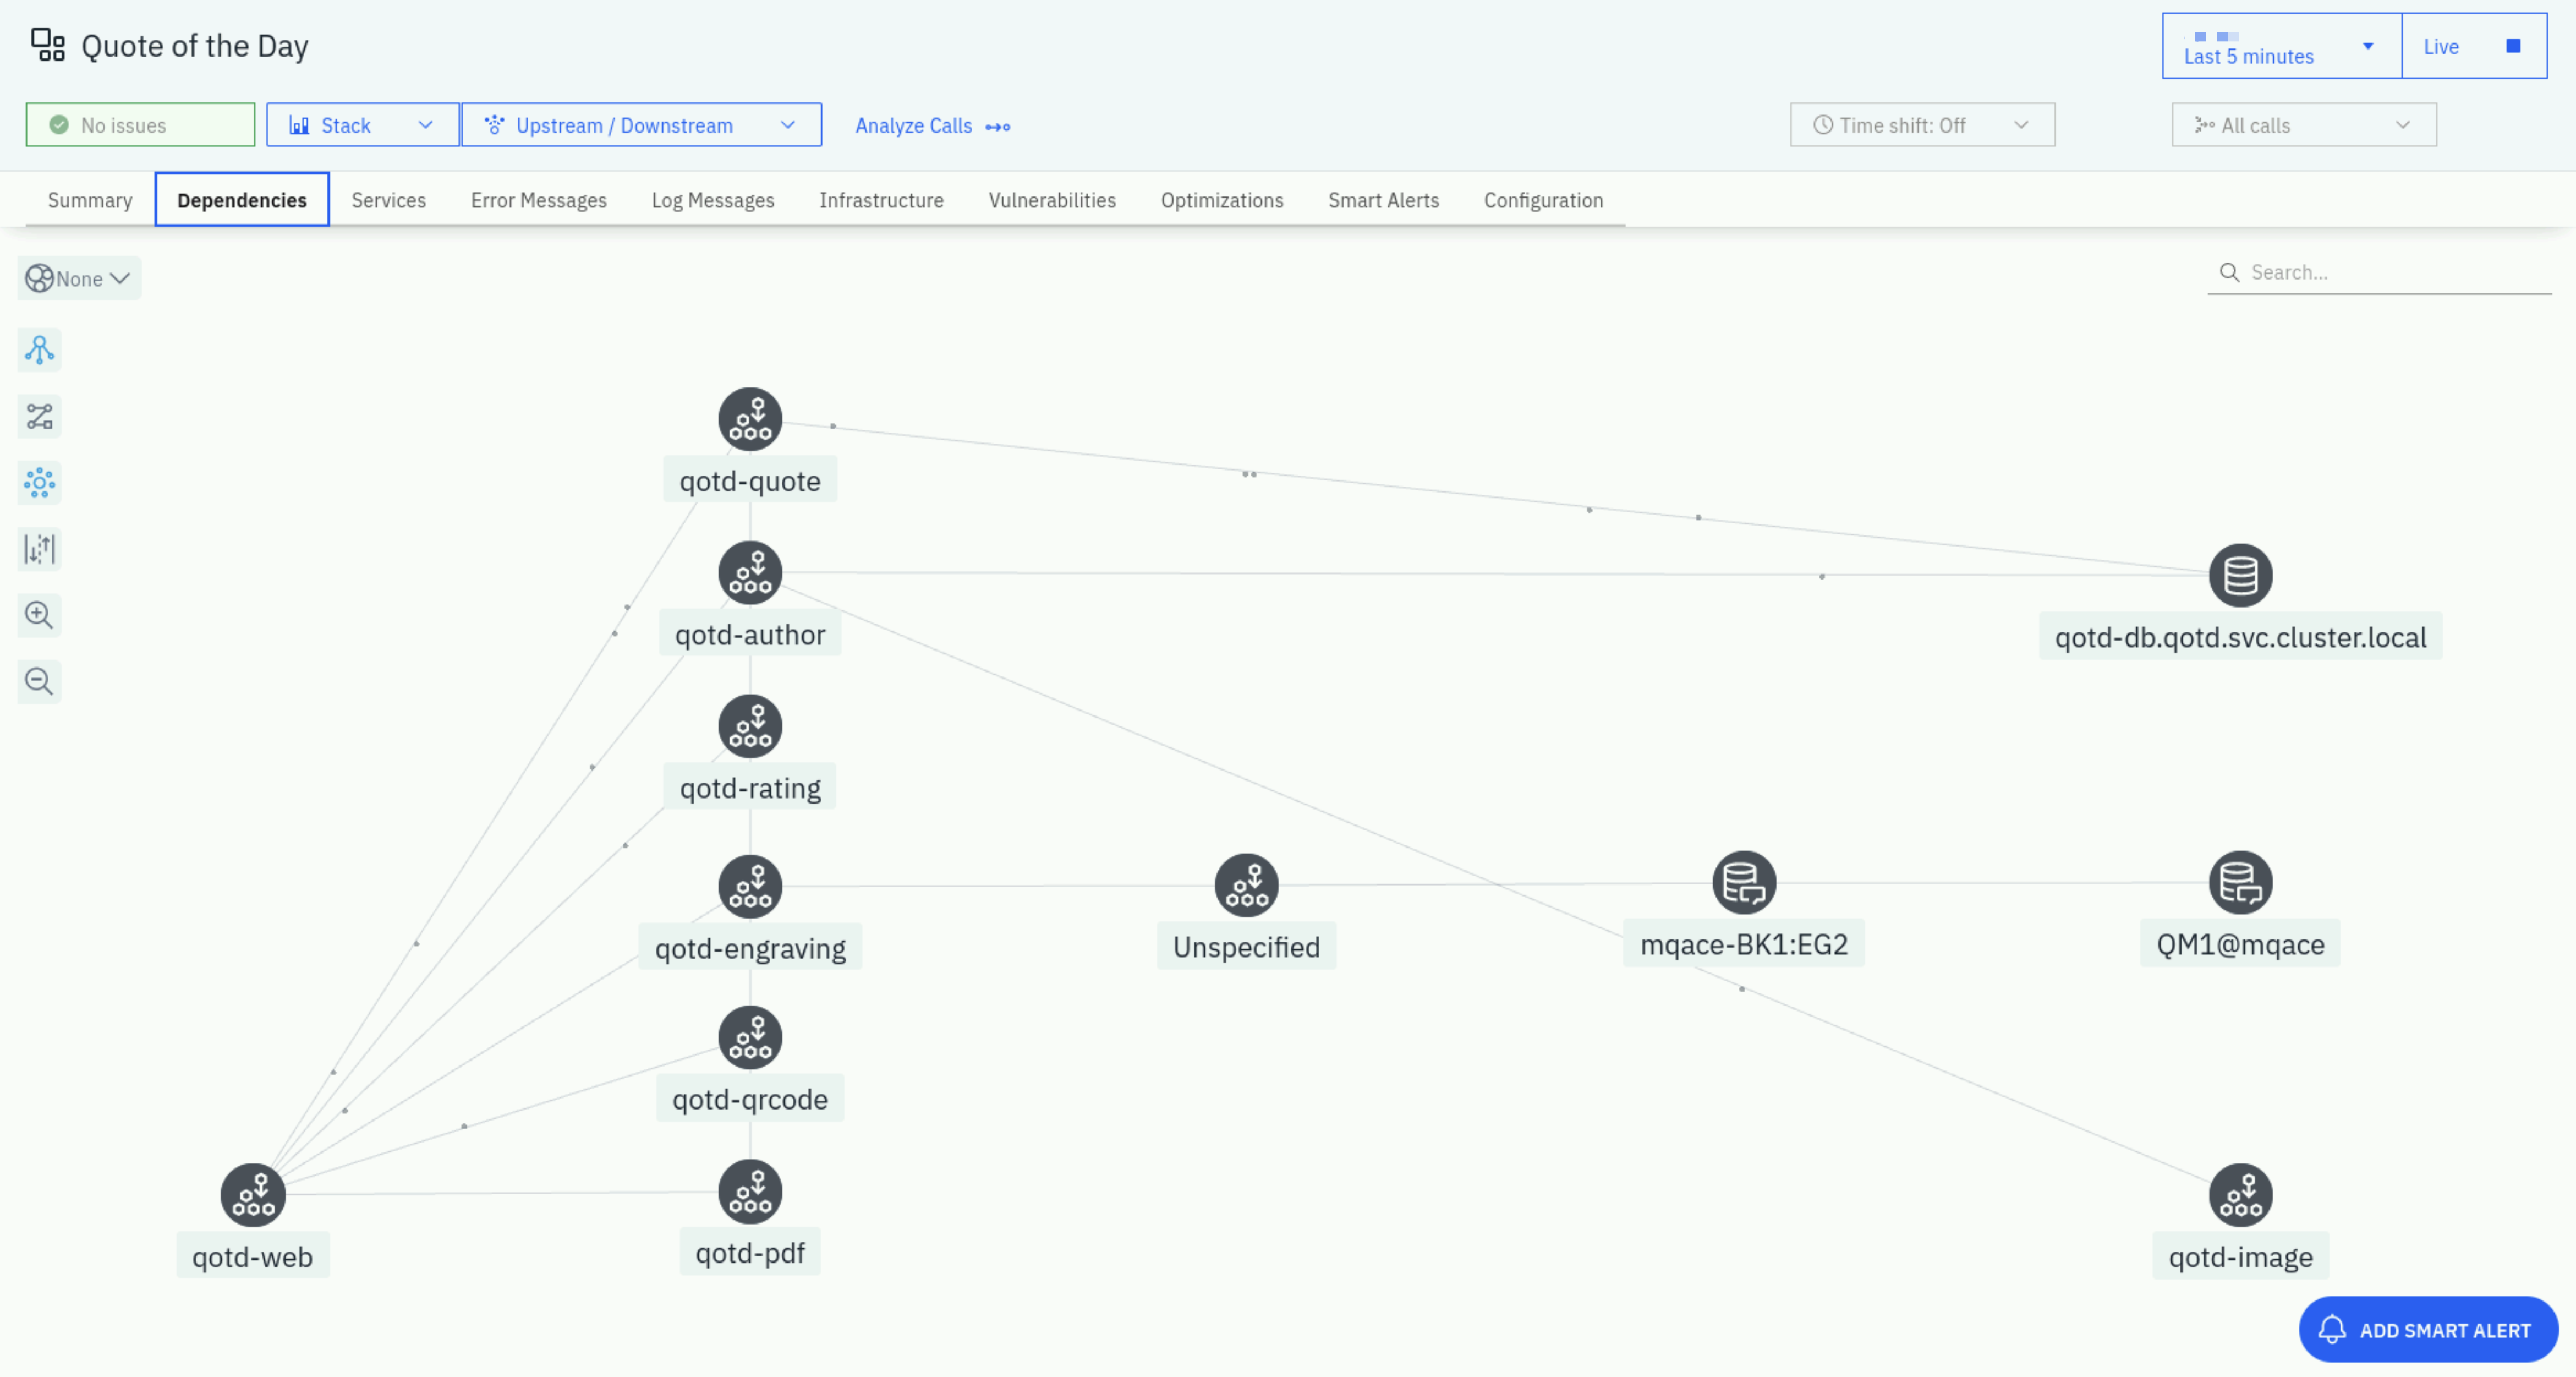
On the dependencies tab, you'll see a full topology of the application services. This topology is discovered automatically.
You can see transactions flowing between the different nodes in the topology. Most of these services are node.js based cloud-native services. There should be also be a node with a name that ends in BK1:EG2. BK1 is the ACE Integration Node and EG2 is the ACE Integration Server. The QM1 node in the topology is the MQ Queue Manager named QM1.
Fly your mouse over the QM1@mqace node. Flying over any node in the dependency graph will show you a summary of the traces going through that service. You'll see the percentage of calls that are erroneous and the latency of the calls.
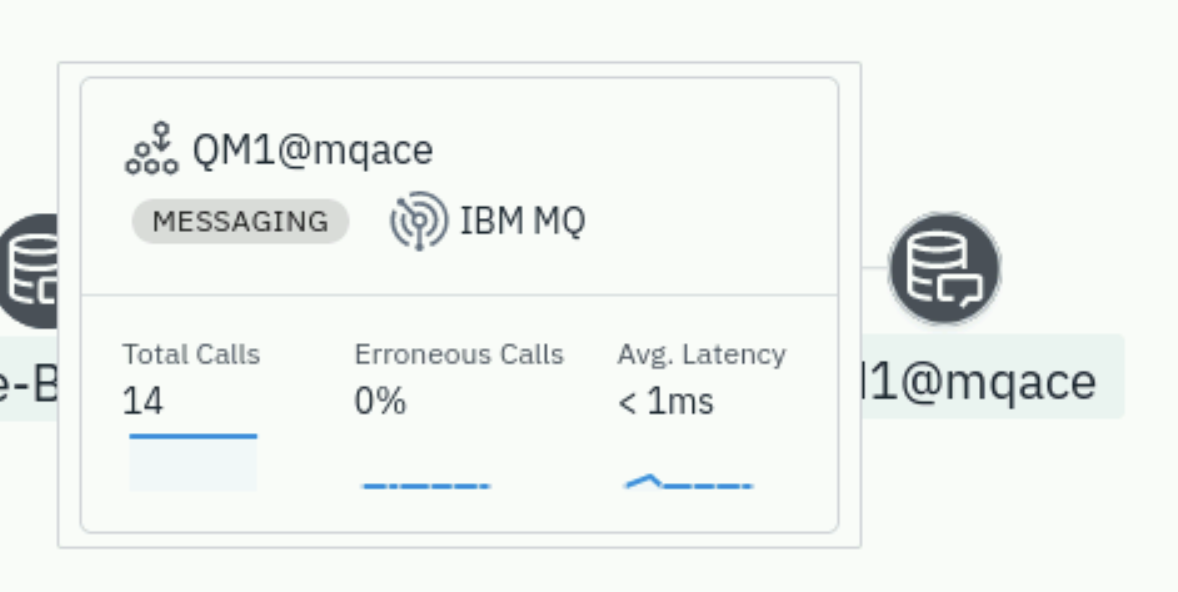
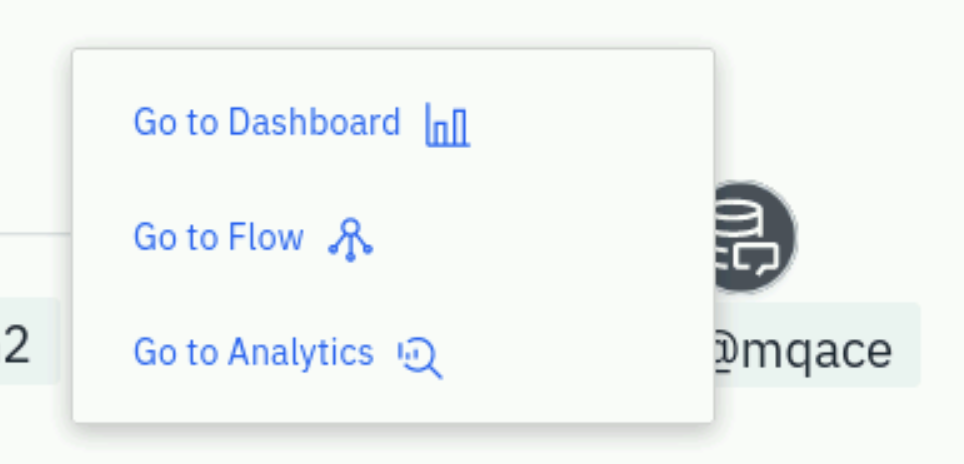
Click on the QM1@mqace node. Notice that there are 3 options that would allow you to navigate to the MQ dashboard, the transaction Flow within MQ, or analyze the transaction calls through MQ. For now, we'll skip this navigation, but we suggest you explore those options later.
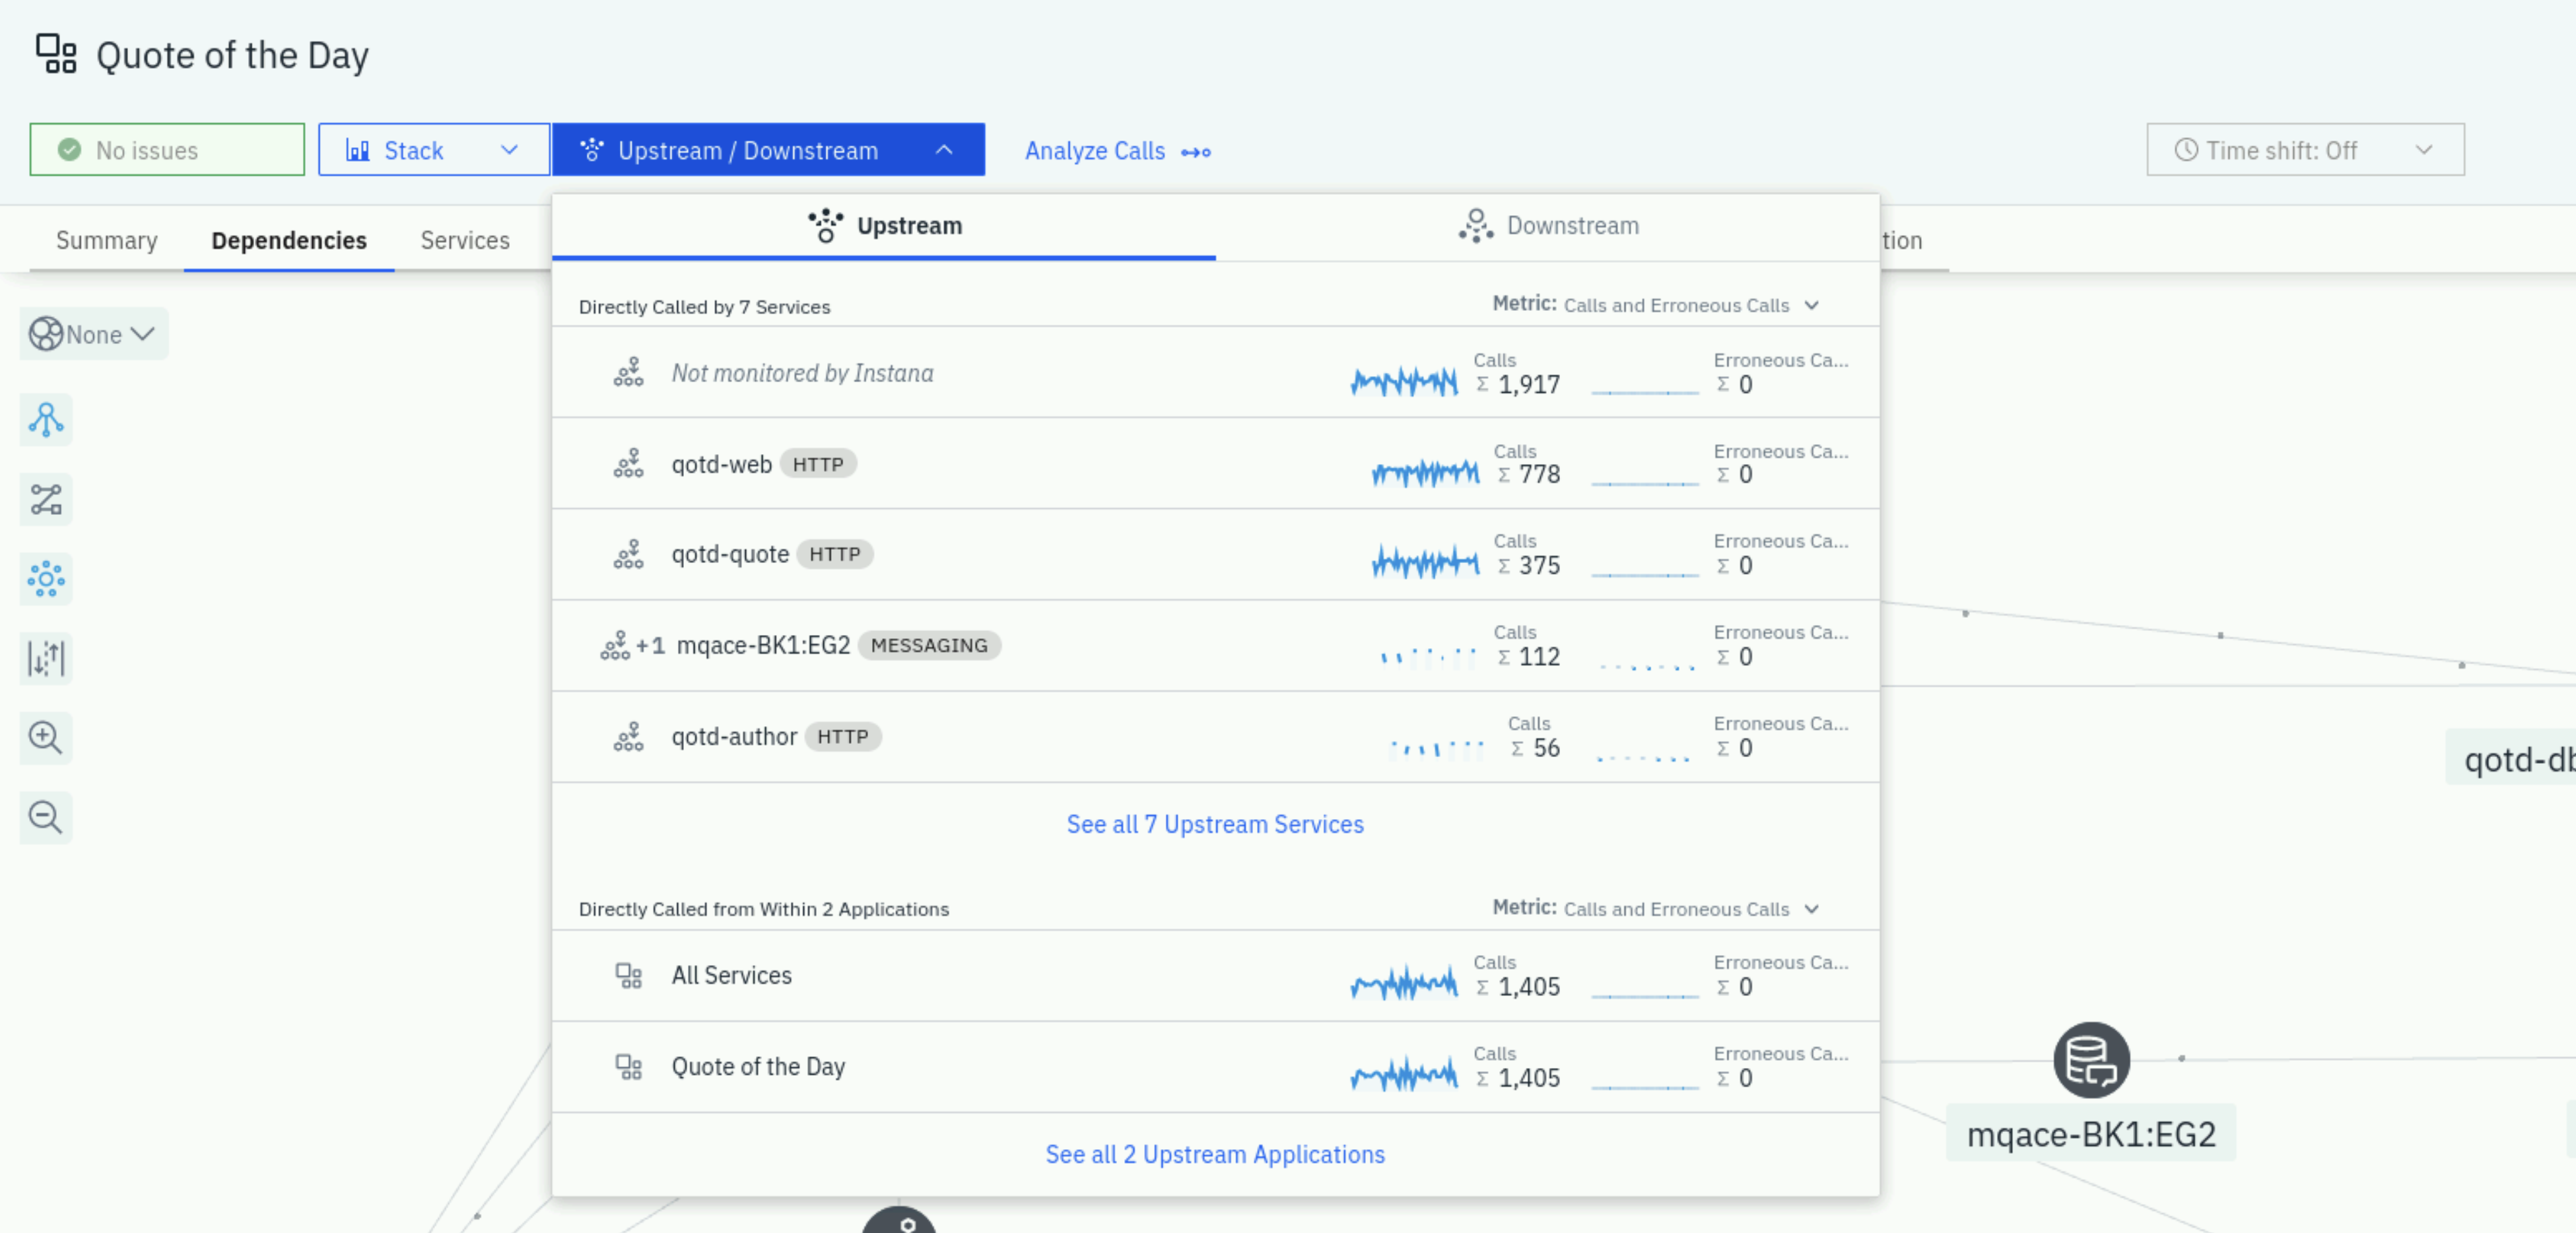
Click on "Upstream/Downsteam" near the top of the page. This will allow you to see a list of Upstream and Downstream services for the application.
Click on "Stack" where you can view the Application, Kubernetes, and Infrastructure stack that makes up the application.
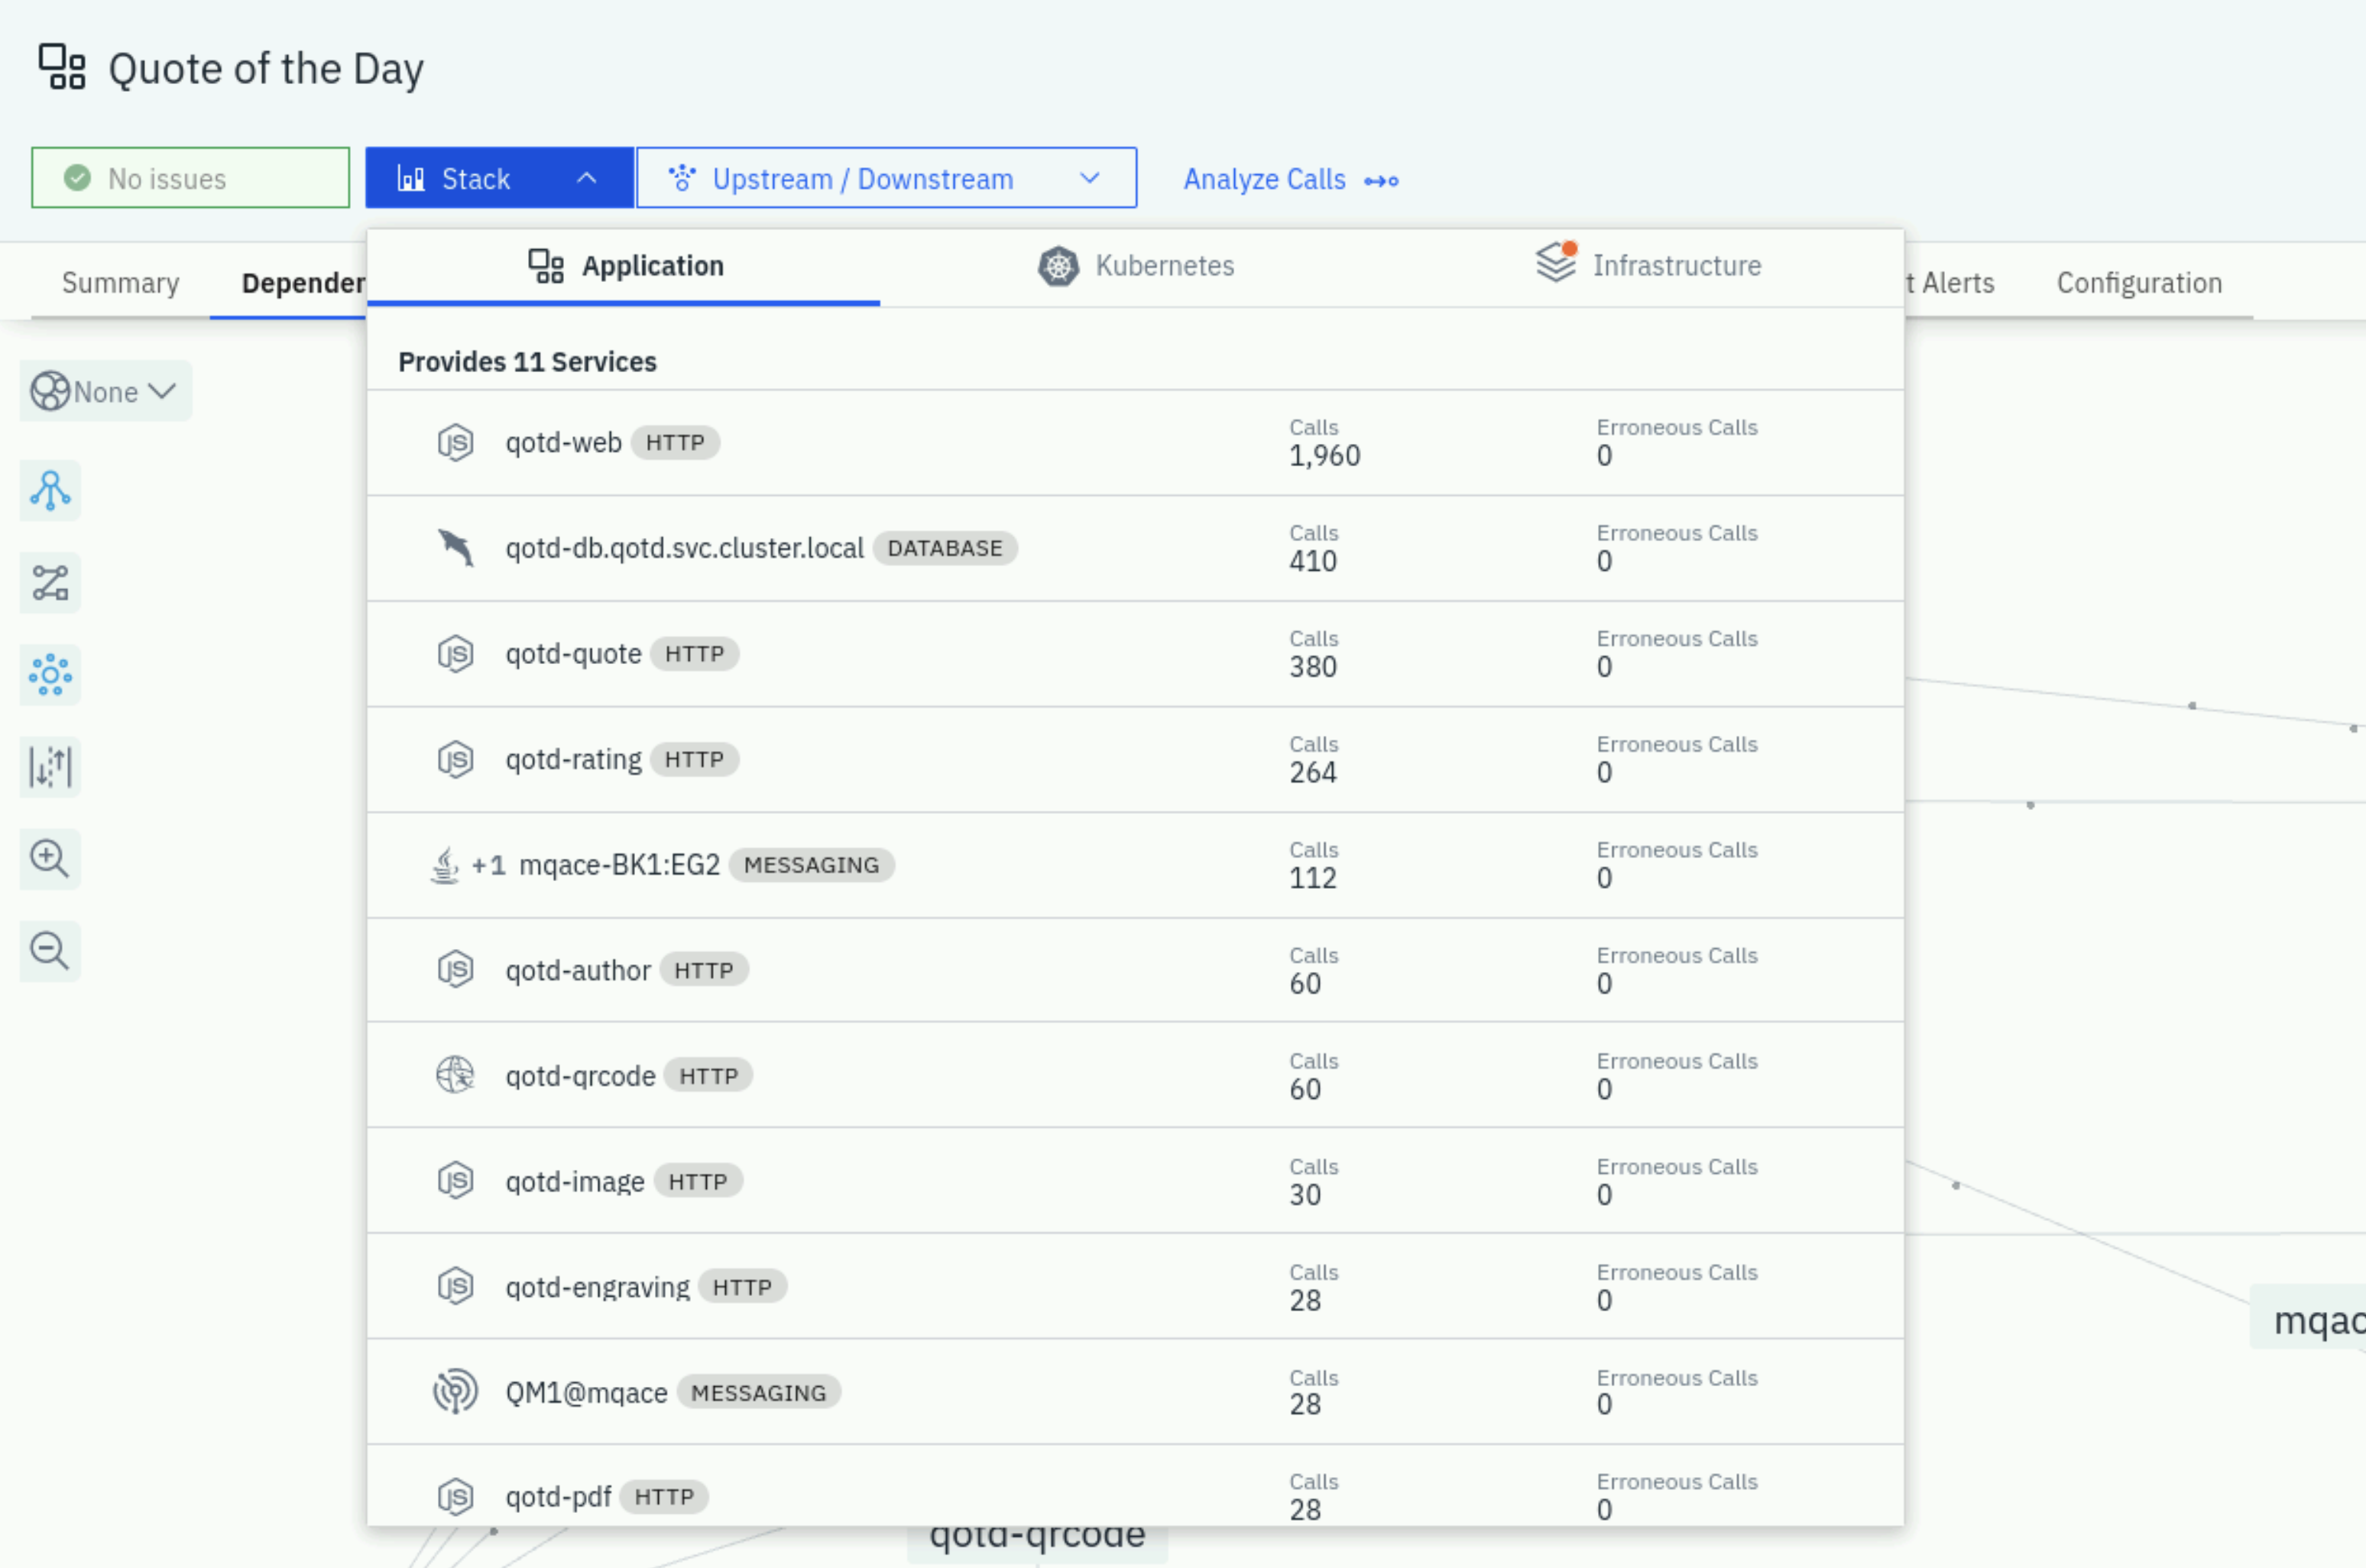
All of this contextual and relationship data helps you analyze and debug your applications to get to the root cause as quickly as possible. In addition, Instana's built analytics uses this data to automatically group multiple related Events into a single Incident for diagnosis.
Close the Stack dialog by either clicking on the Stack button or somewhere else on the background of the Instana GUI.
There are a few other tabs on this screen that you can explore on your own.
Click on the Services tab
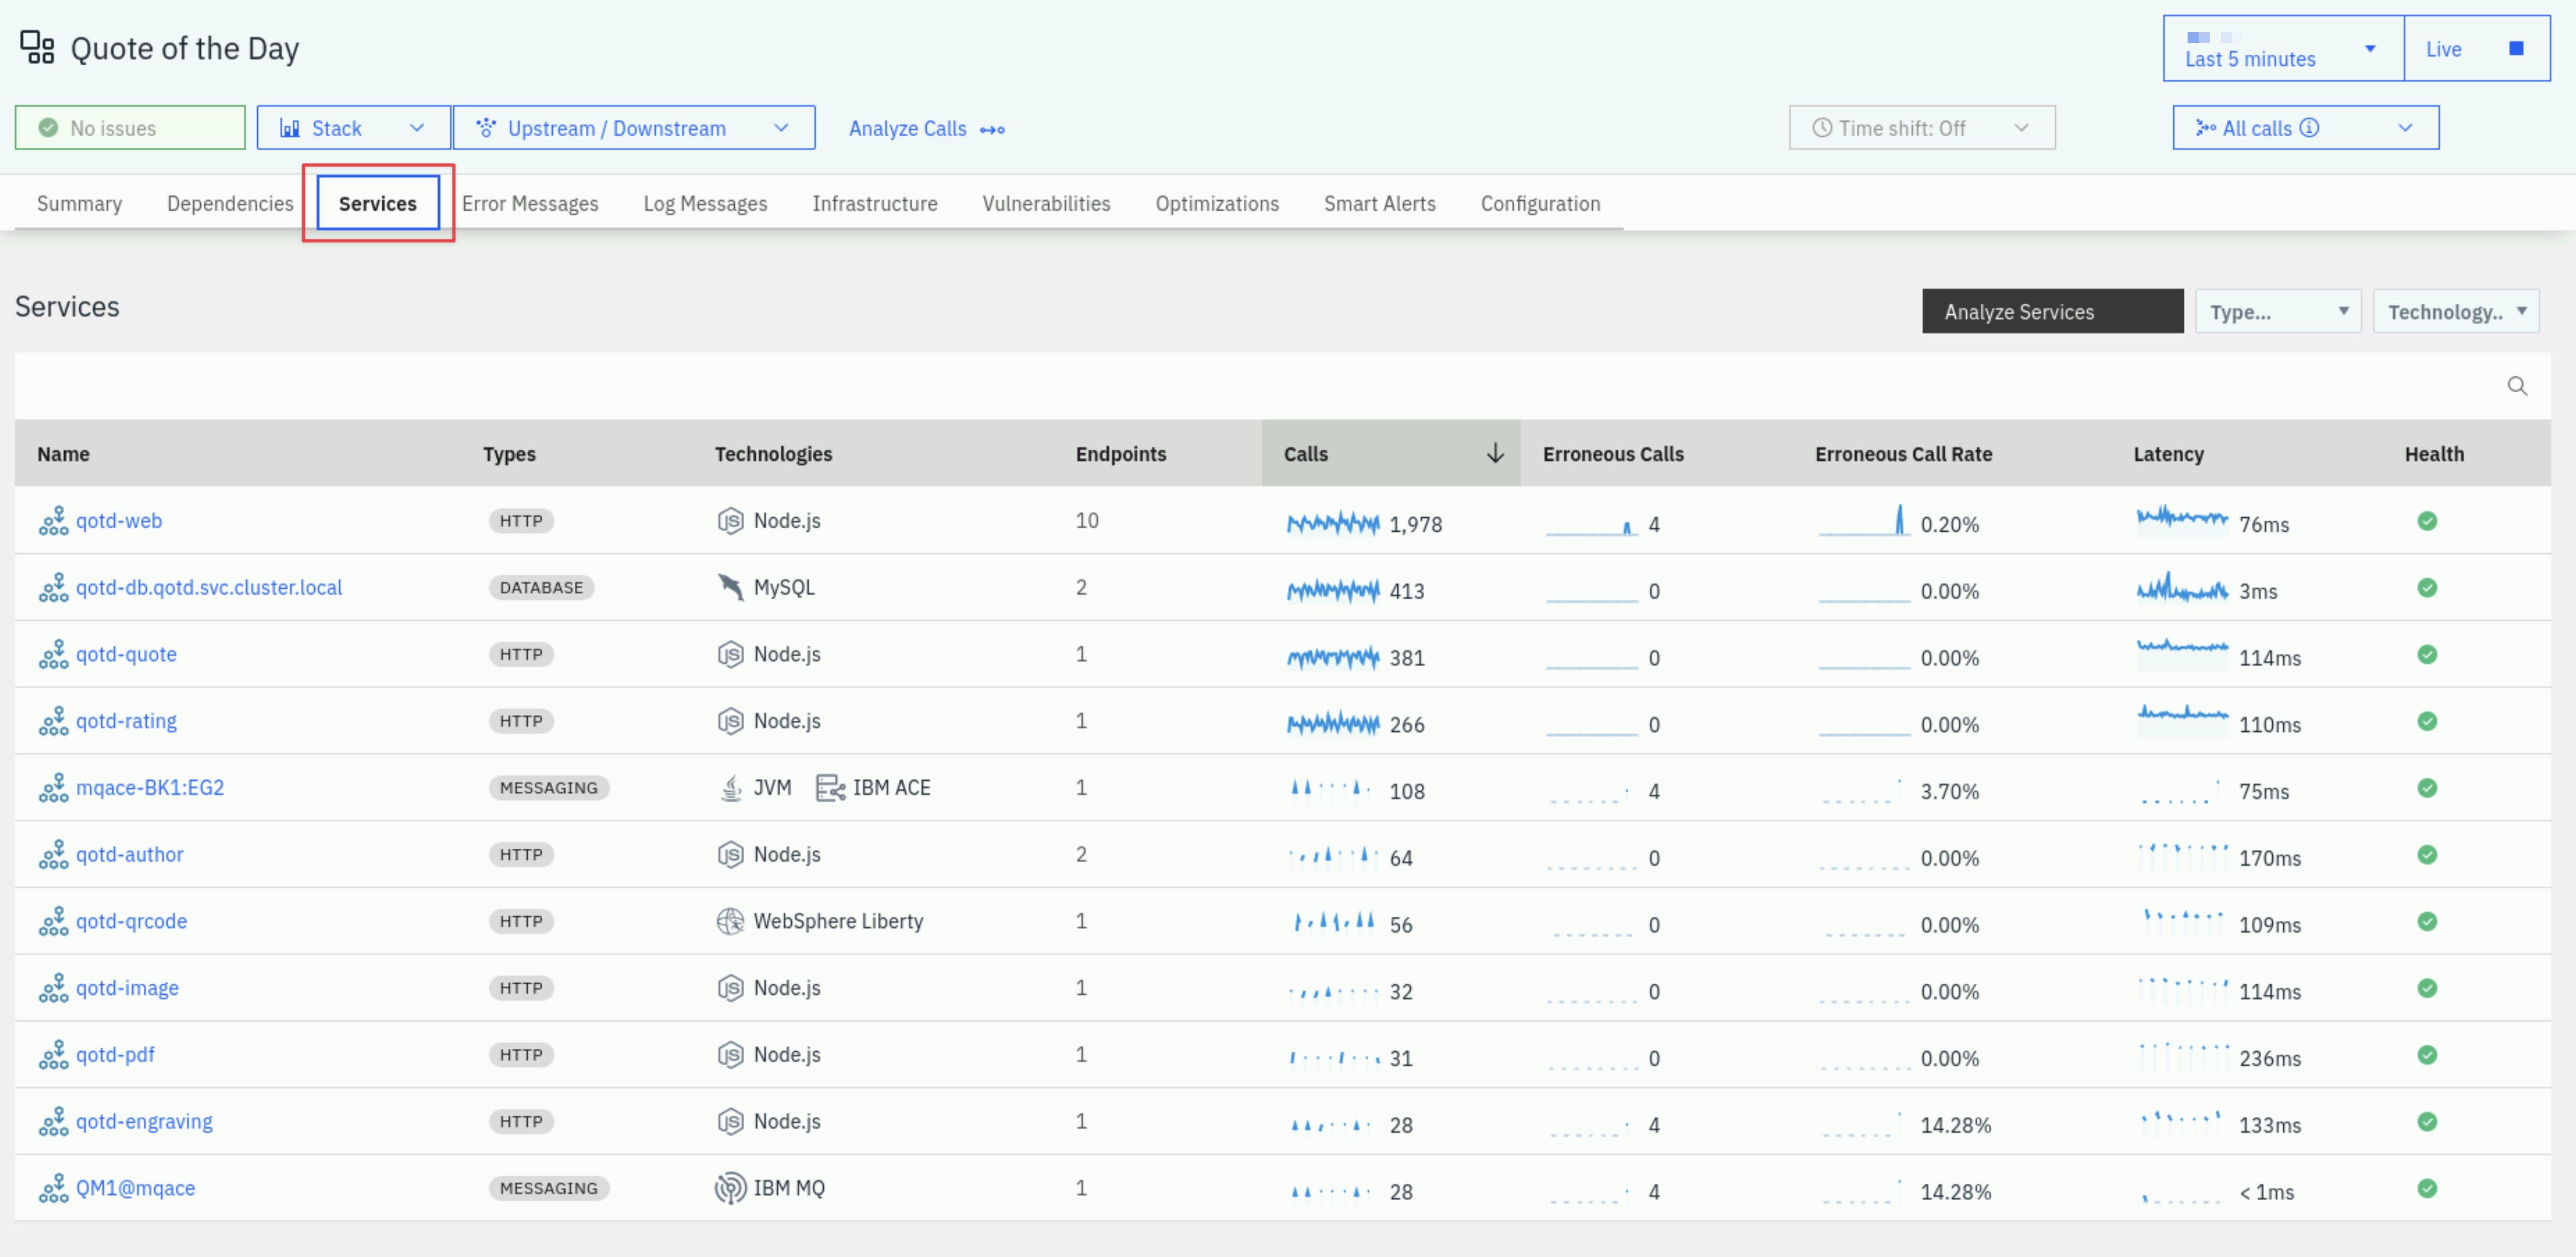
You will see a list of services that make up the application.
Click on the qotd-engraving link on the left Column. The qotd-engraving service is the service that calls the ACE flow and then puts a message on the MQ queue. We want to explore this service in more detail.
You should see a page showing the transactional data filtered down to just the qotd-engraving service.
Click on the Analyze Calls button to analyze the individual transactions that are executing within the qotd-engraving service.

This will take you to a screen showing all of the different types of calls taking place within the qotd-engraving service. At the top, there is a summary of all calls in terms of transaction rates, return codes, erroneous calls, and latency.
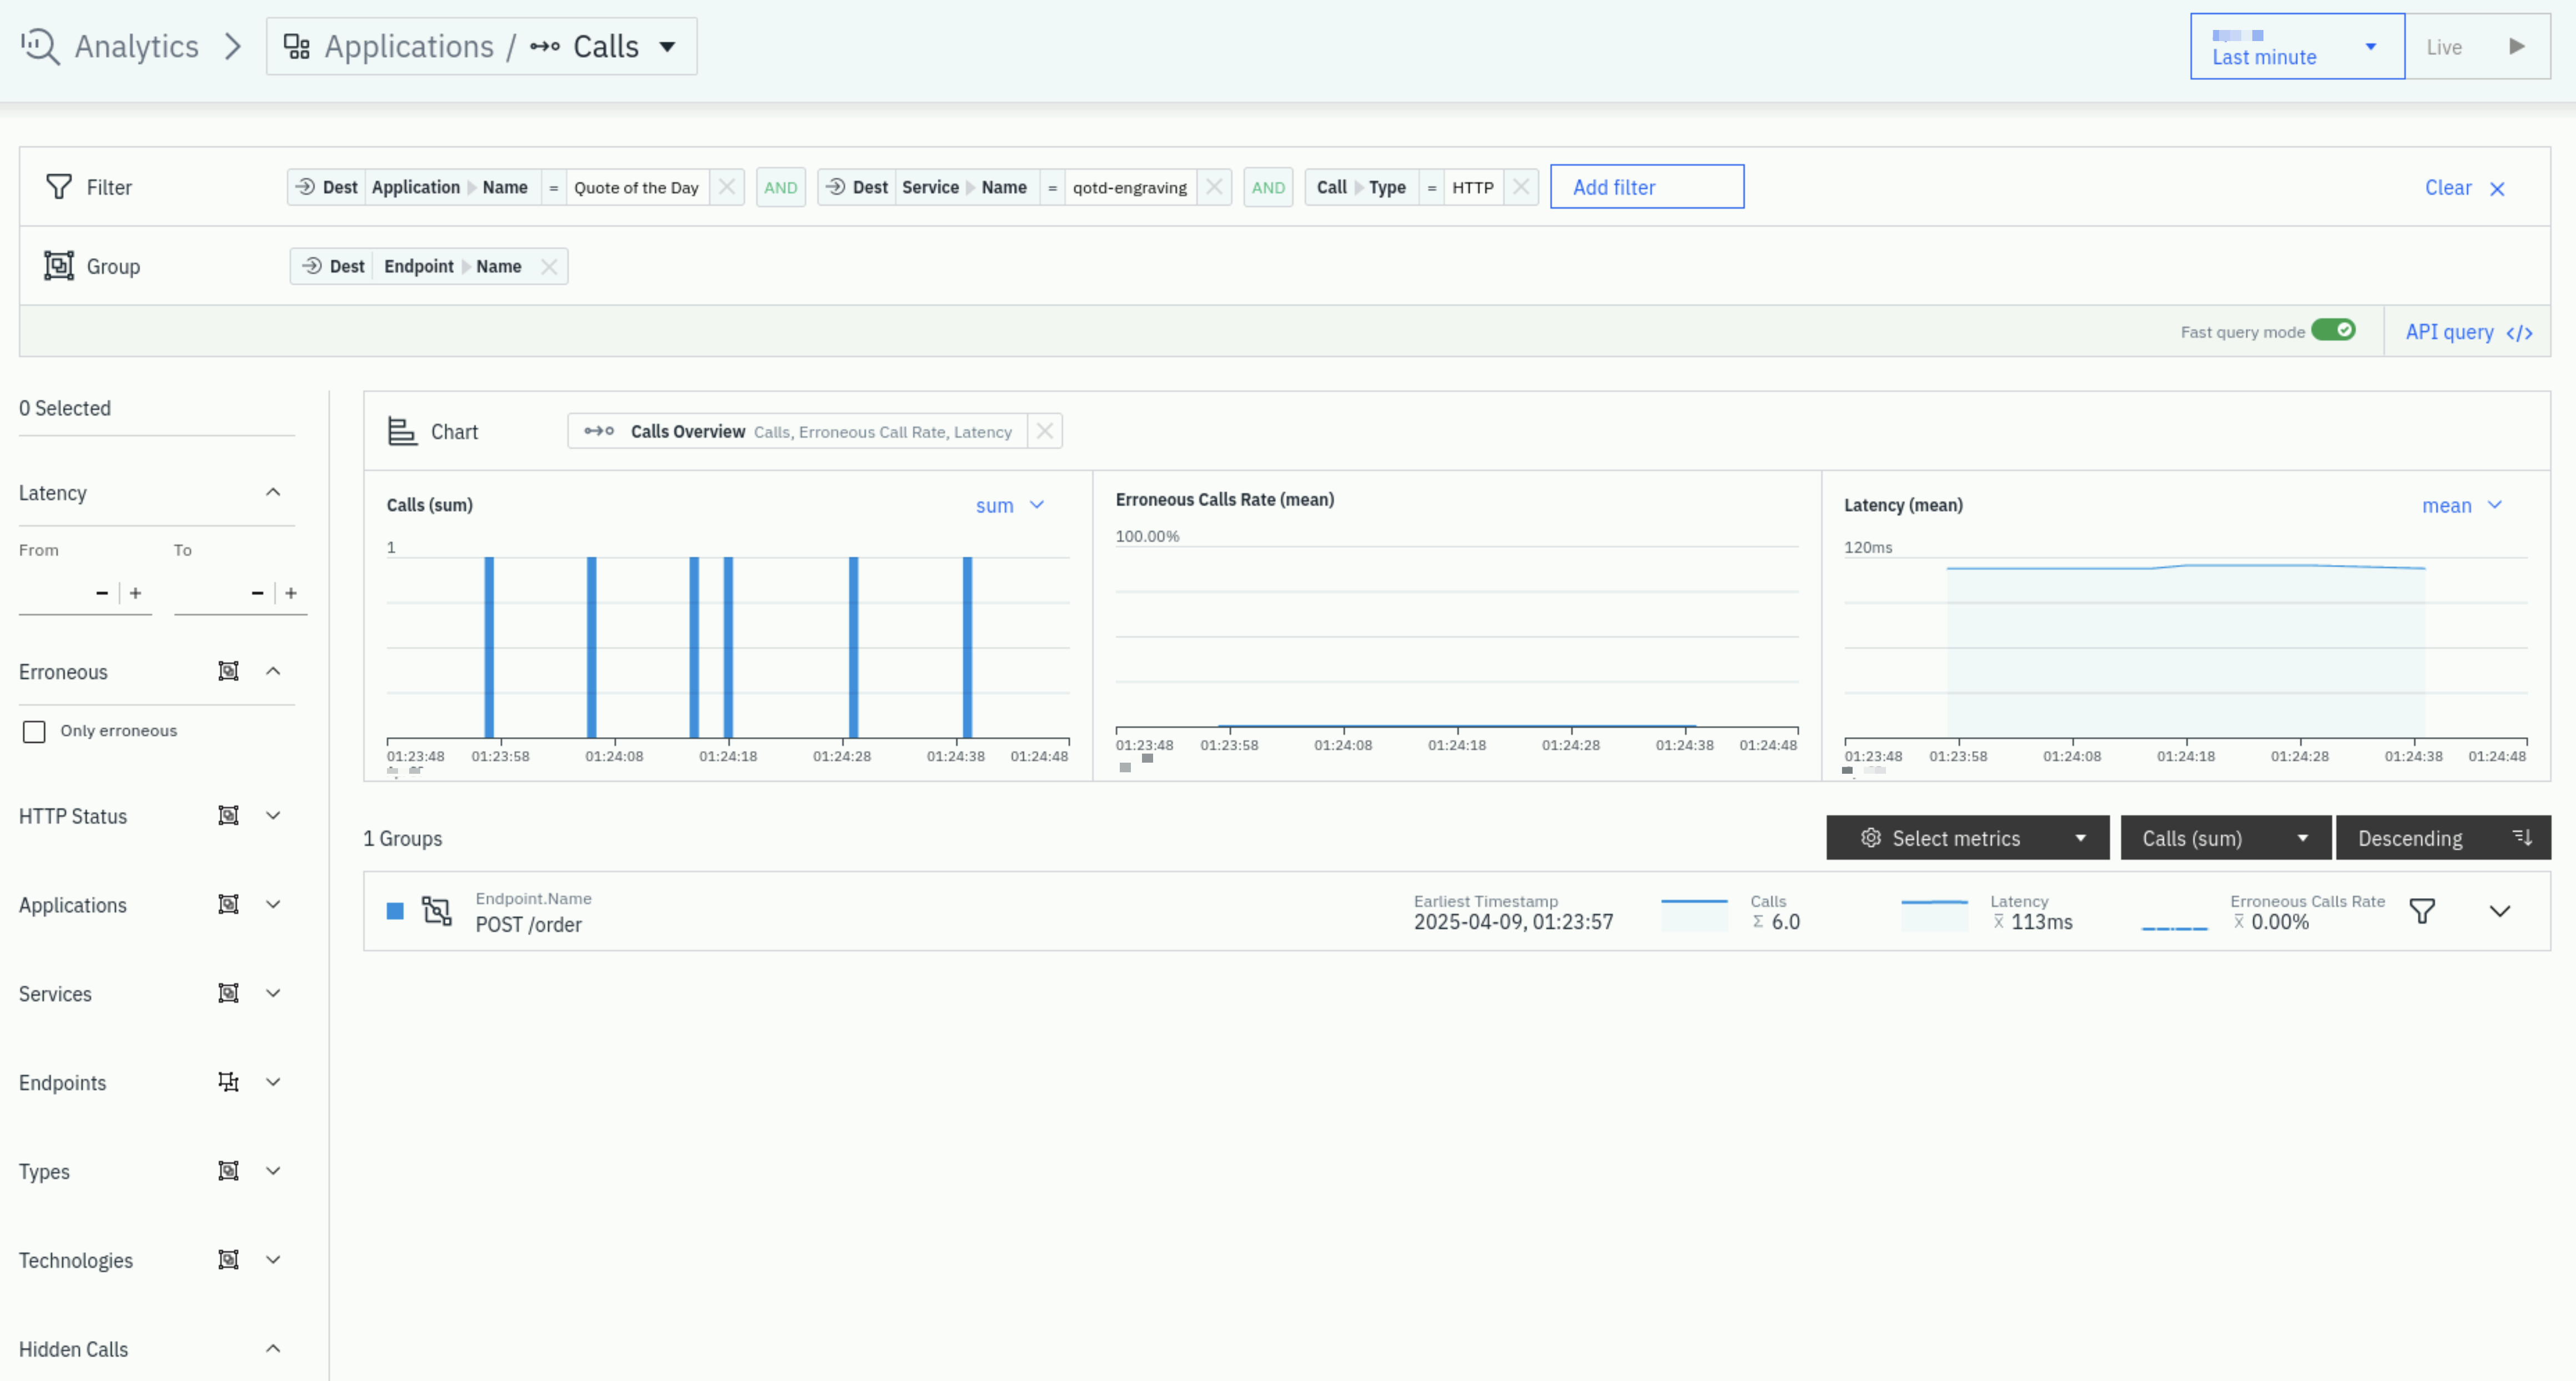
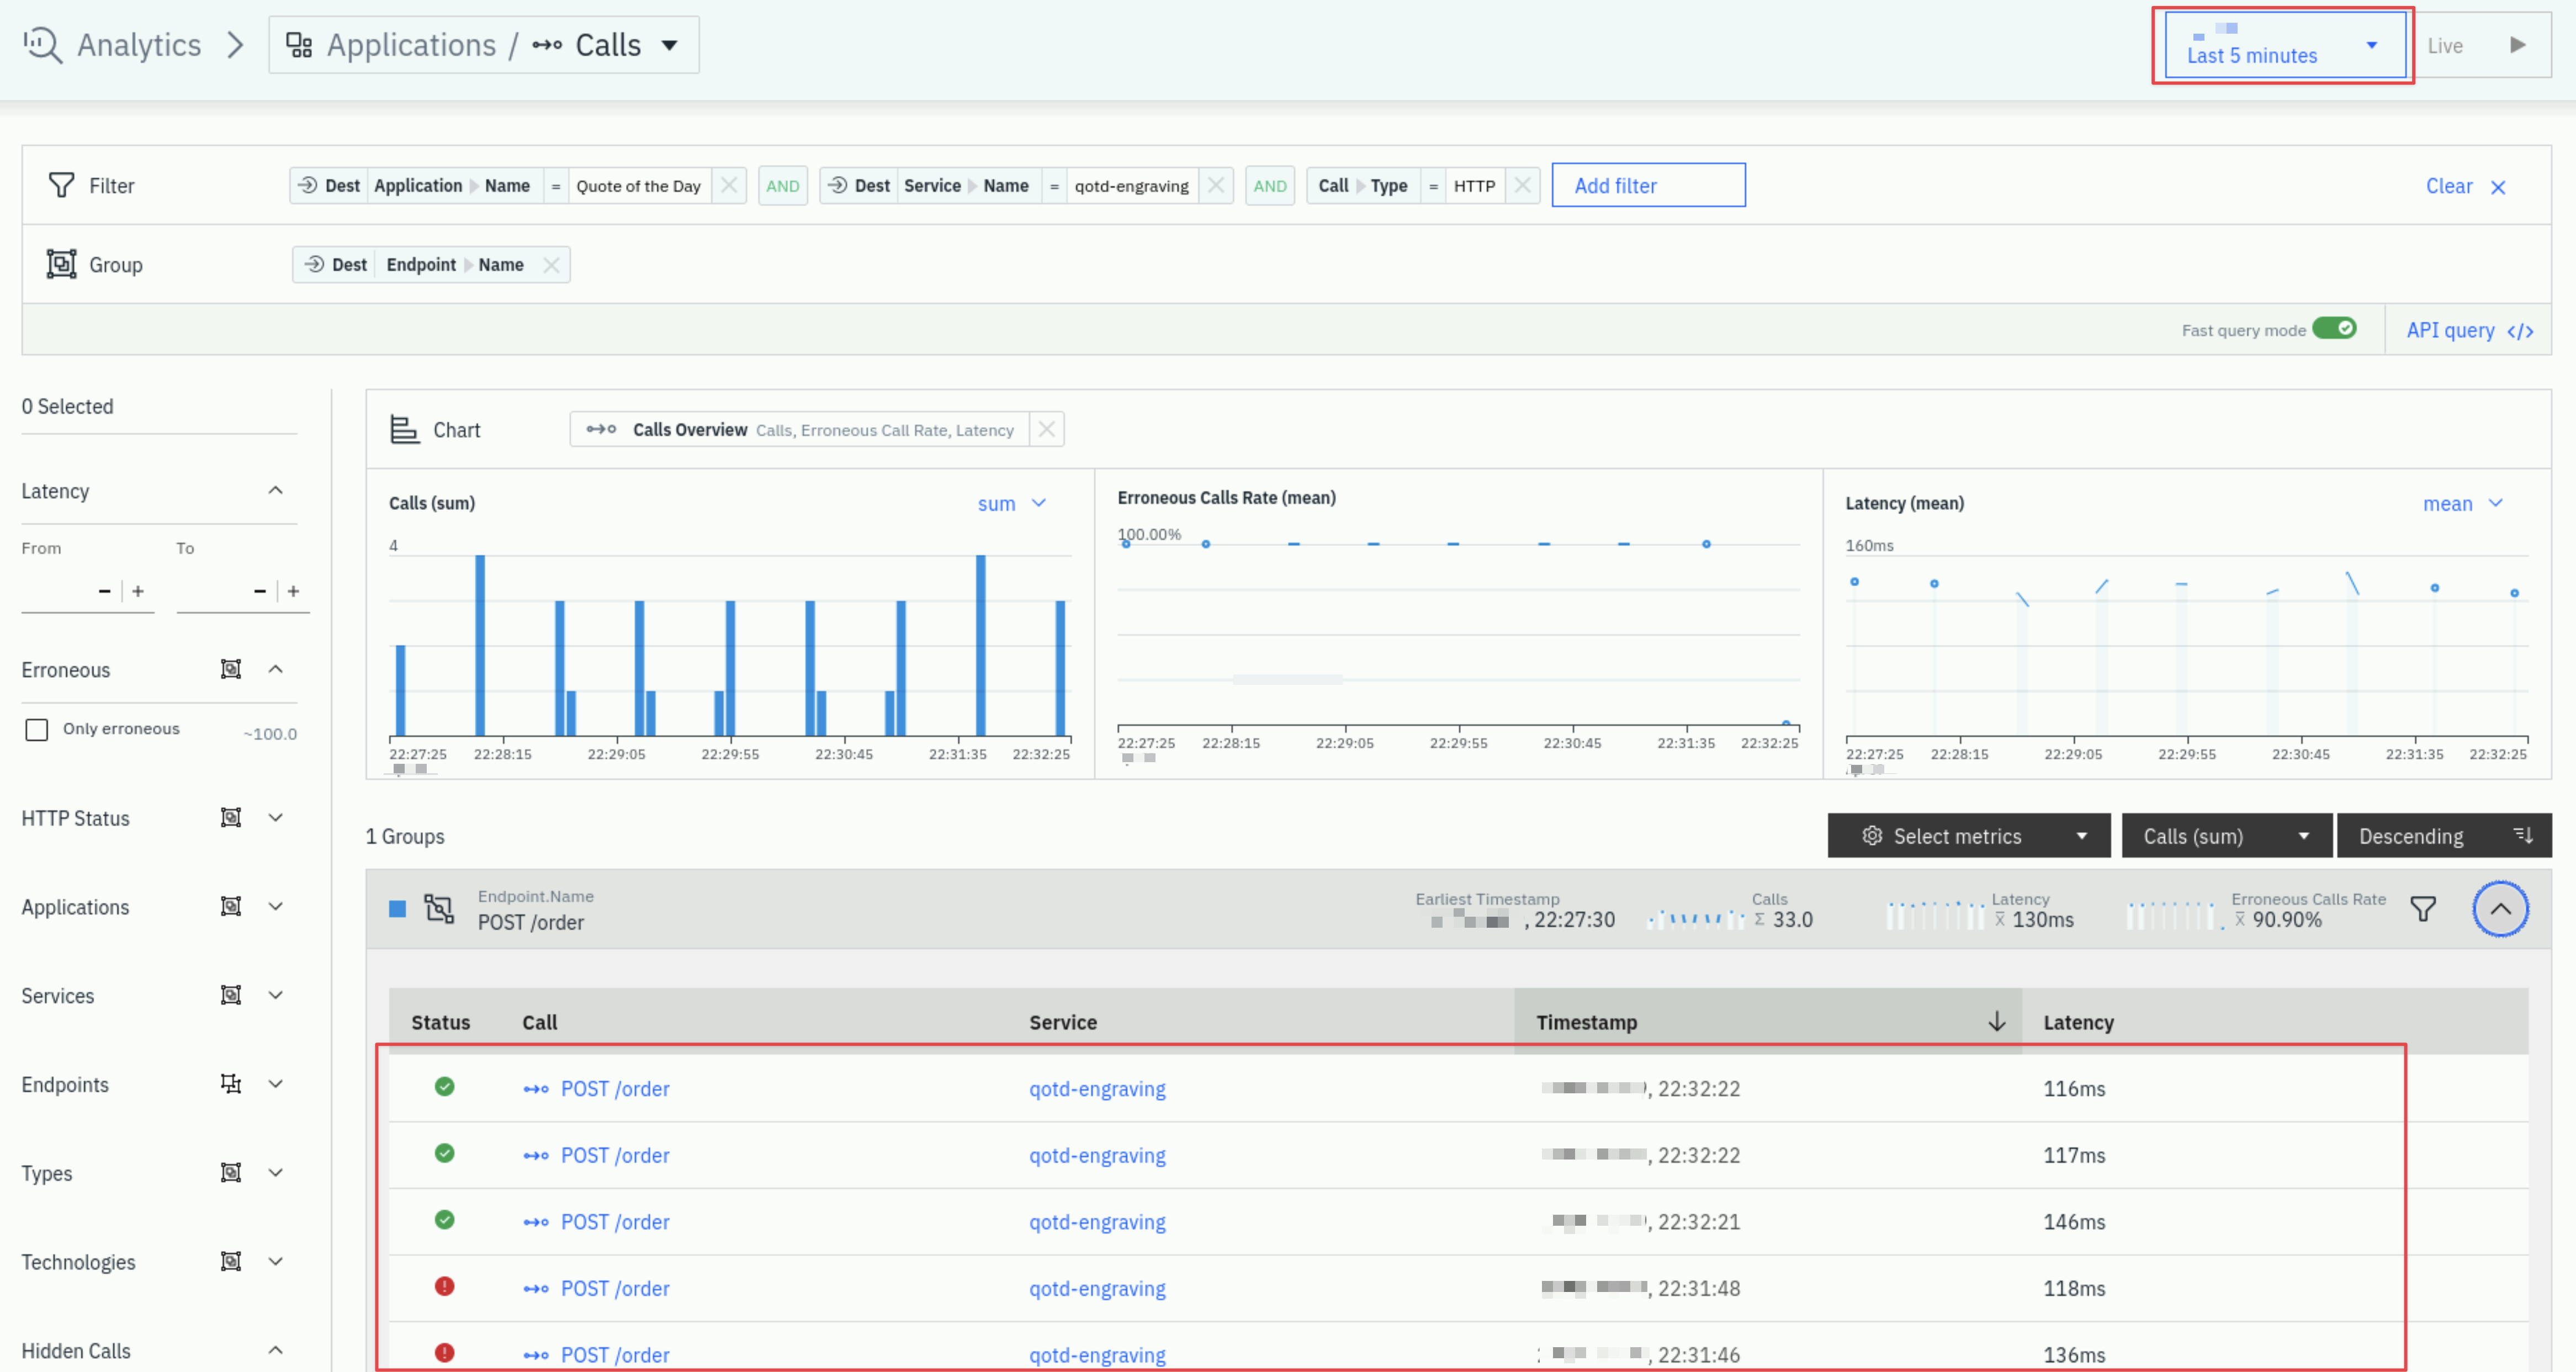
On the right side, click the arrow to expand the list of qotd-engraving "POST /order" calls. Instana is capturing 100% of the transactions so that you don't miss intermittent problems that might be occurring in the environment.
The QOTD application simulates failure events randomly. If you only see red "Contains Errors" status call you can either wait until the successful calls start again or adjust the view time at the top right of the page to display some successful calls.
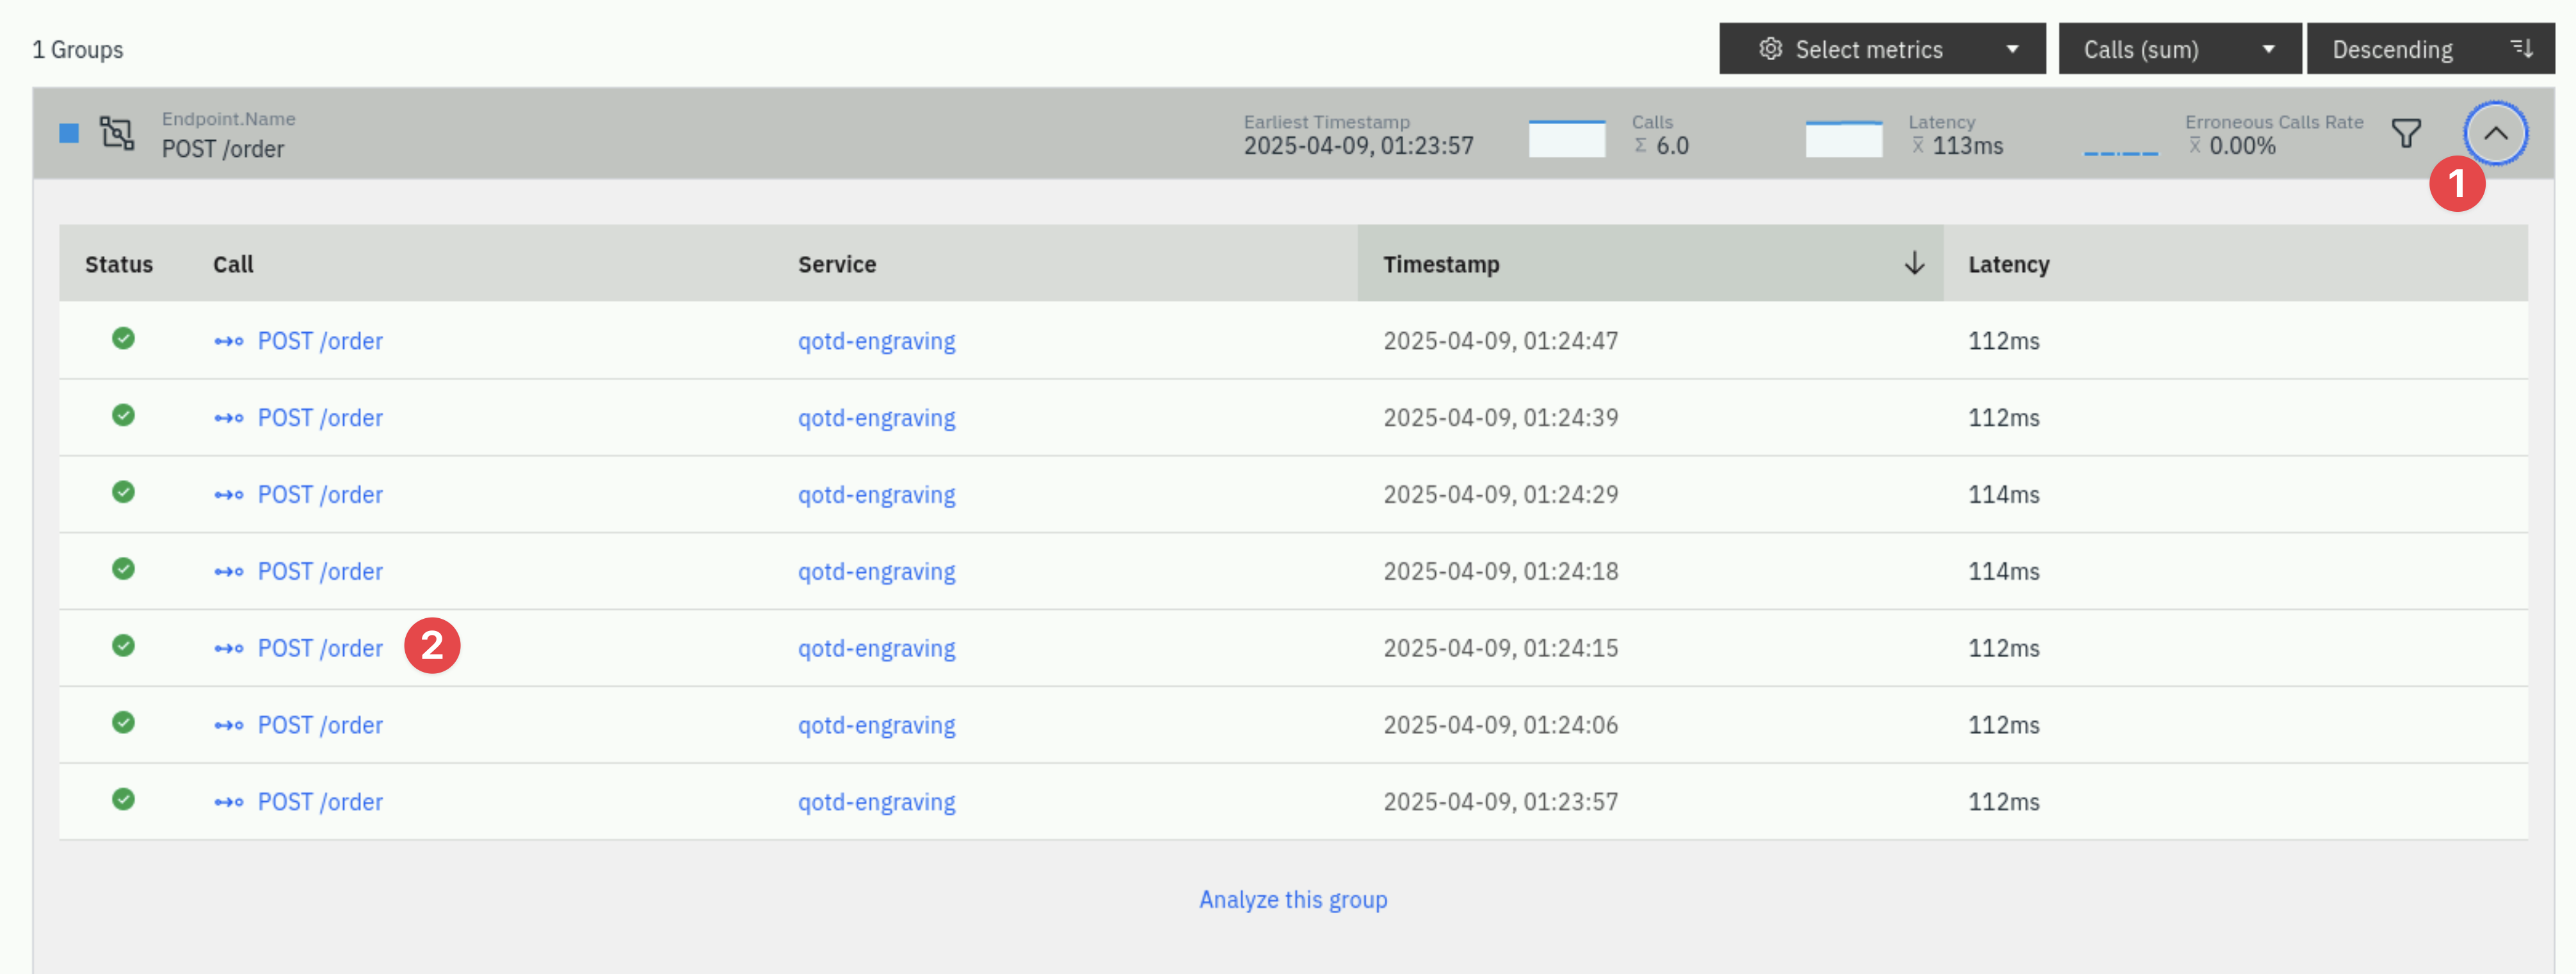
Select one of the successful requests.
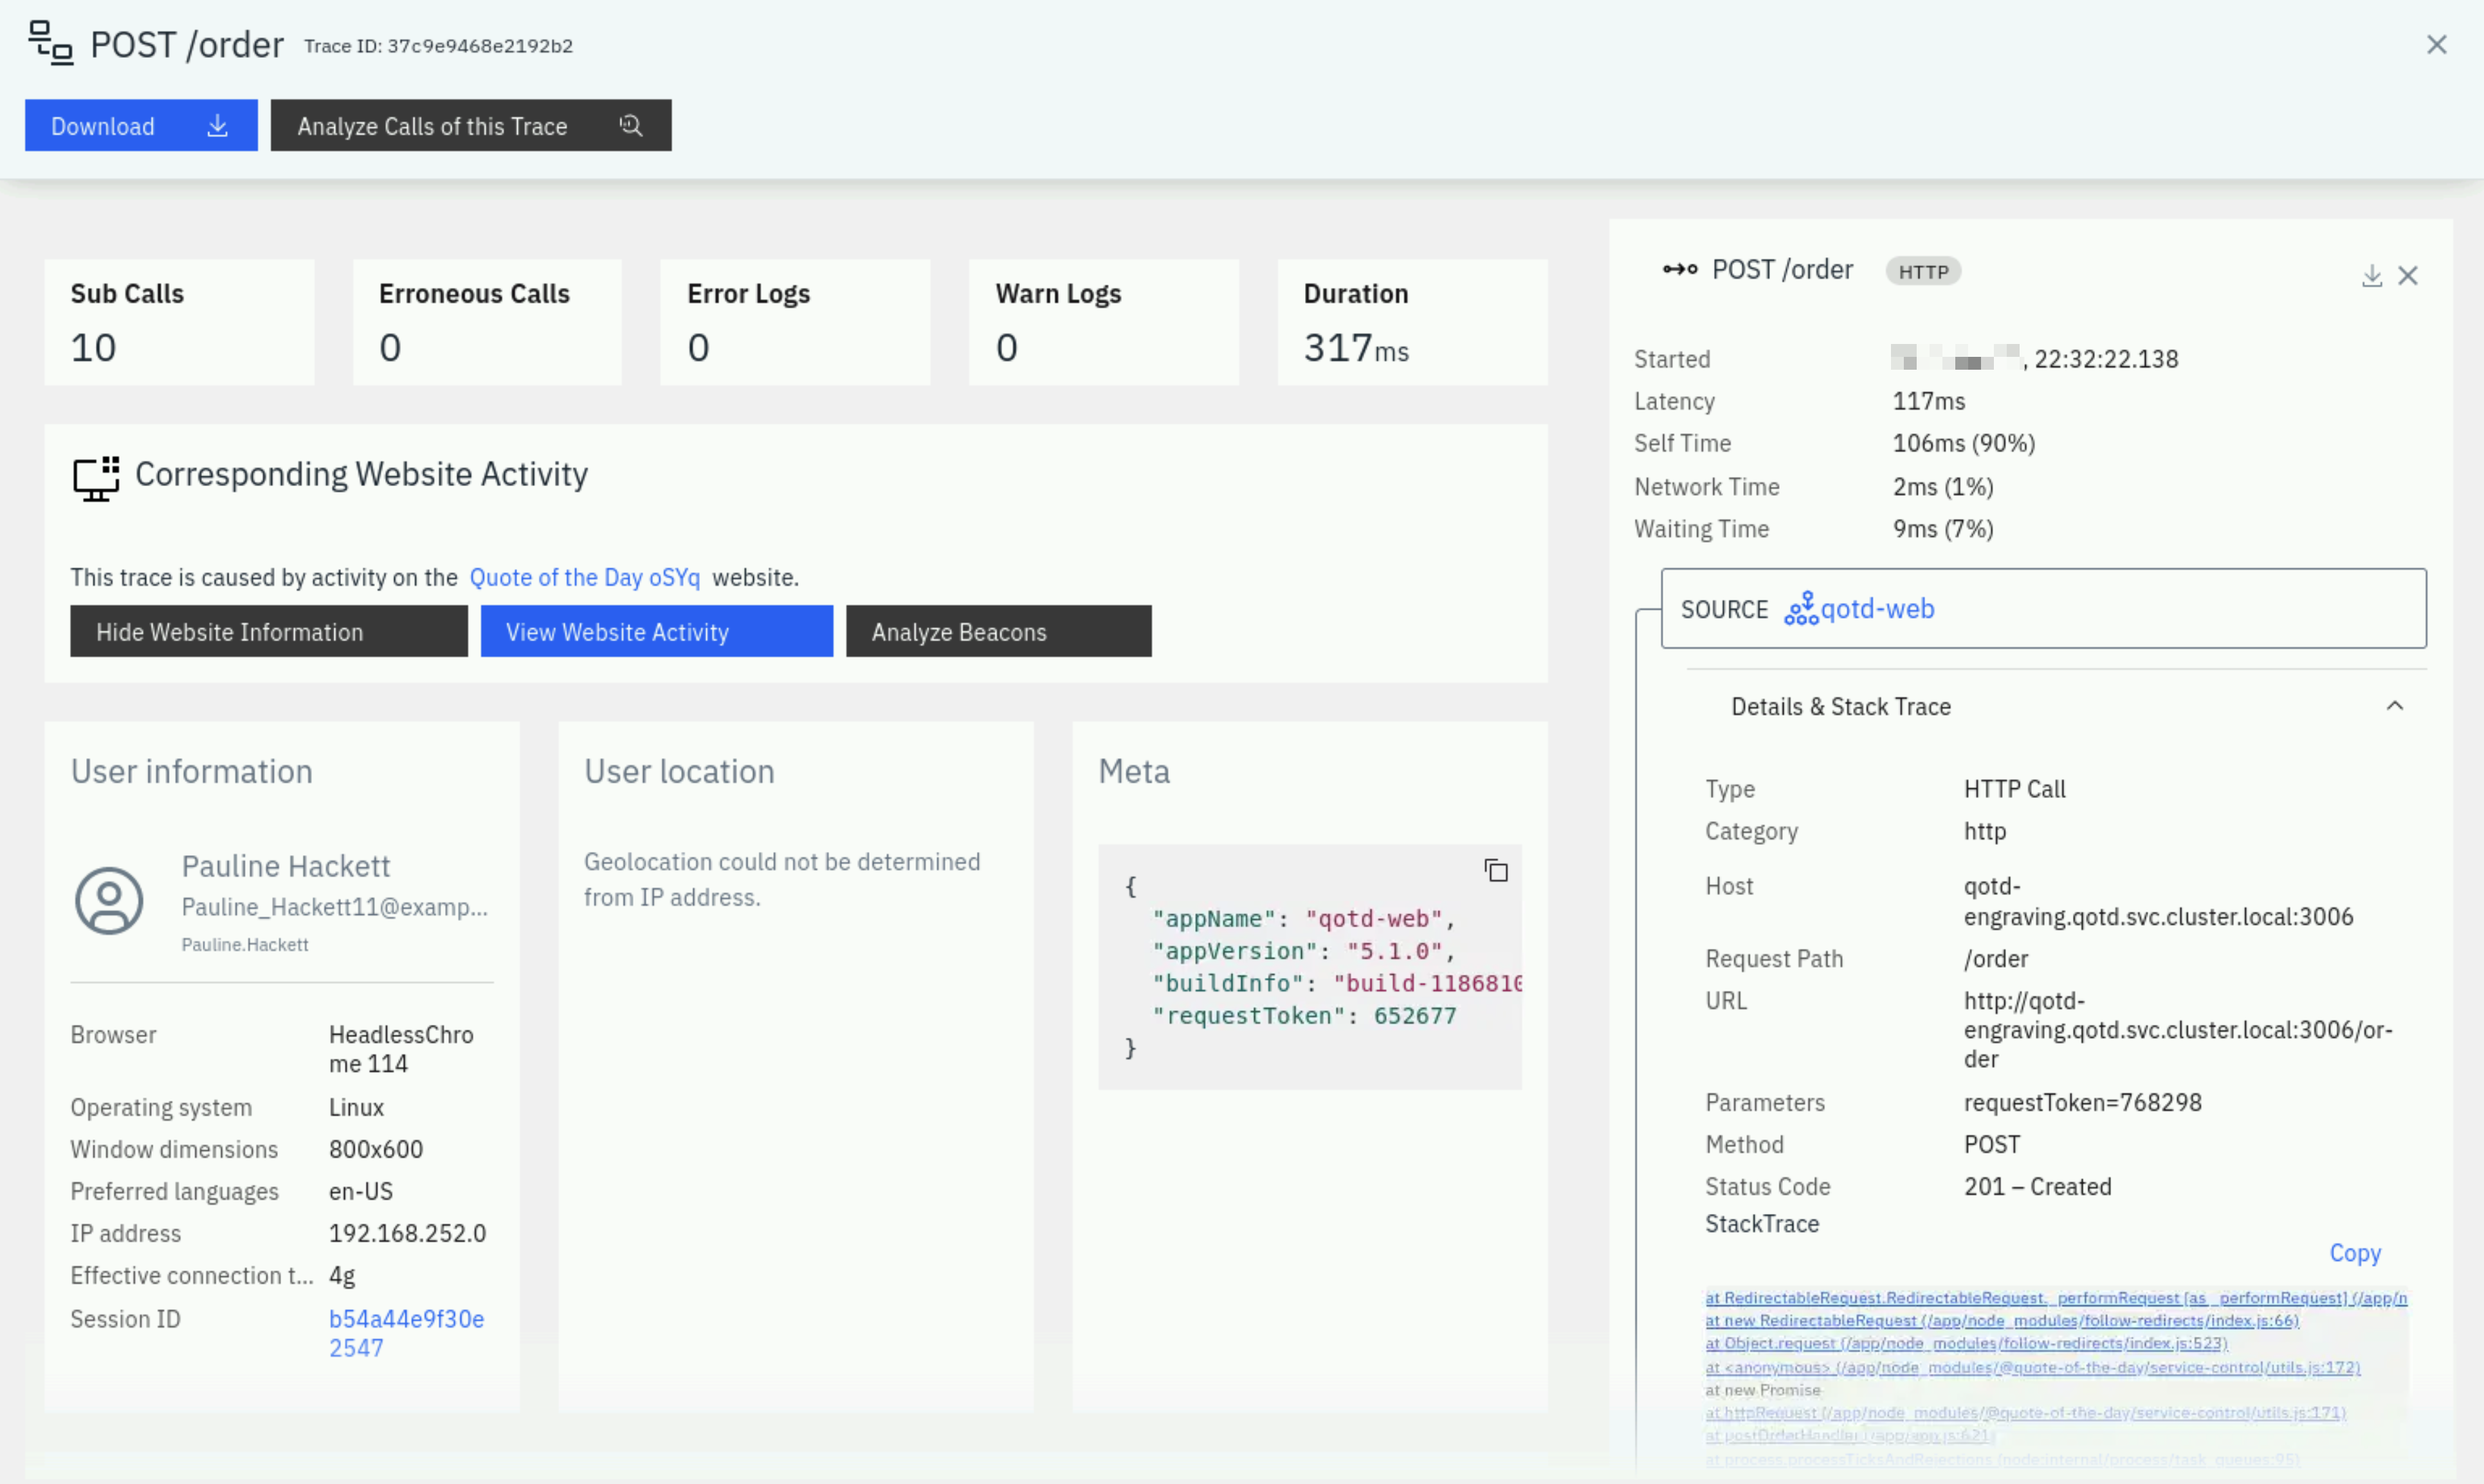
You are now looking at the tracing data for a single transaction. At the top of the screen, you will see a summary of the latency, sub-calls and timeline. On the right side of the screen, you'll see the details and stack trace.
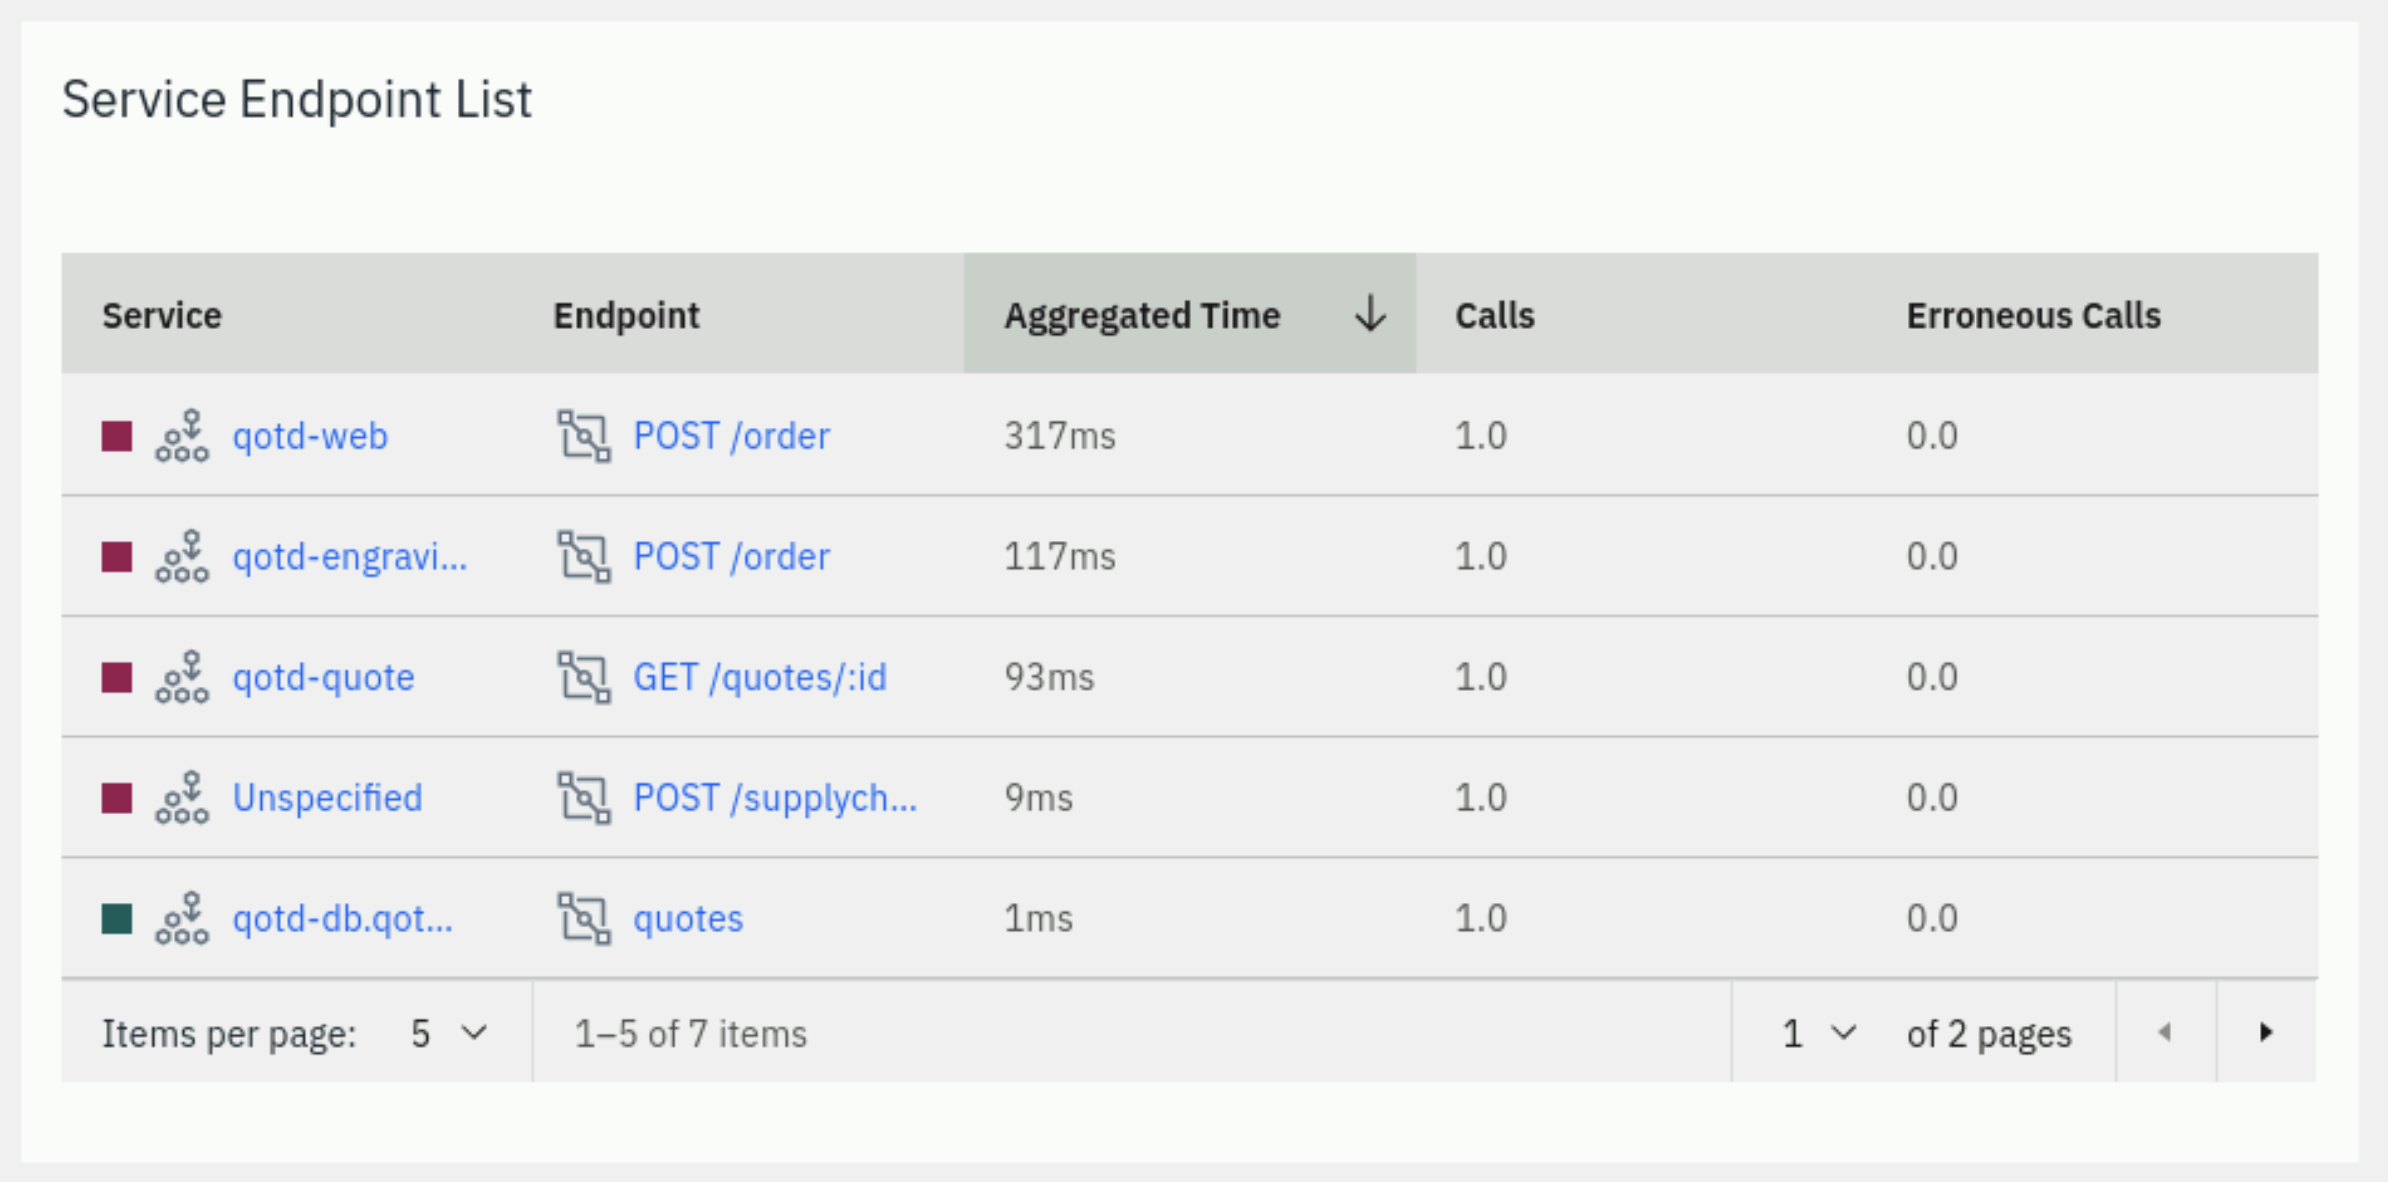
Scroll to the bottom of the screen and you will see the service endpoint list
Scroll back up and you will see a detailed call stack Calls. The call stack gives you the timing and sequence of the call going through the application.
If errors were captured in the logs, they would be shown at the bottom of the screen, below the call stack.
If you select the text on the left or the timeline bar, the Details & Stack Trace context to the right of the page will change.
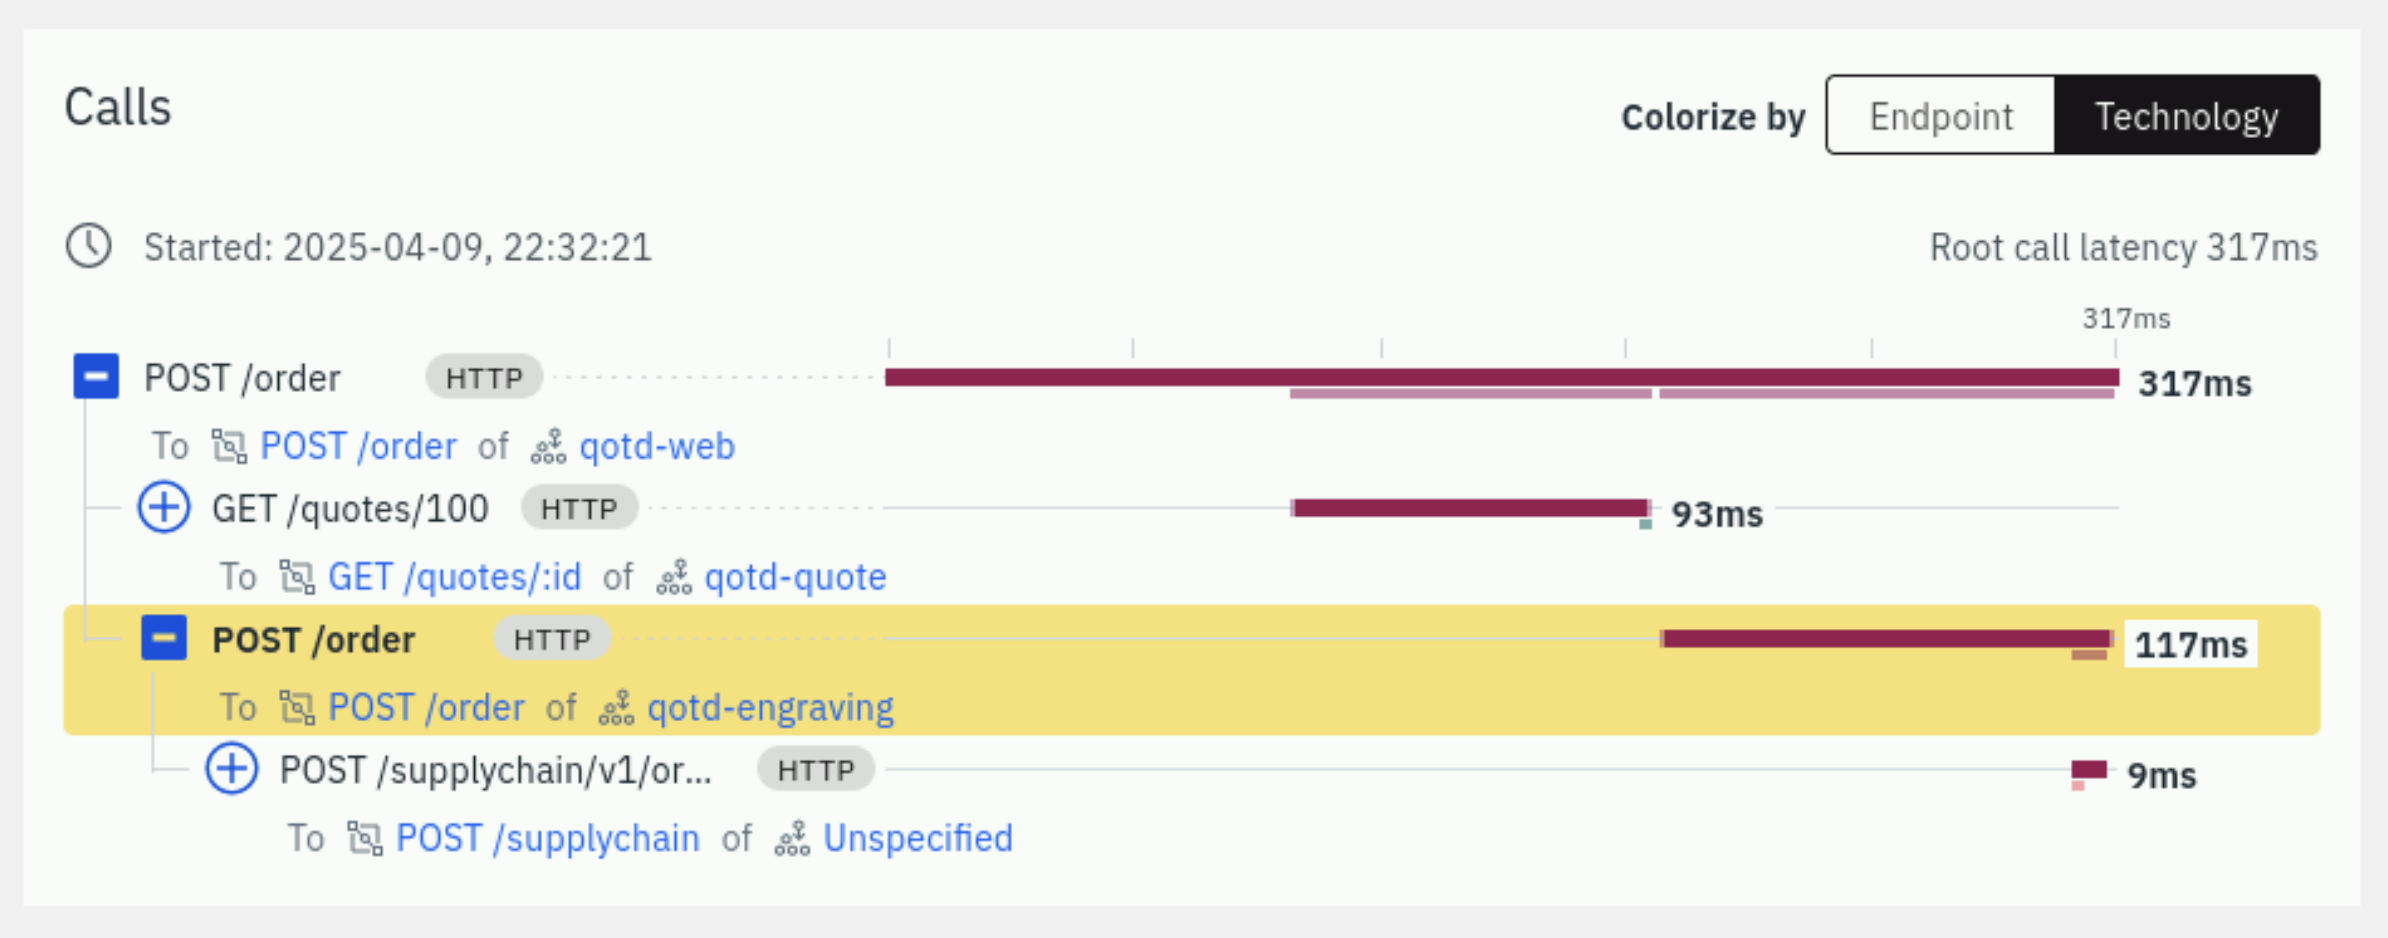
Explore the different types of calls going through this transaction by selecting the individual call. When you select an entry, examine the detailed information on the right.
When you select the Node.js App Server requests, you'll see the StackTrace on the right hand side. Within the StackTrace, click one of the URLs.
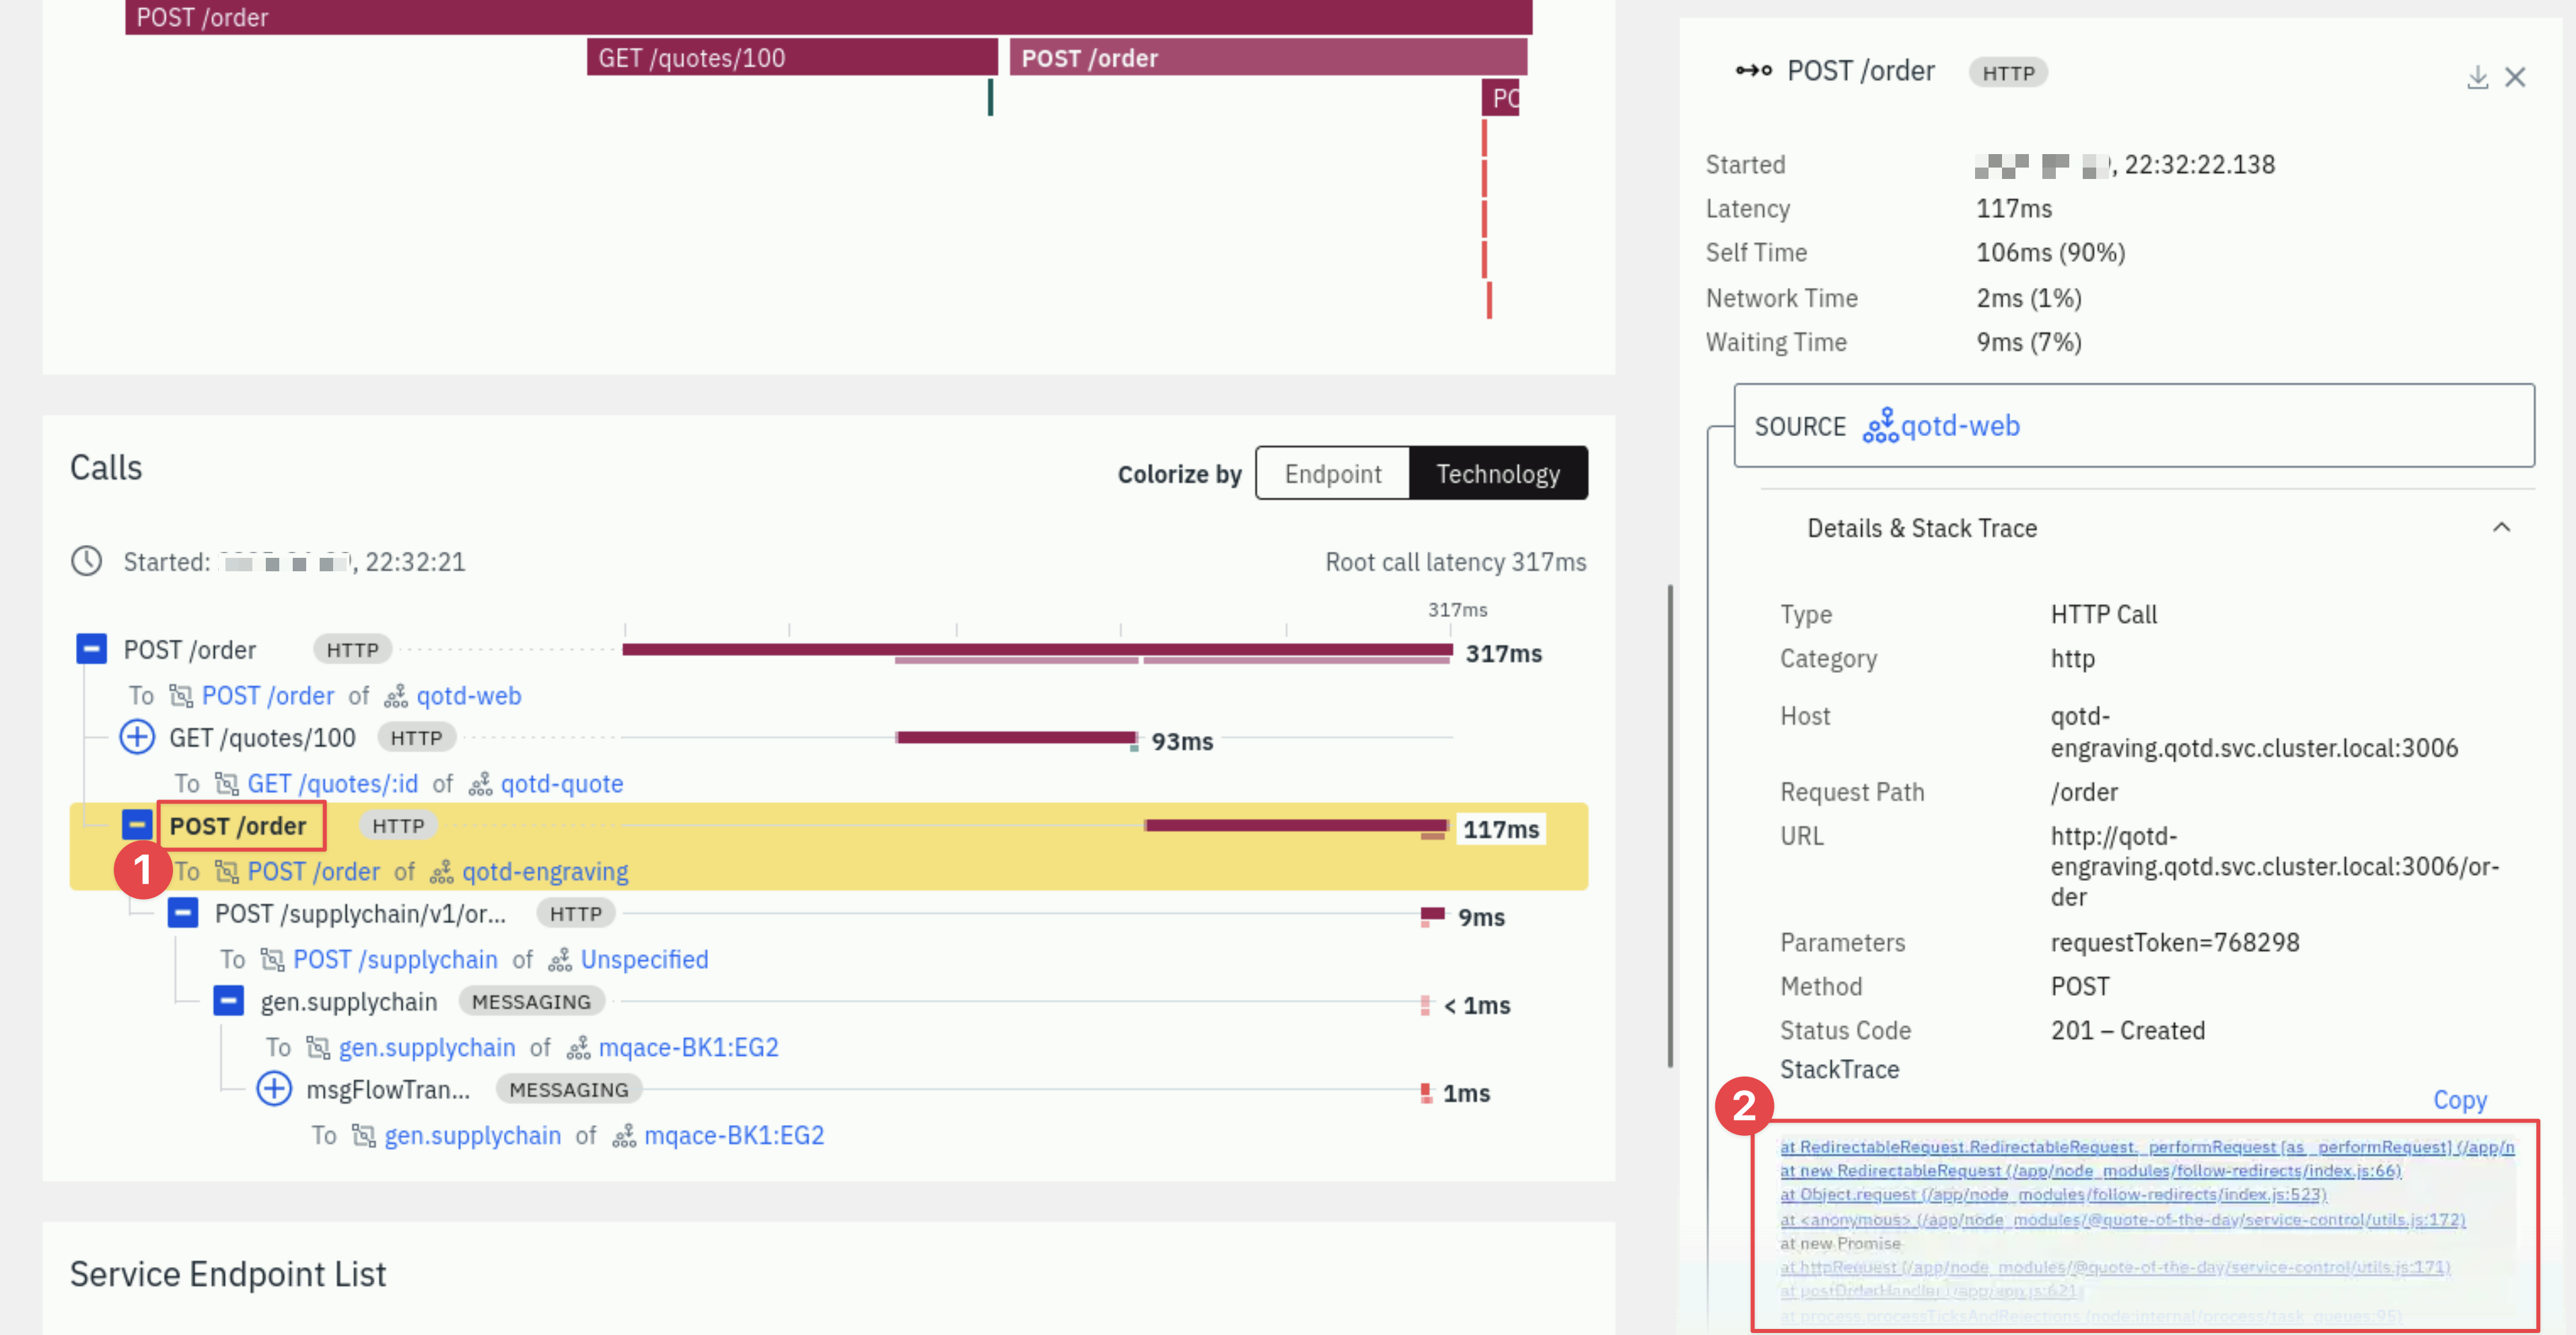
When you click on the link, Instana will decompile the code and show you the lines of code. The exact line of code that is executing will be highlighted in yellow.
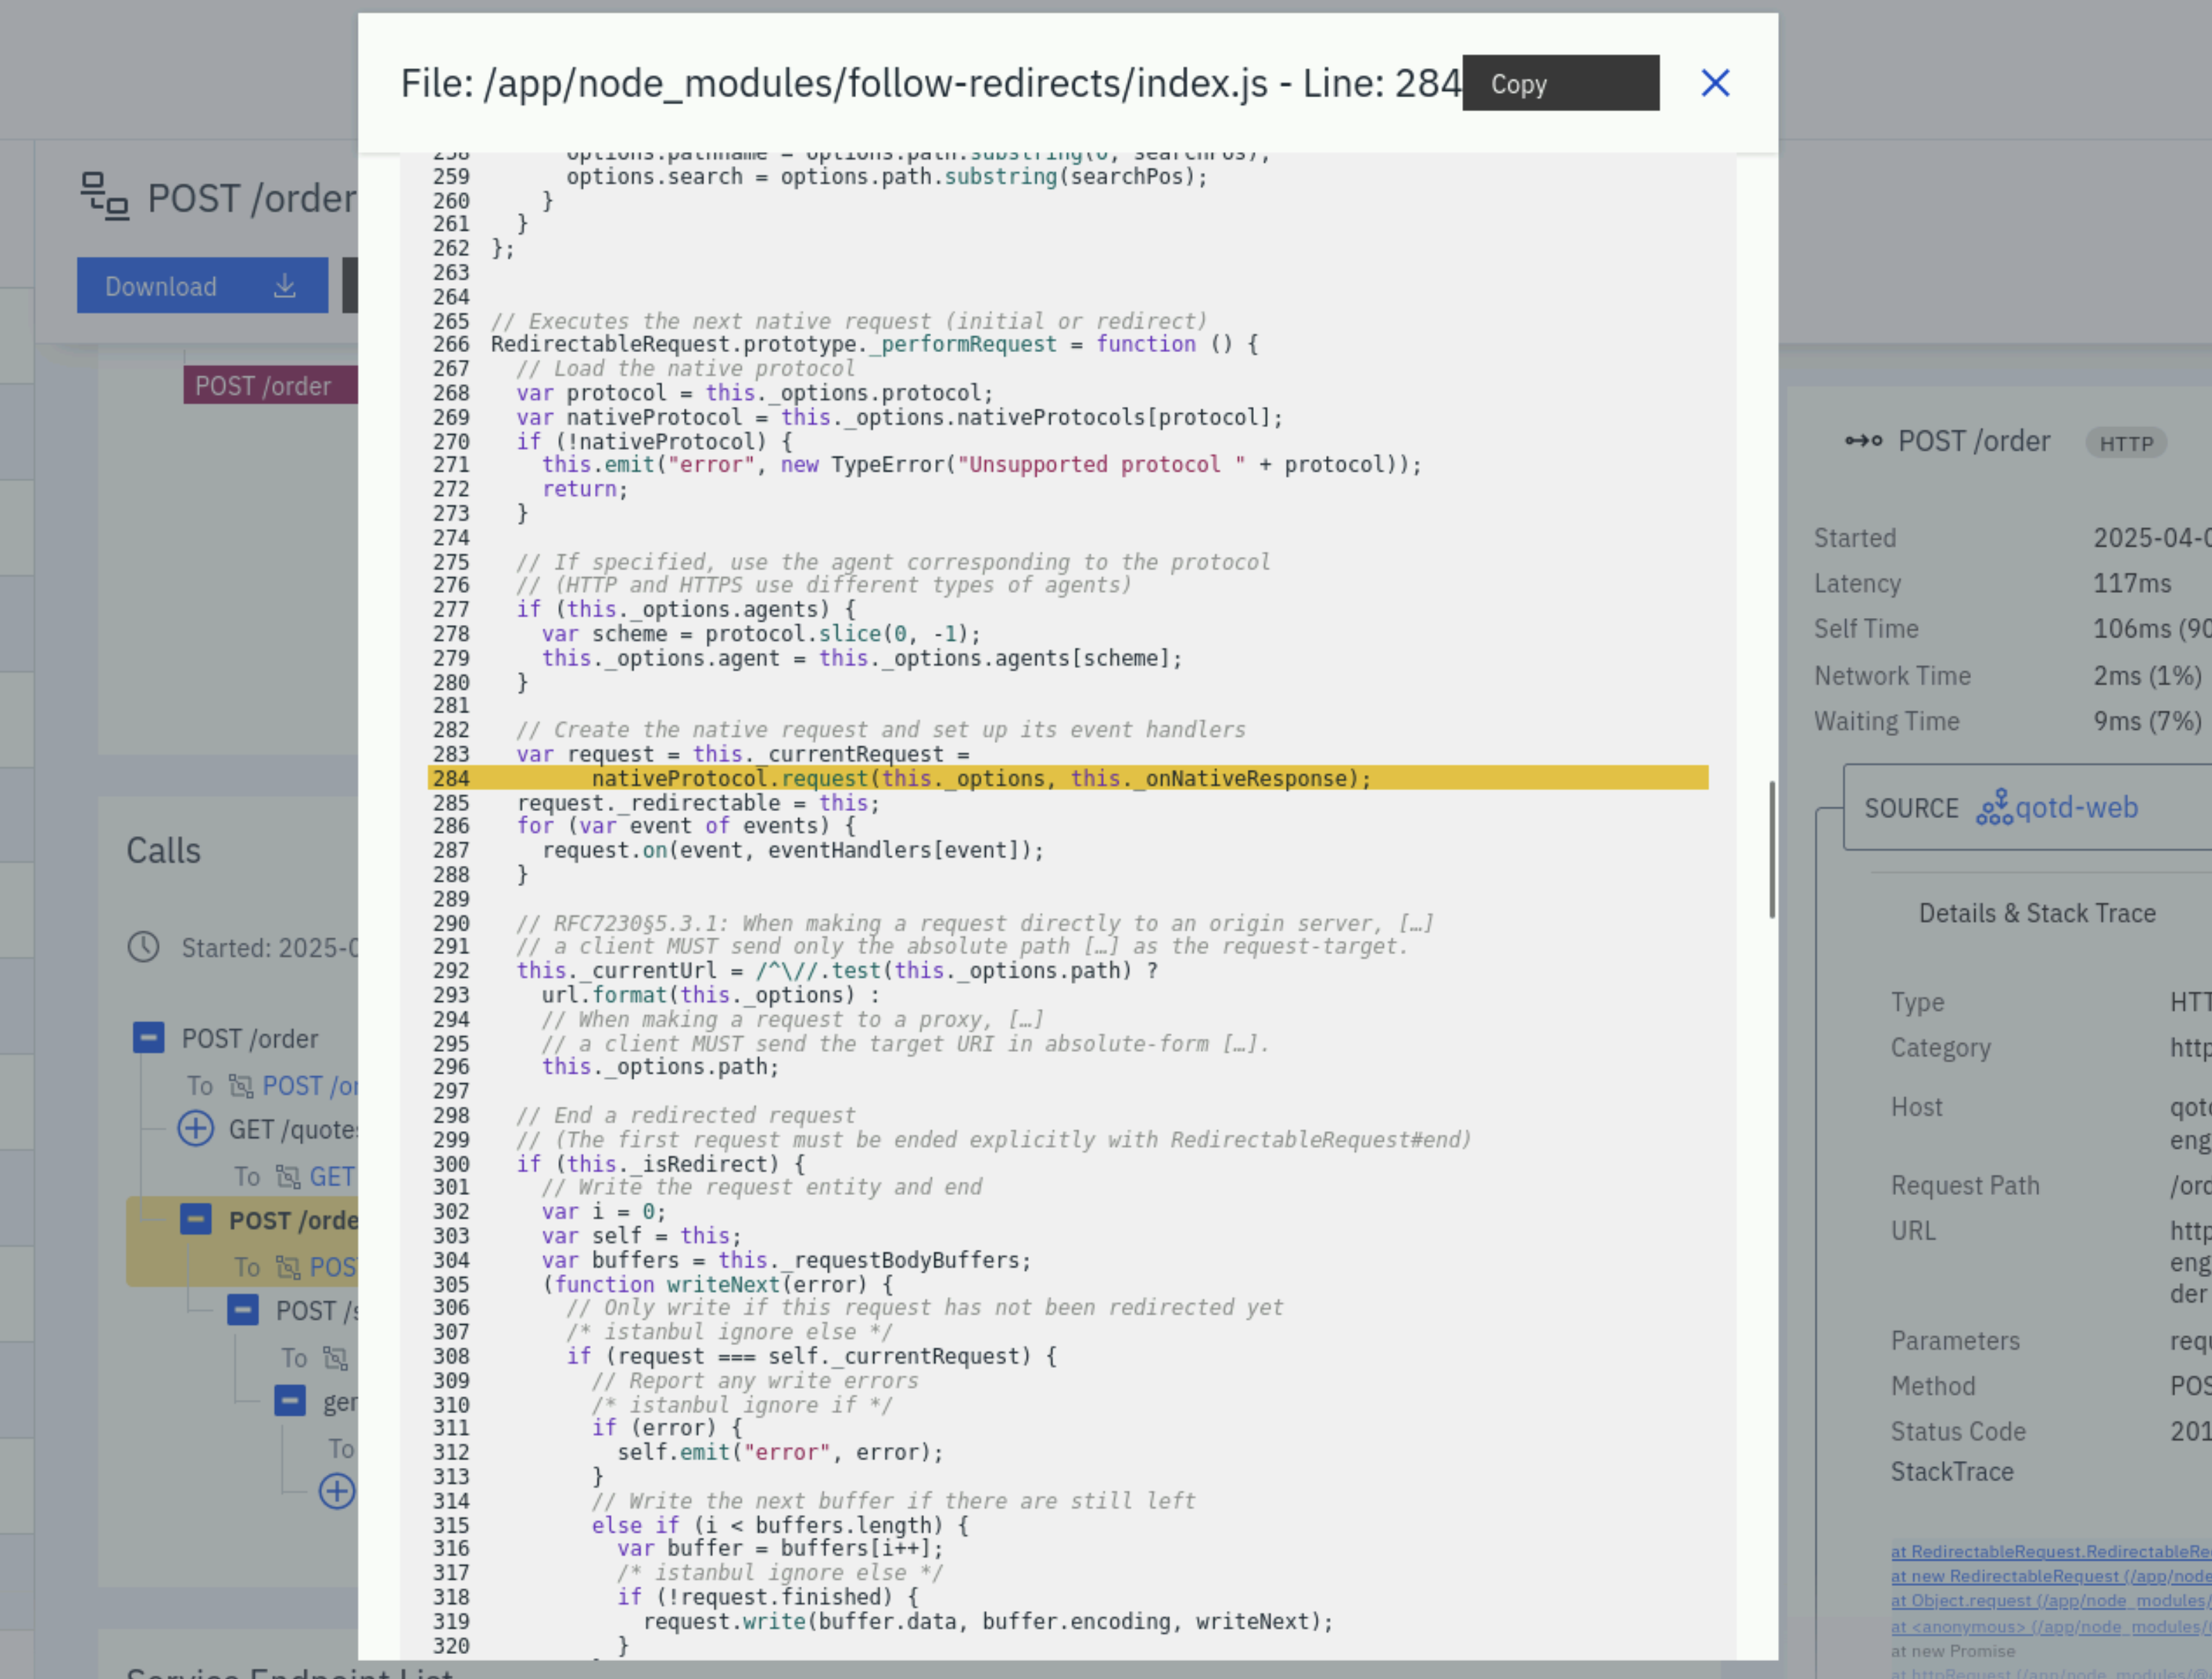
Click the X in the upper right corner to close the dialog.
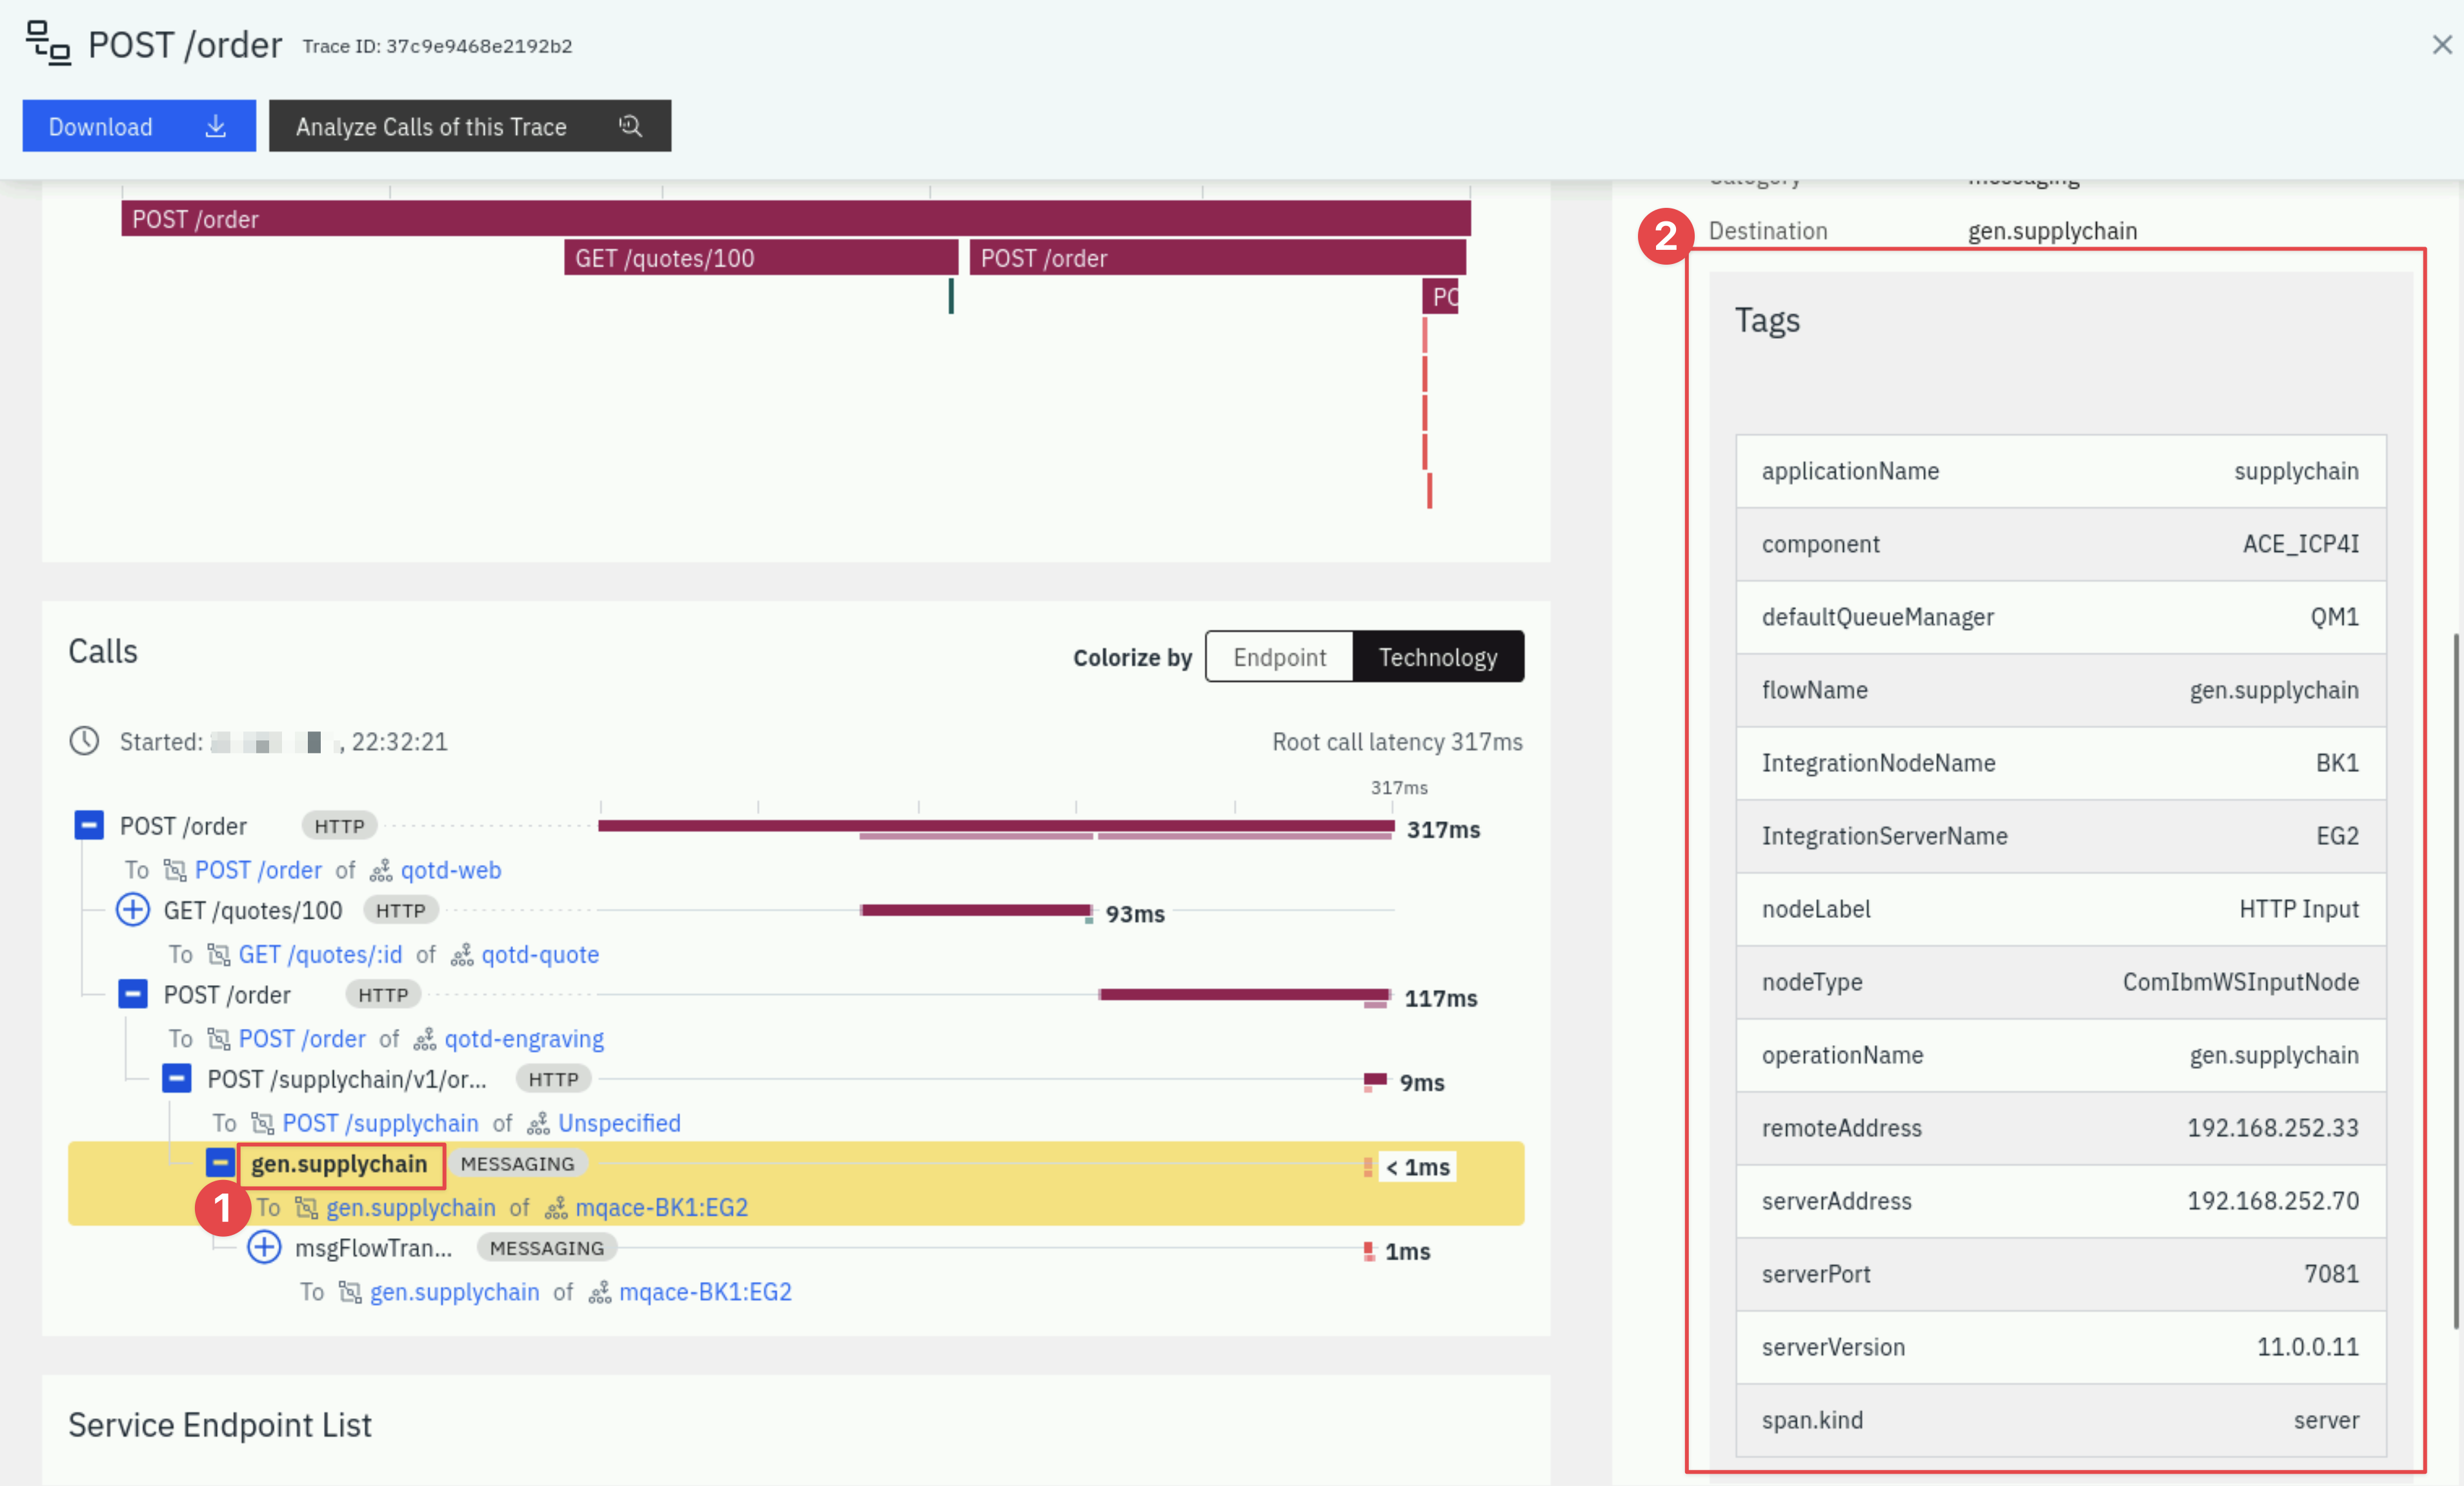
When you select the ACE portions of the call Stack (gen.supplychain, msgFlowTransaction, and postOrder) you will see key information including the flow name, Integration Node, Integration Server, IP address, and more on the right side of the screen.
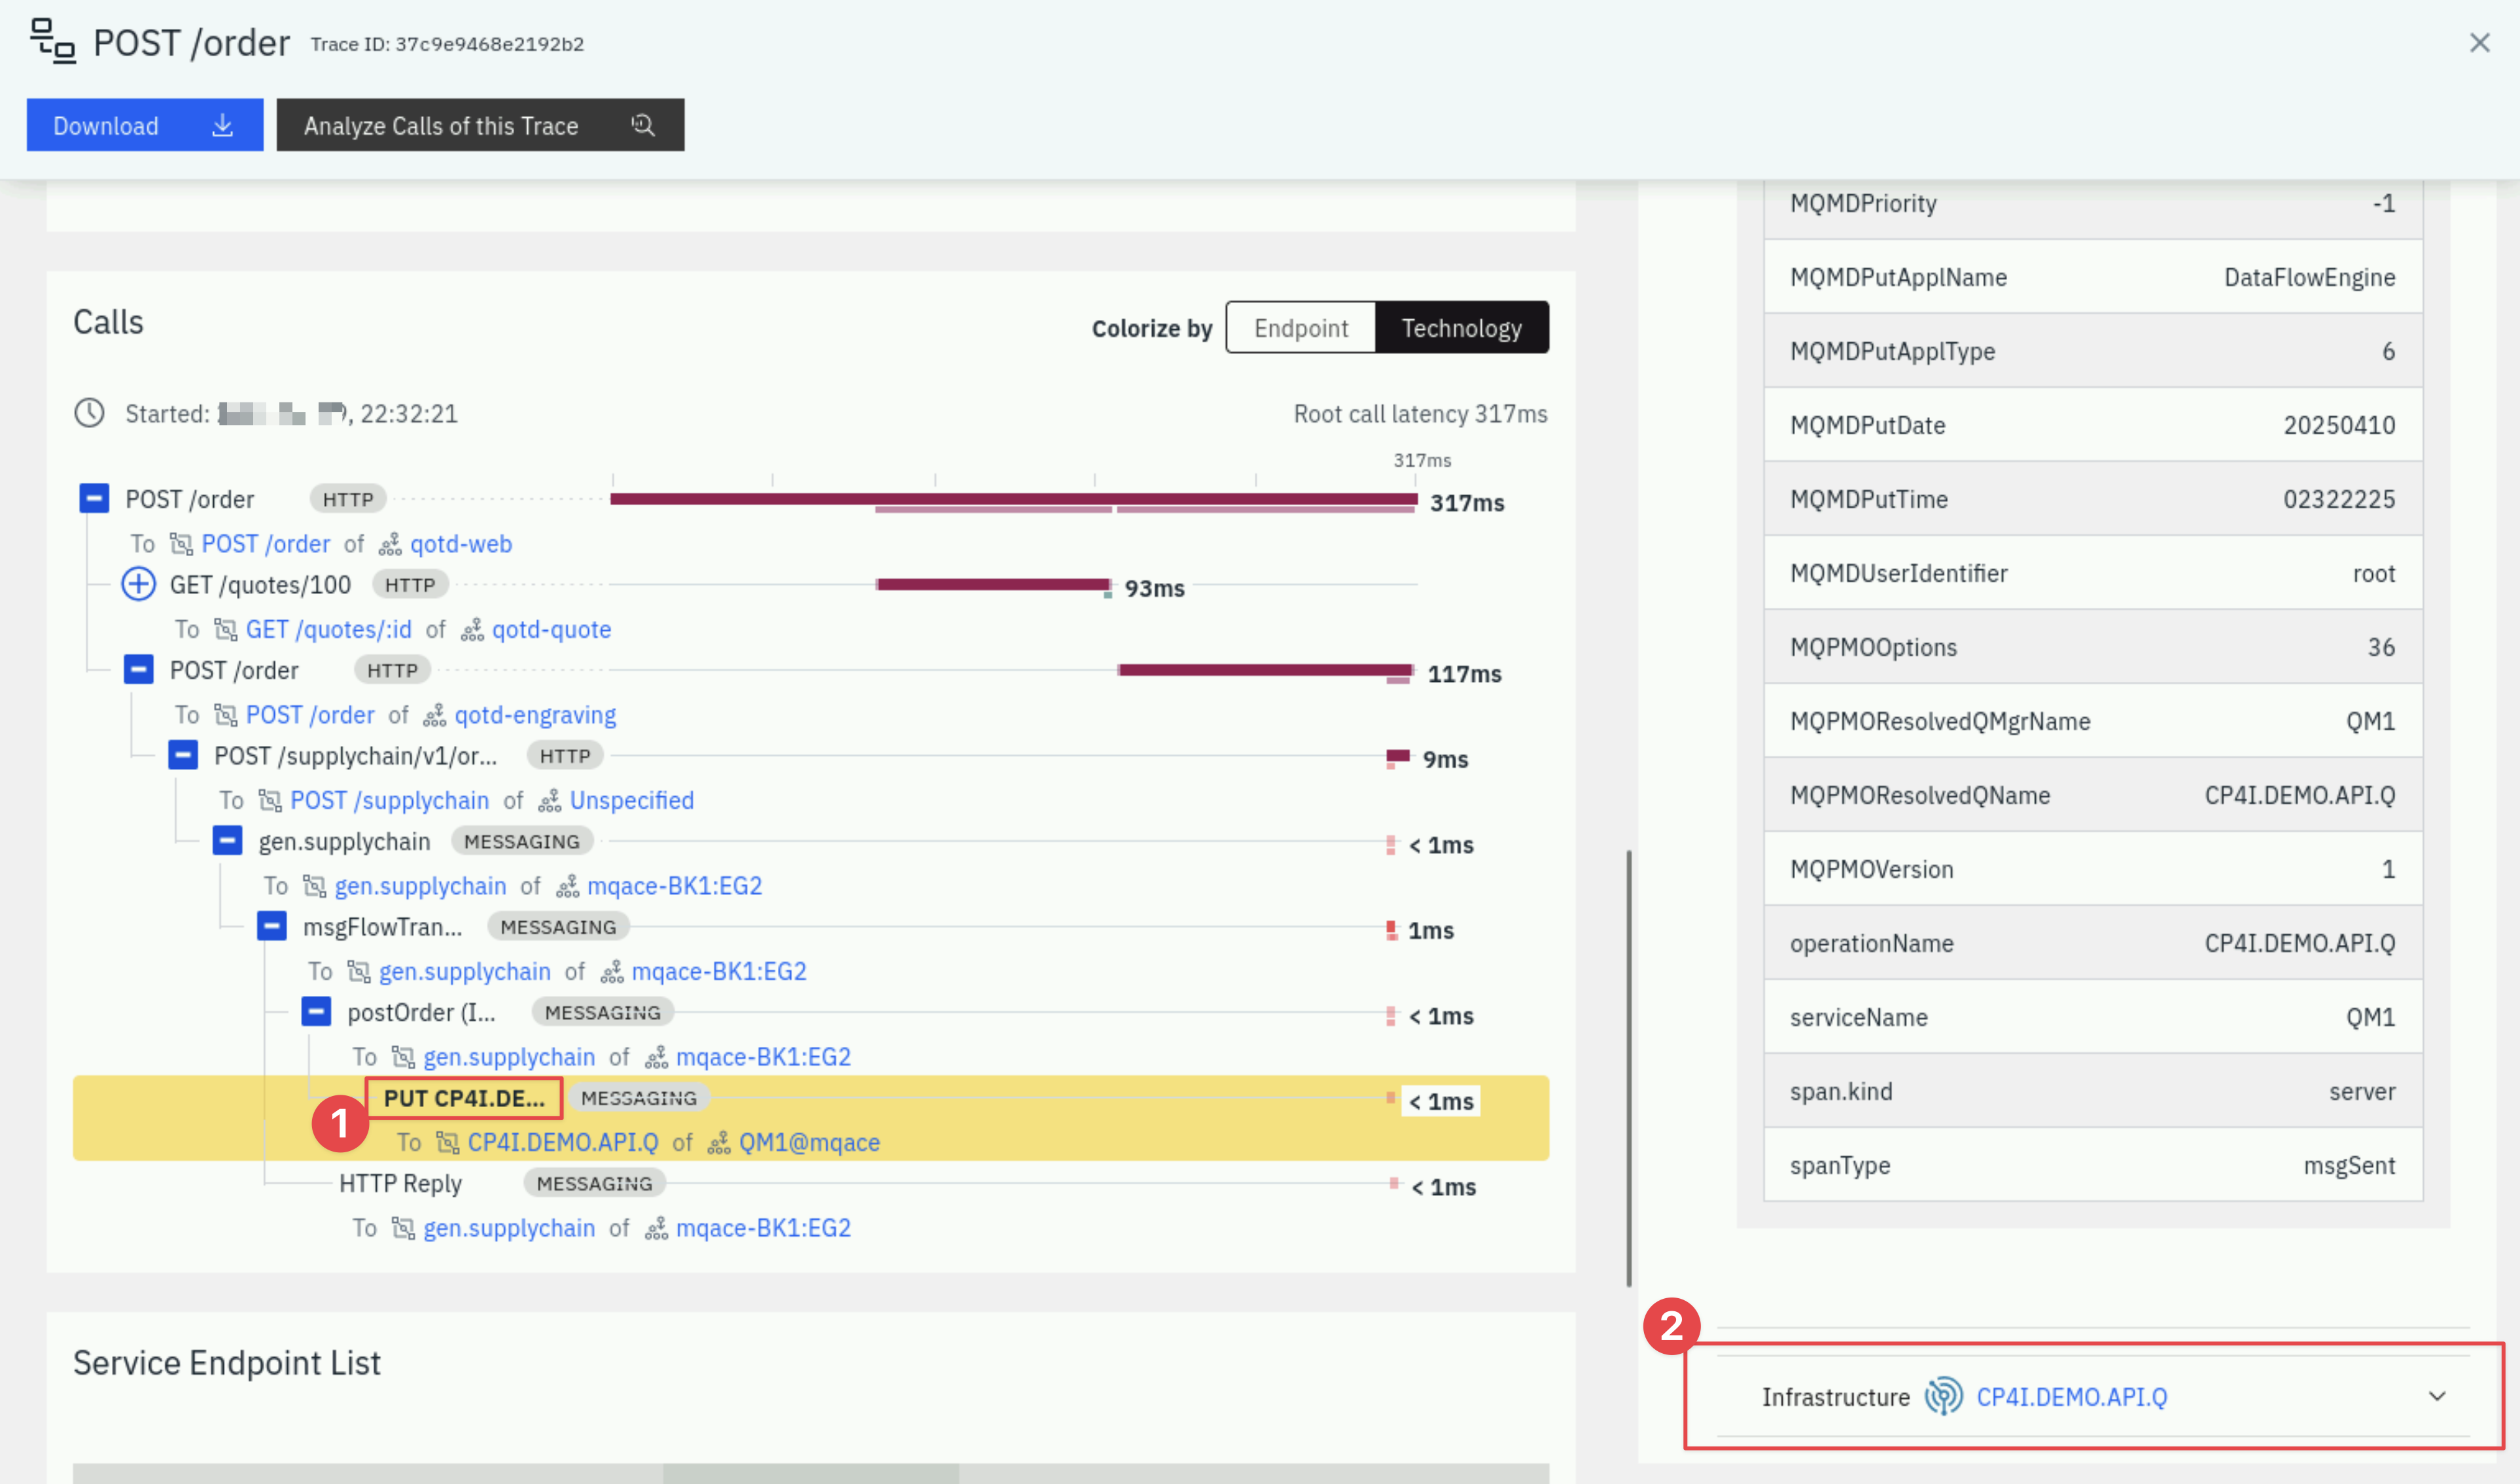
When you select the MQ portion of the call stack, you'll see key information related to the MQ environment on the right. The information includes the Queue Manager, Queue Name, and the message ID that was posted on the queue.
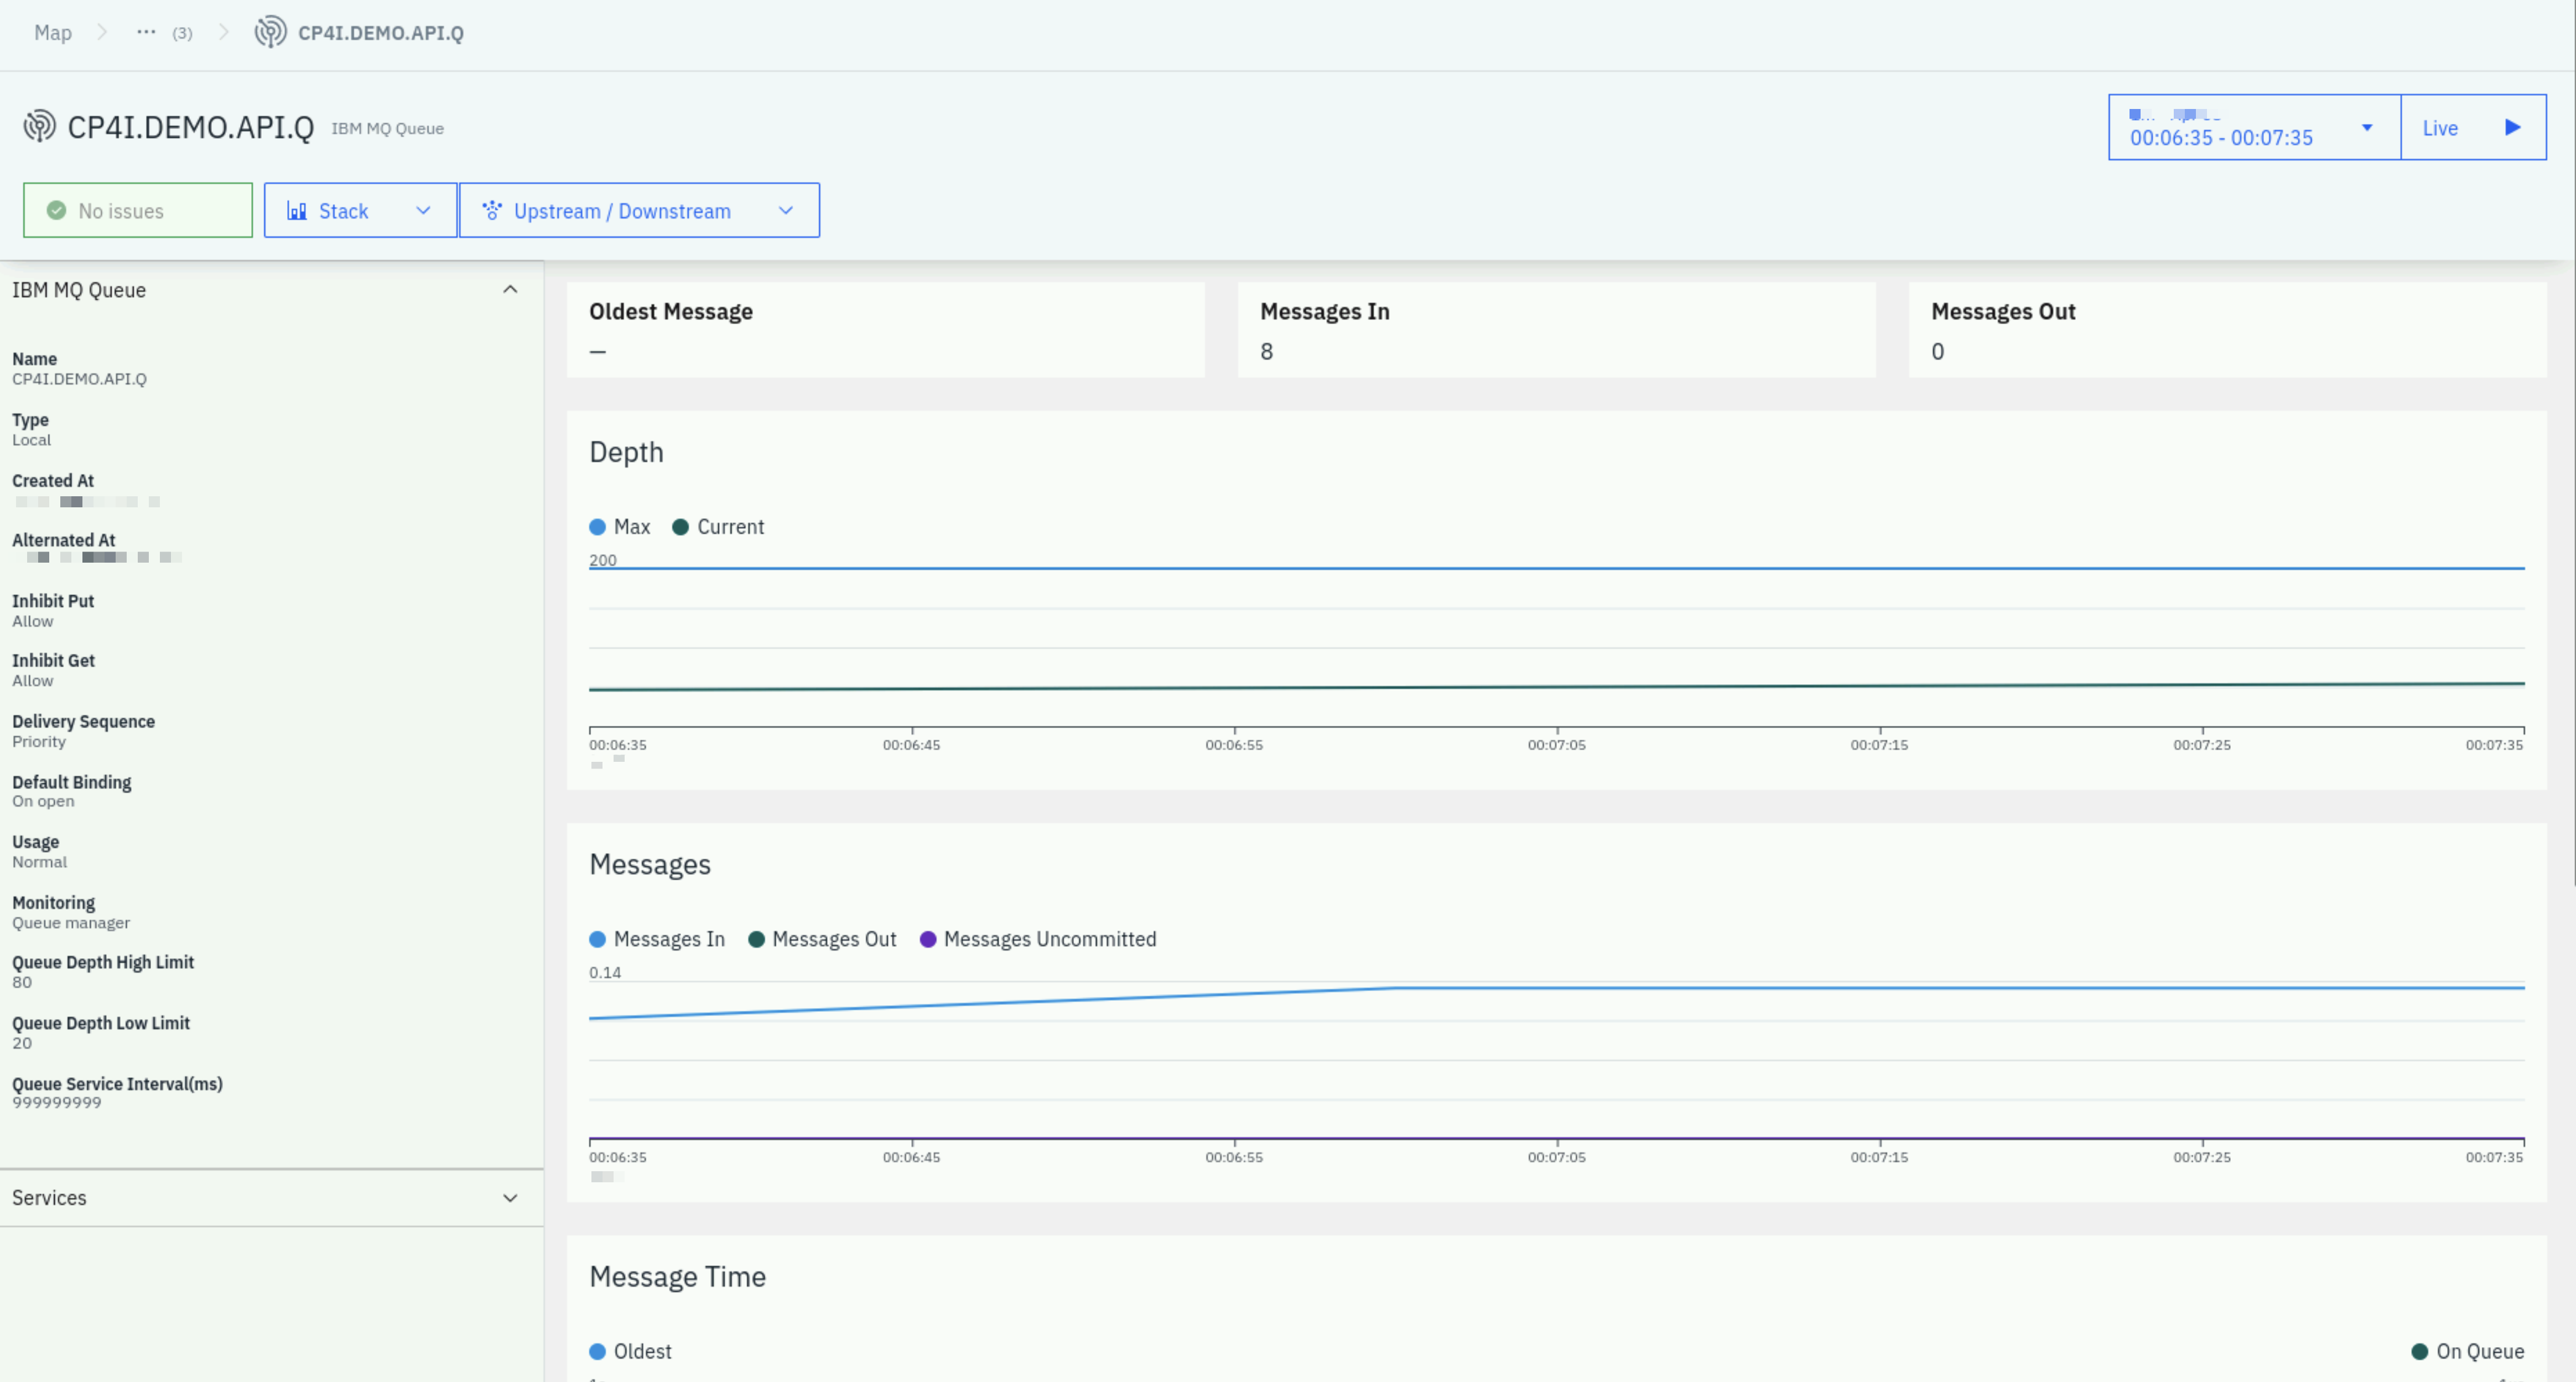
Scroll down to the very bottom on the right side of the screen and you will see a link named CP4I.DEMO.API.Q. Click on the CP4I.DEMO.API.Q link and you will navigate to the Queue page of the MQ sensor for the CP4I.DEMO.API.Q queue. Instana places these links in context to make it easier to diagnose problems.
Earlier, you explored the Queue Manager and the MQ Channels. You're now looking at the queue that is being used by this application. You'll notice key information like the oldest message on the queue, queue depth, input/output rates, and more.
3.6: Websites and Mobile App Monitoring
When Robot Shop was installed it included a load generator. The load generator is a bot accessing the Robot Shop web application and mimics real users so that you can see metrics collected by Instana.
Next, let's take a look at Website and Mobile Application Monitoring. In this environment, Instana does not include any native mobile applications, however you should know that Instana can gather End User Monitoring (EUM) data from Mobile Applications too. For now, we'll investigate the website monitoring.
Using the left side navigation, select Websites & Mobile Apps
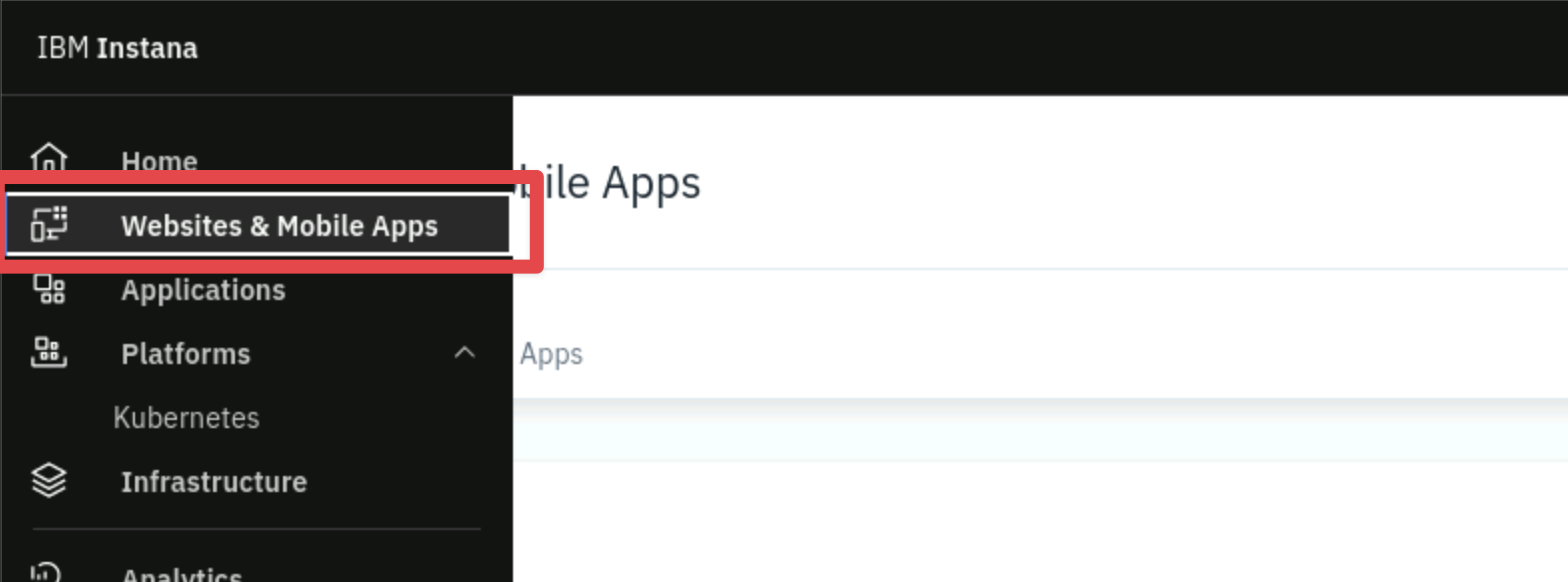
You will see a list of websites that are being monitored. In this environment, you'll see the Robot Shop application website. Click on the blue link for the Robot Shop website to drill down for more details.

Explore the additional data available within the website monitoring by clicking on some of the other tabs.
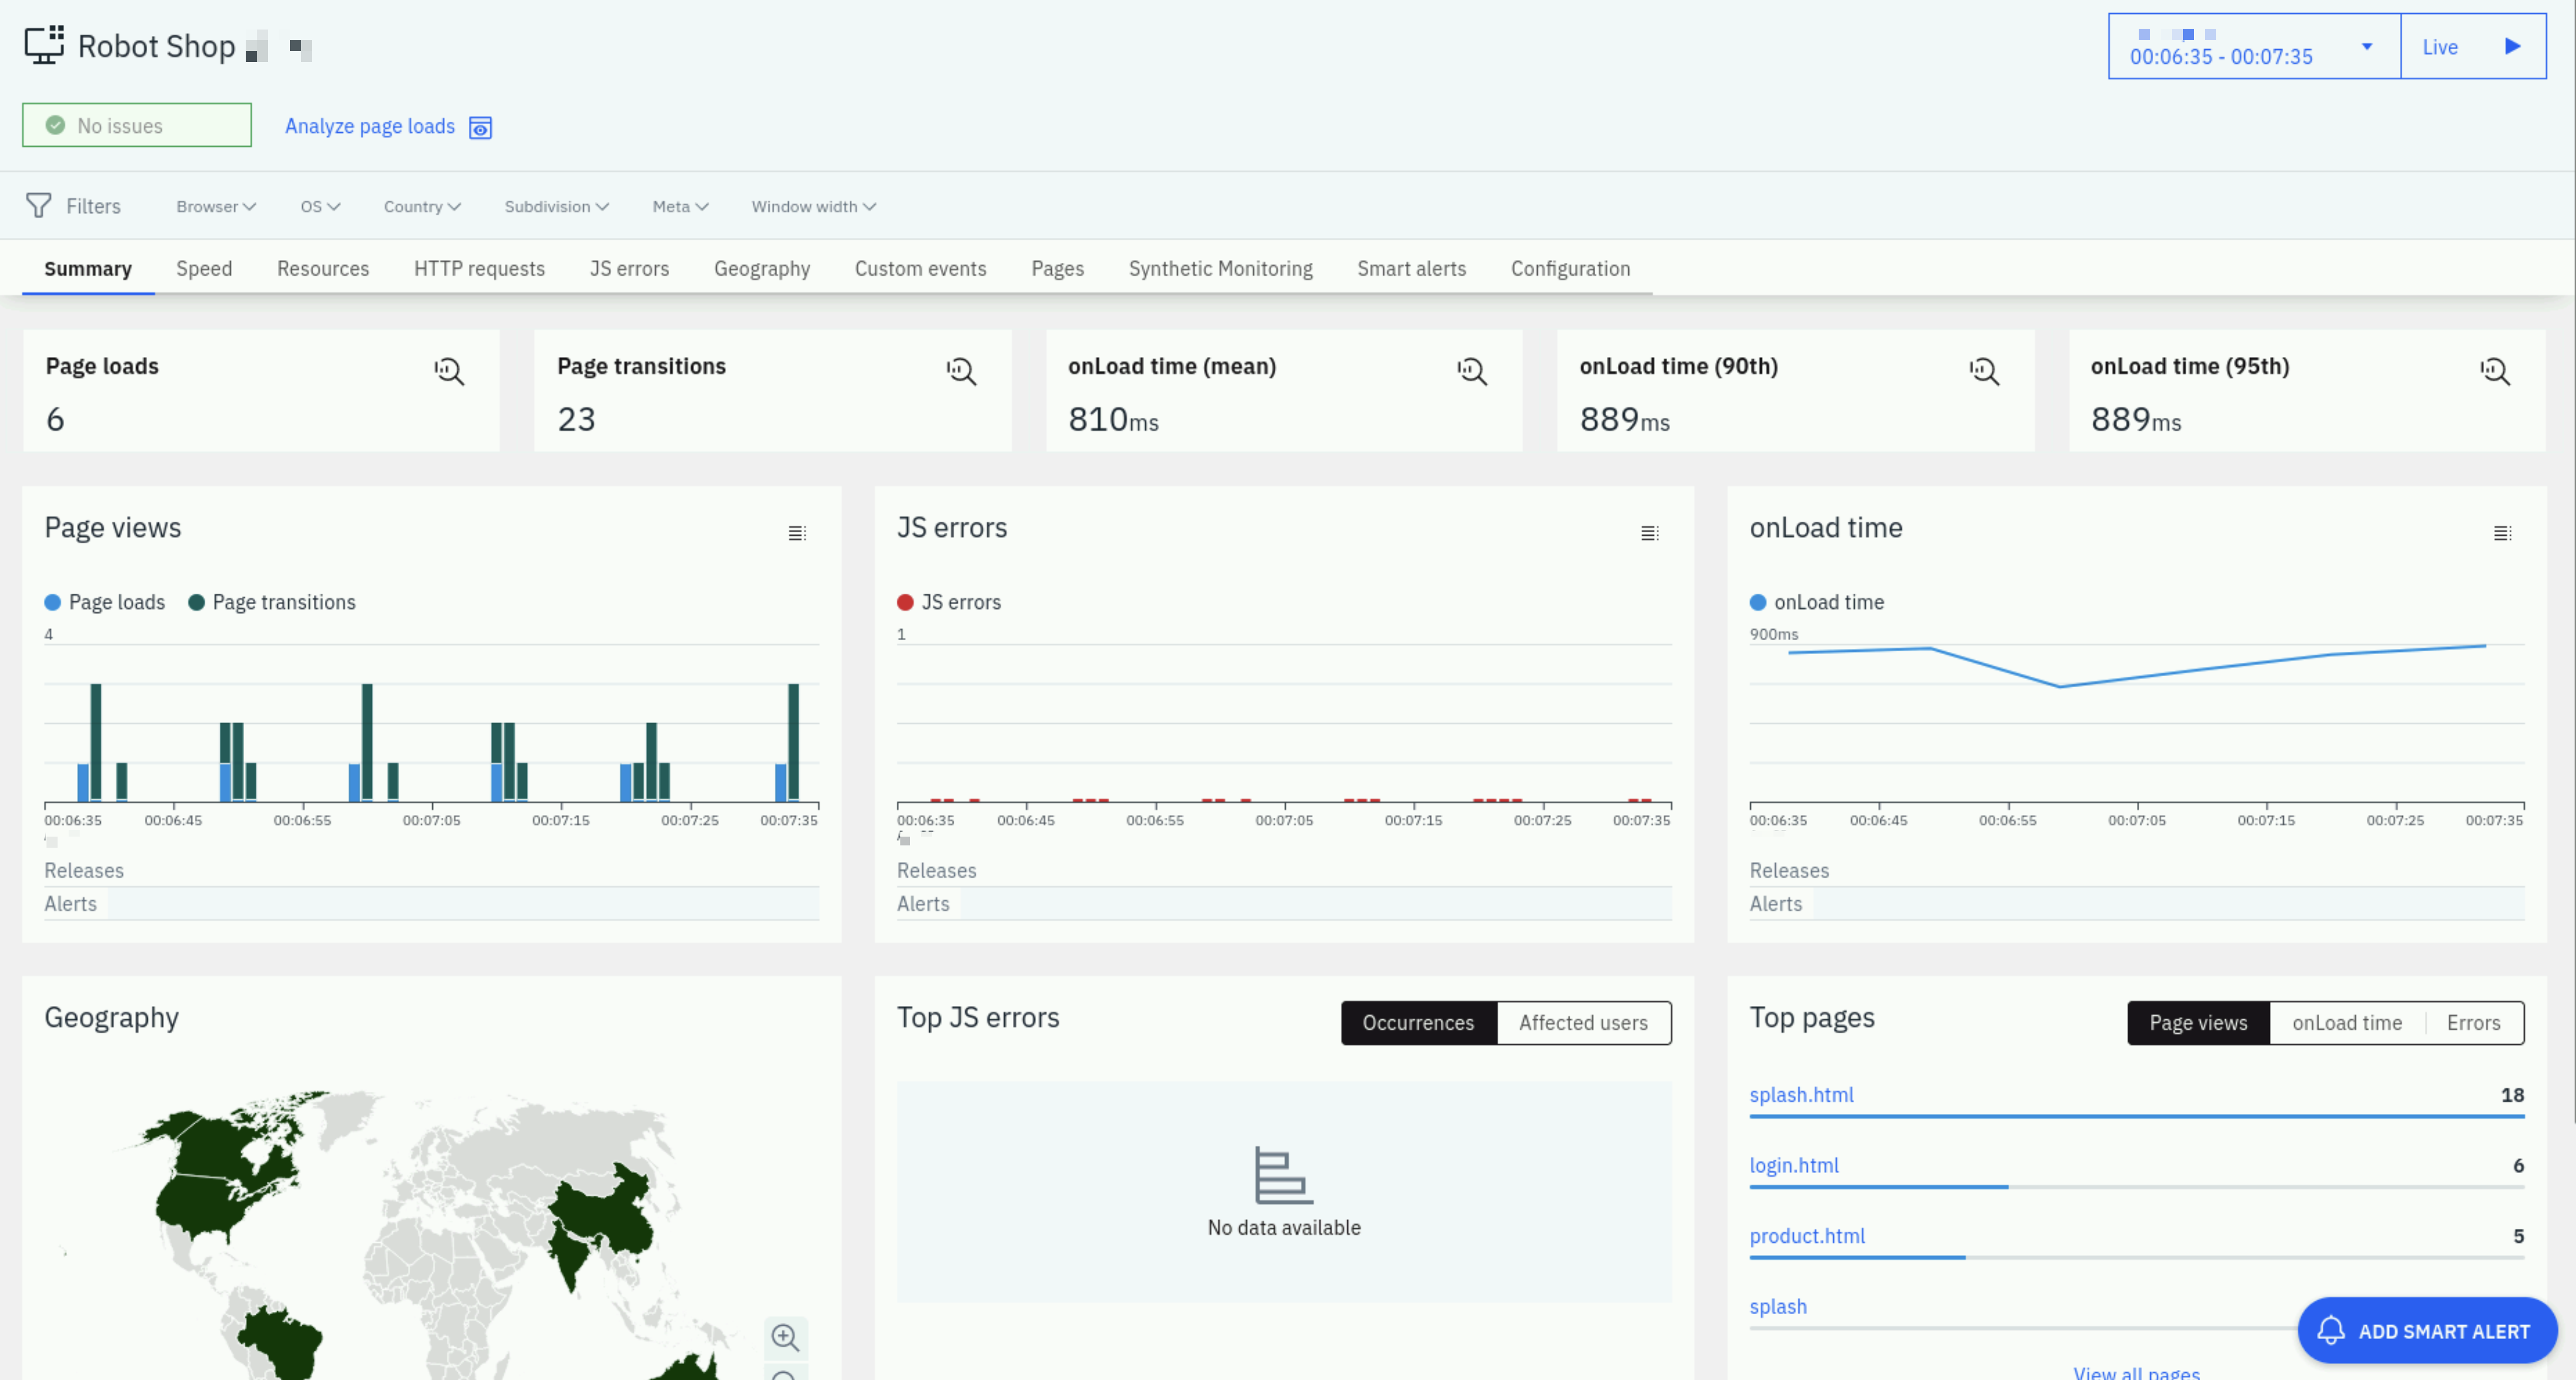
Next, explore the Filters that you see at the top of the screen.

In this environment, the filters will be limited in their usefulness because there is only automated workload coming from a load generation script. But, usually, you can use this information to filter the web traffic down to specific browser types, OS's, geographic locations and key metadata tags. This can be very useful in identifying whether specific network locations, browser, or OS's are having performance problems. If you want to see typical EUM data, you can look at one of the IBM sales or Business Partner demo environments.
At the top of the screen, click on the Analyze Page Loads button

You will see a detailed list of the web requests grouped by URL path.
Select the only Group available. This will give you a page that is filtered to the transactions for just that single URL path. As with Tracing, Instana is capturing 100% of the web transactions.
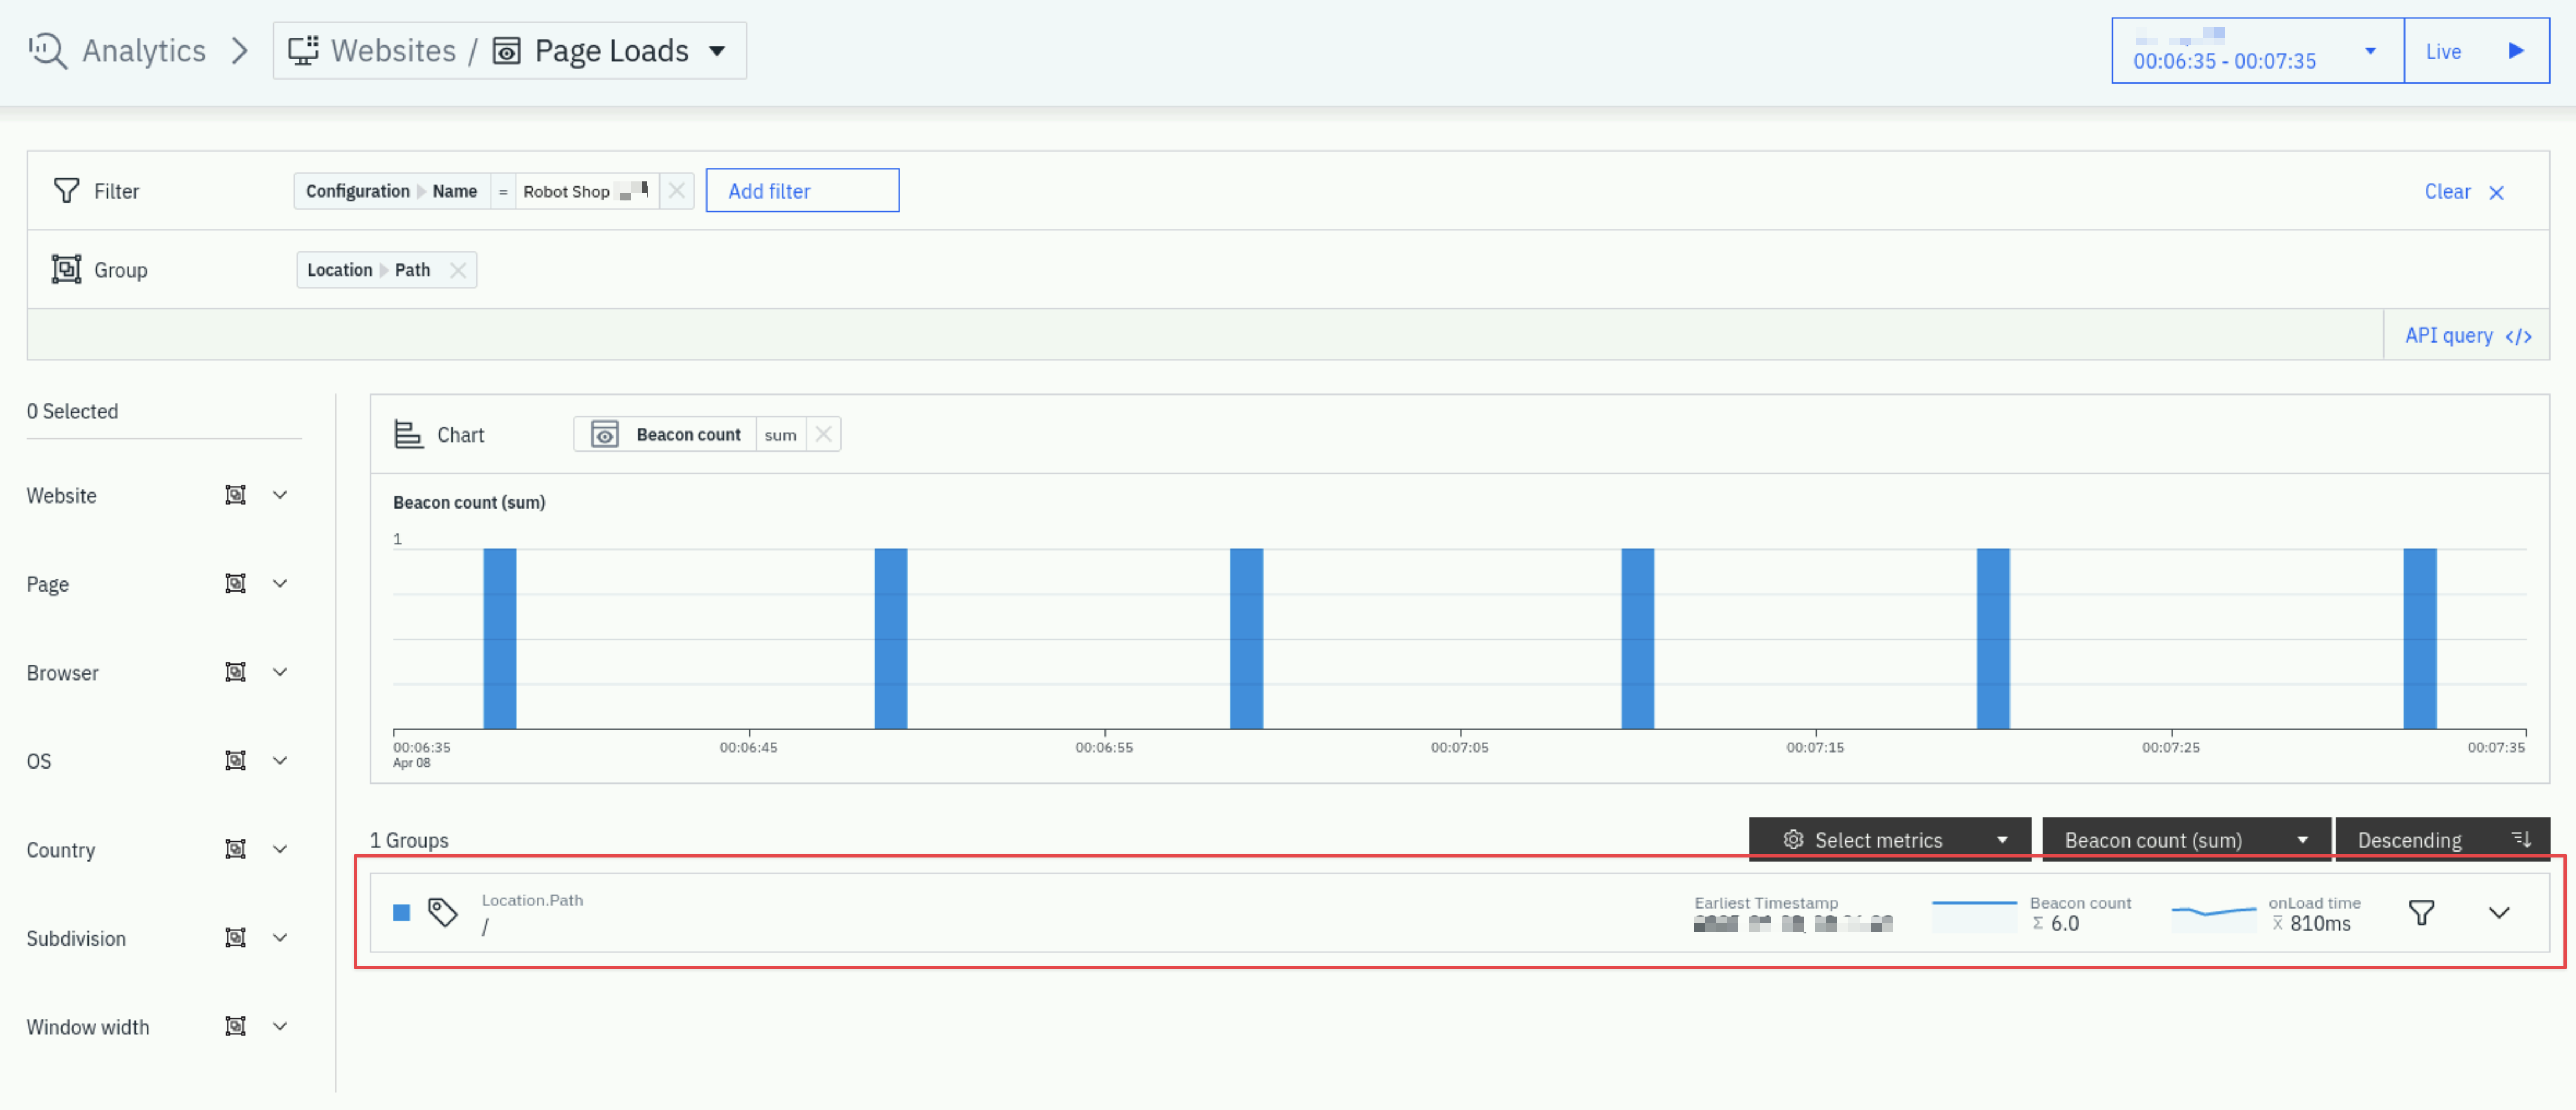
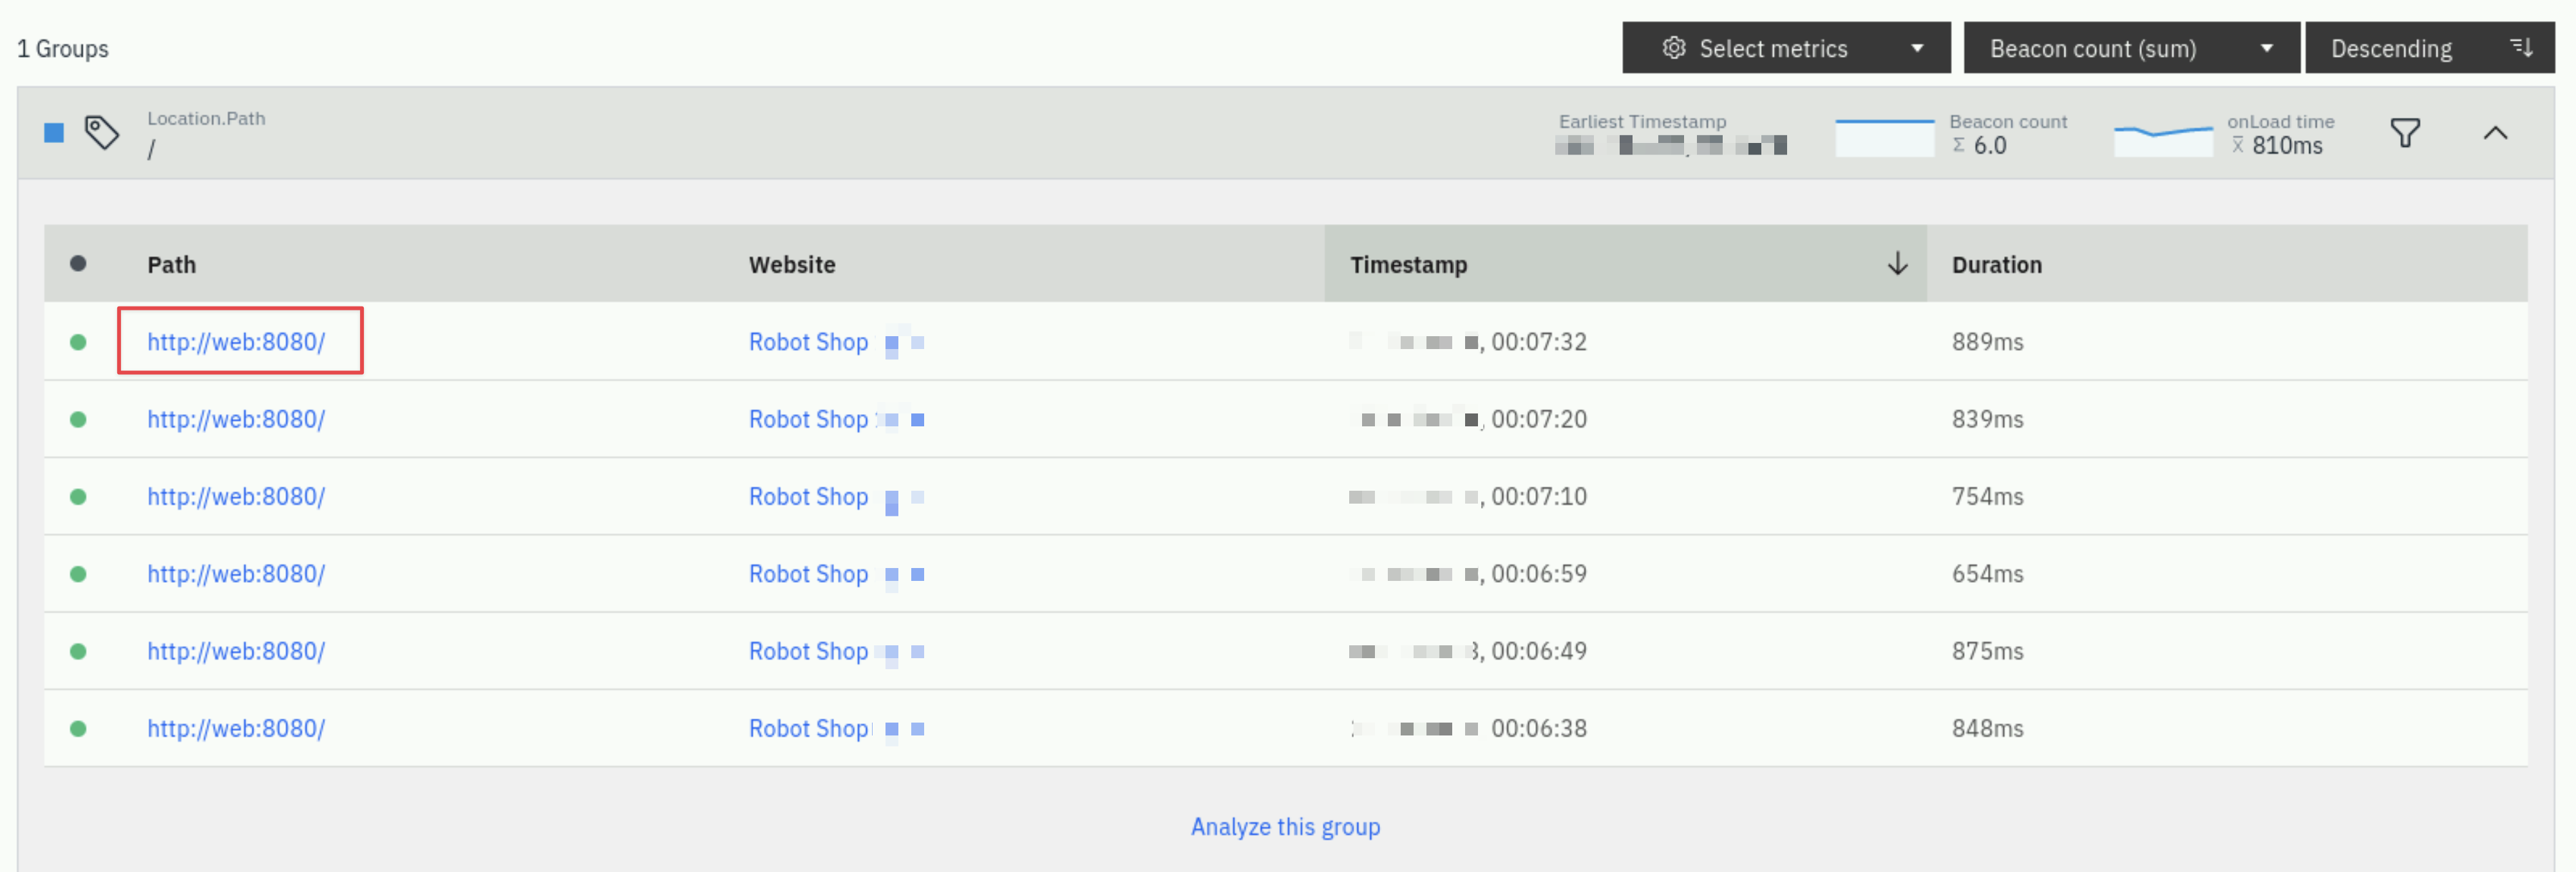
Next, select one of the requests.
You will see a detailed page showing the EUM data and more. At the top of the page, you'll notice that you can see the user that made the request. This sensitive data can be omitted by Instana if the customer desires. You'll also see the Browser version and operating system that was used to access the web page. Depending on the environment, you'll also see geolocation data for where the person accessed the application. In some cases the private IP addresses are not mapped and the User Location data will be empty.
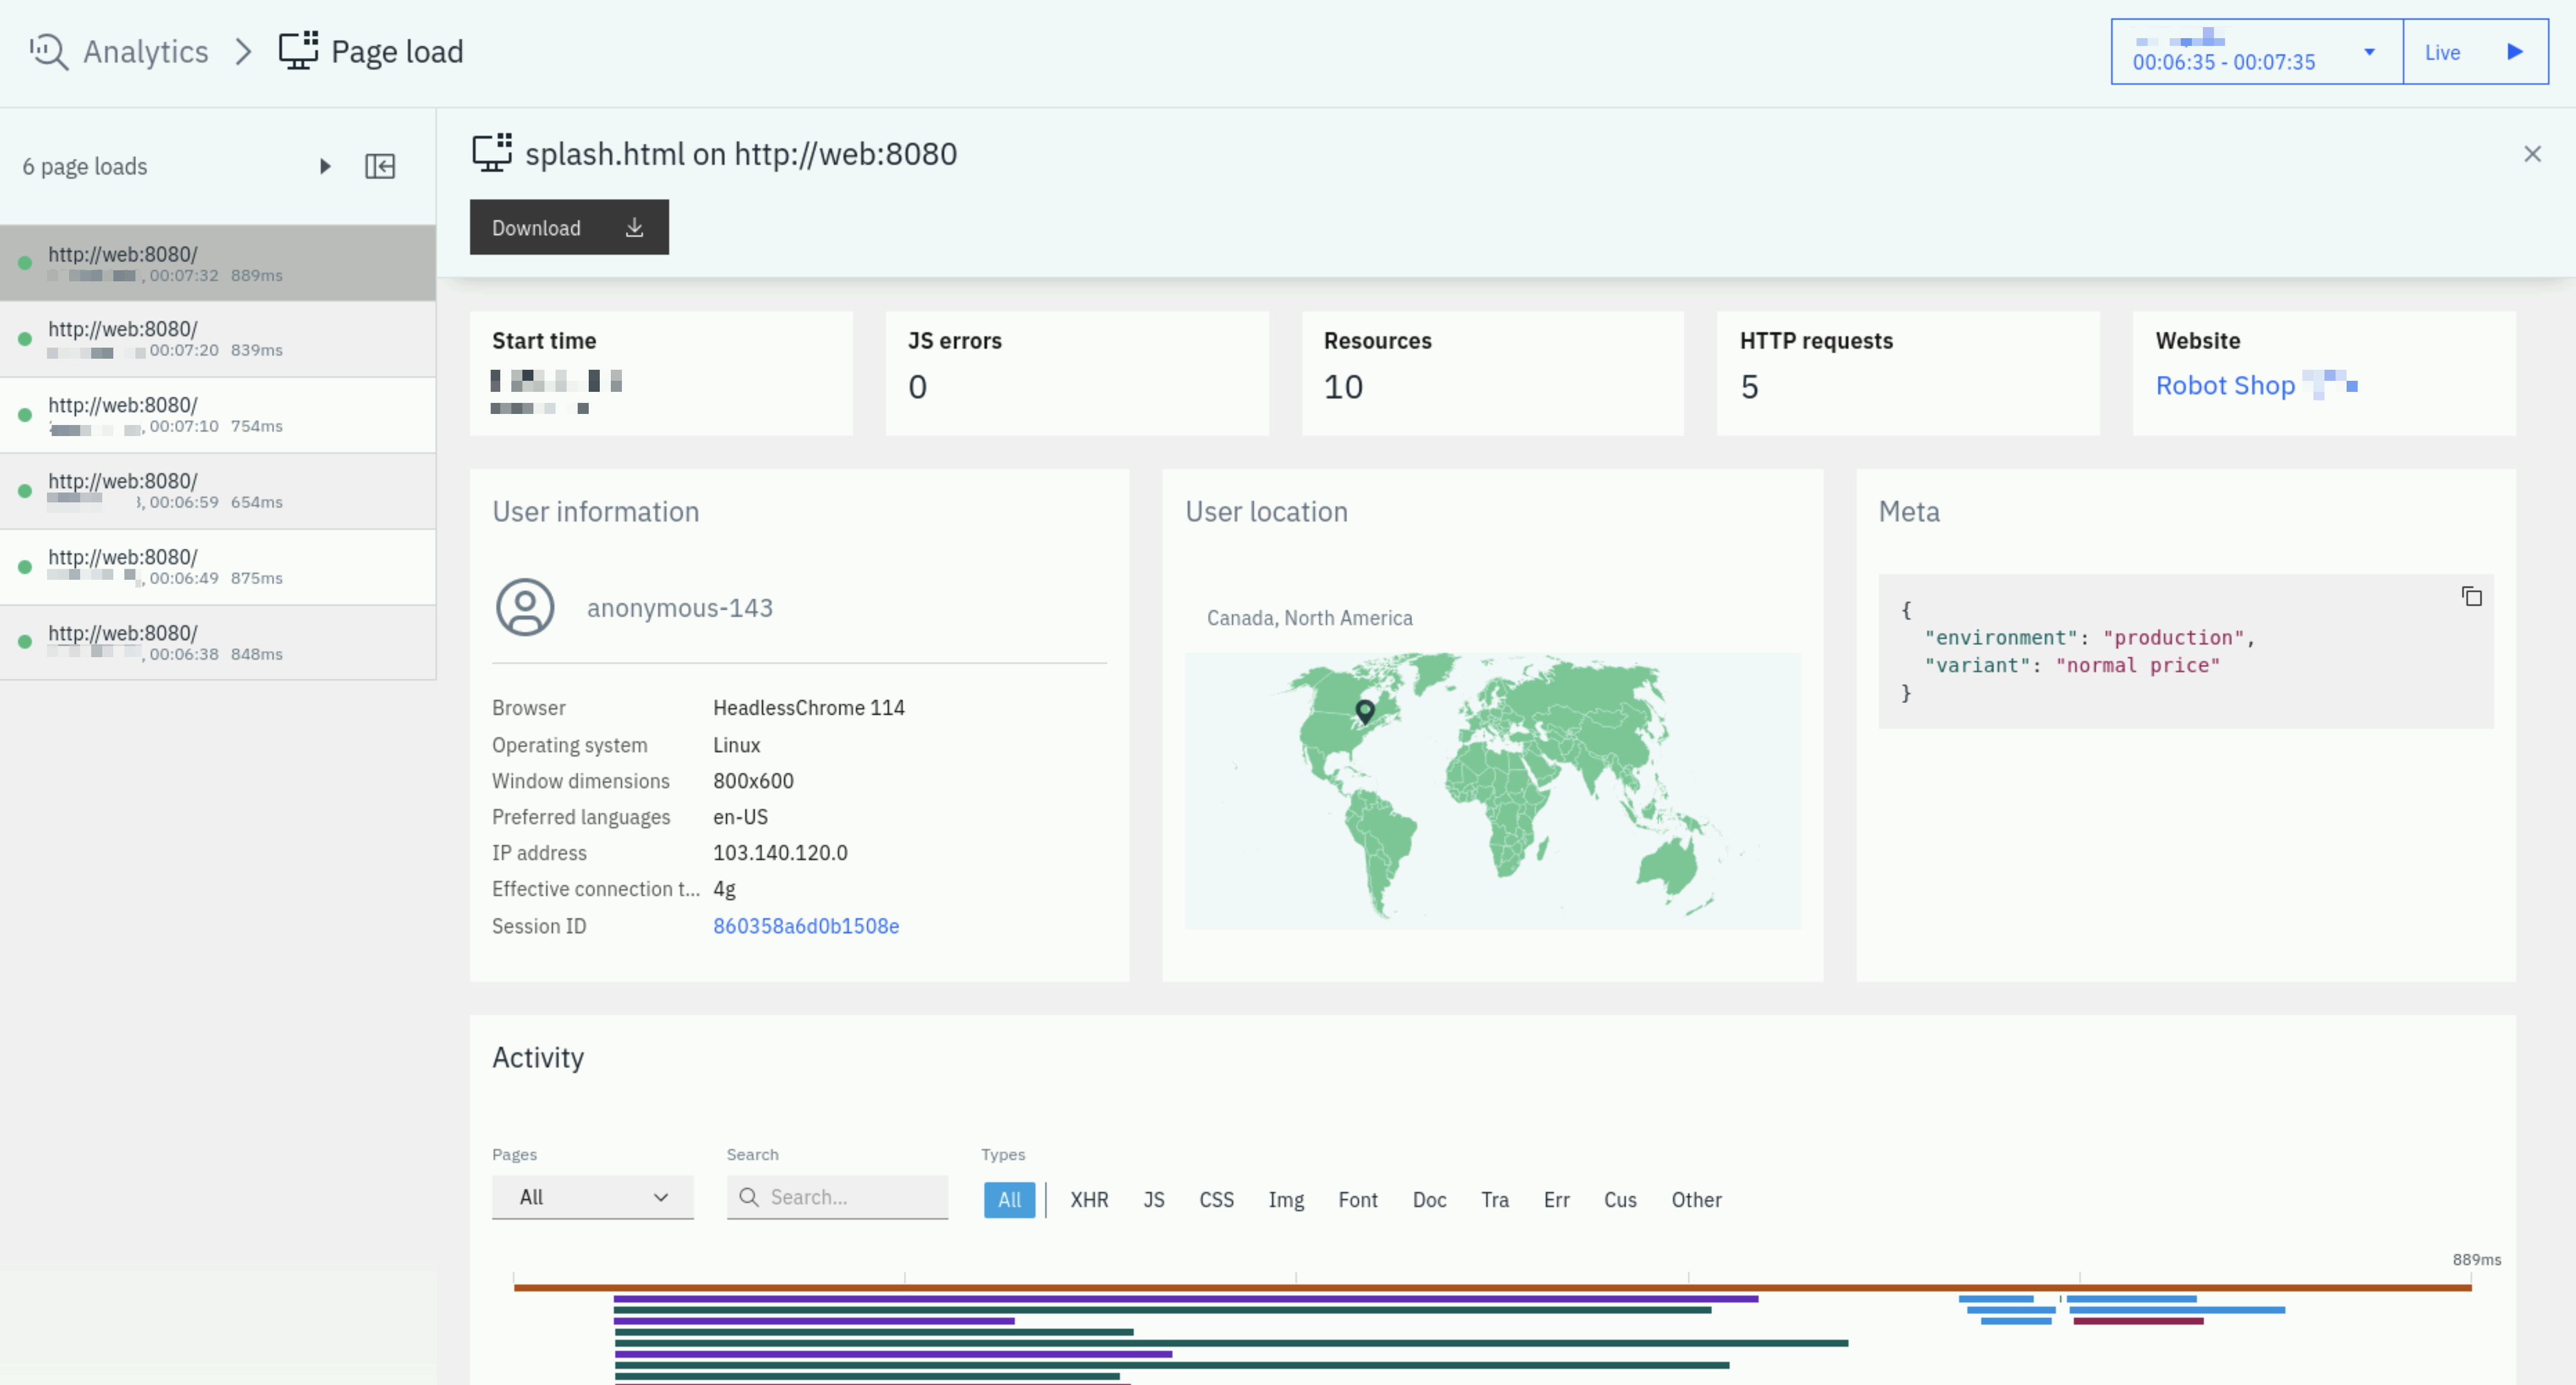
Scroll down on the page and you'll see a detailed breakdown of the request including timings for the key page content.
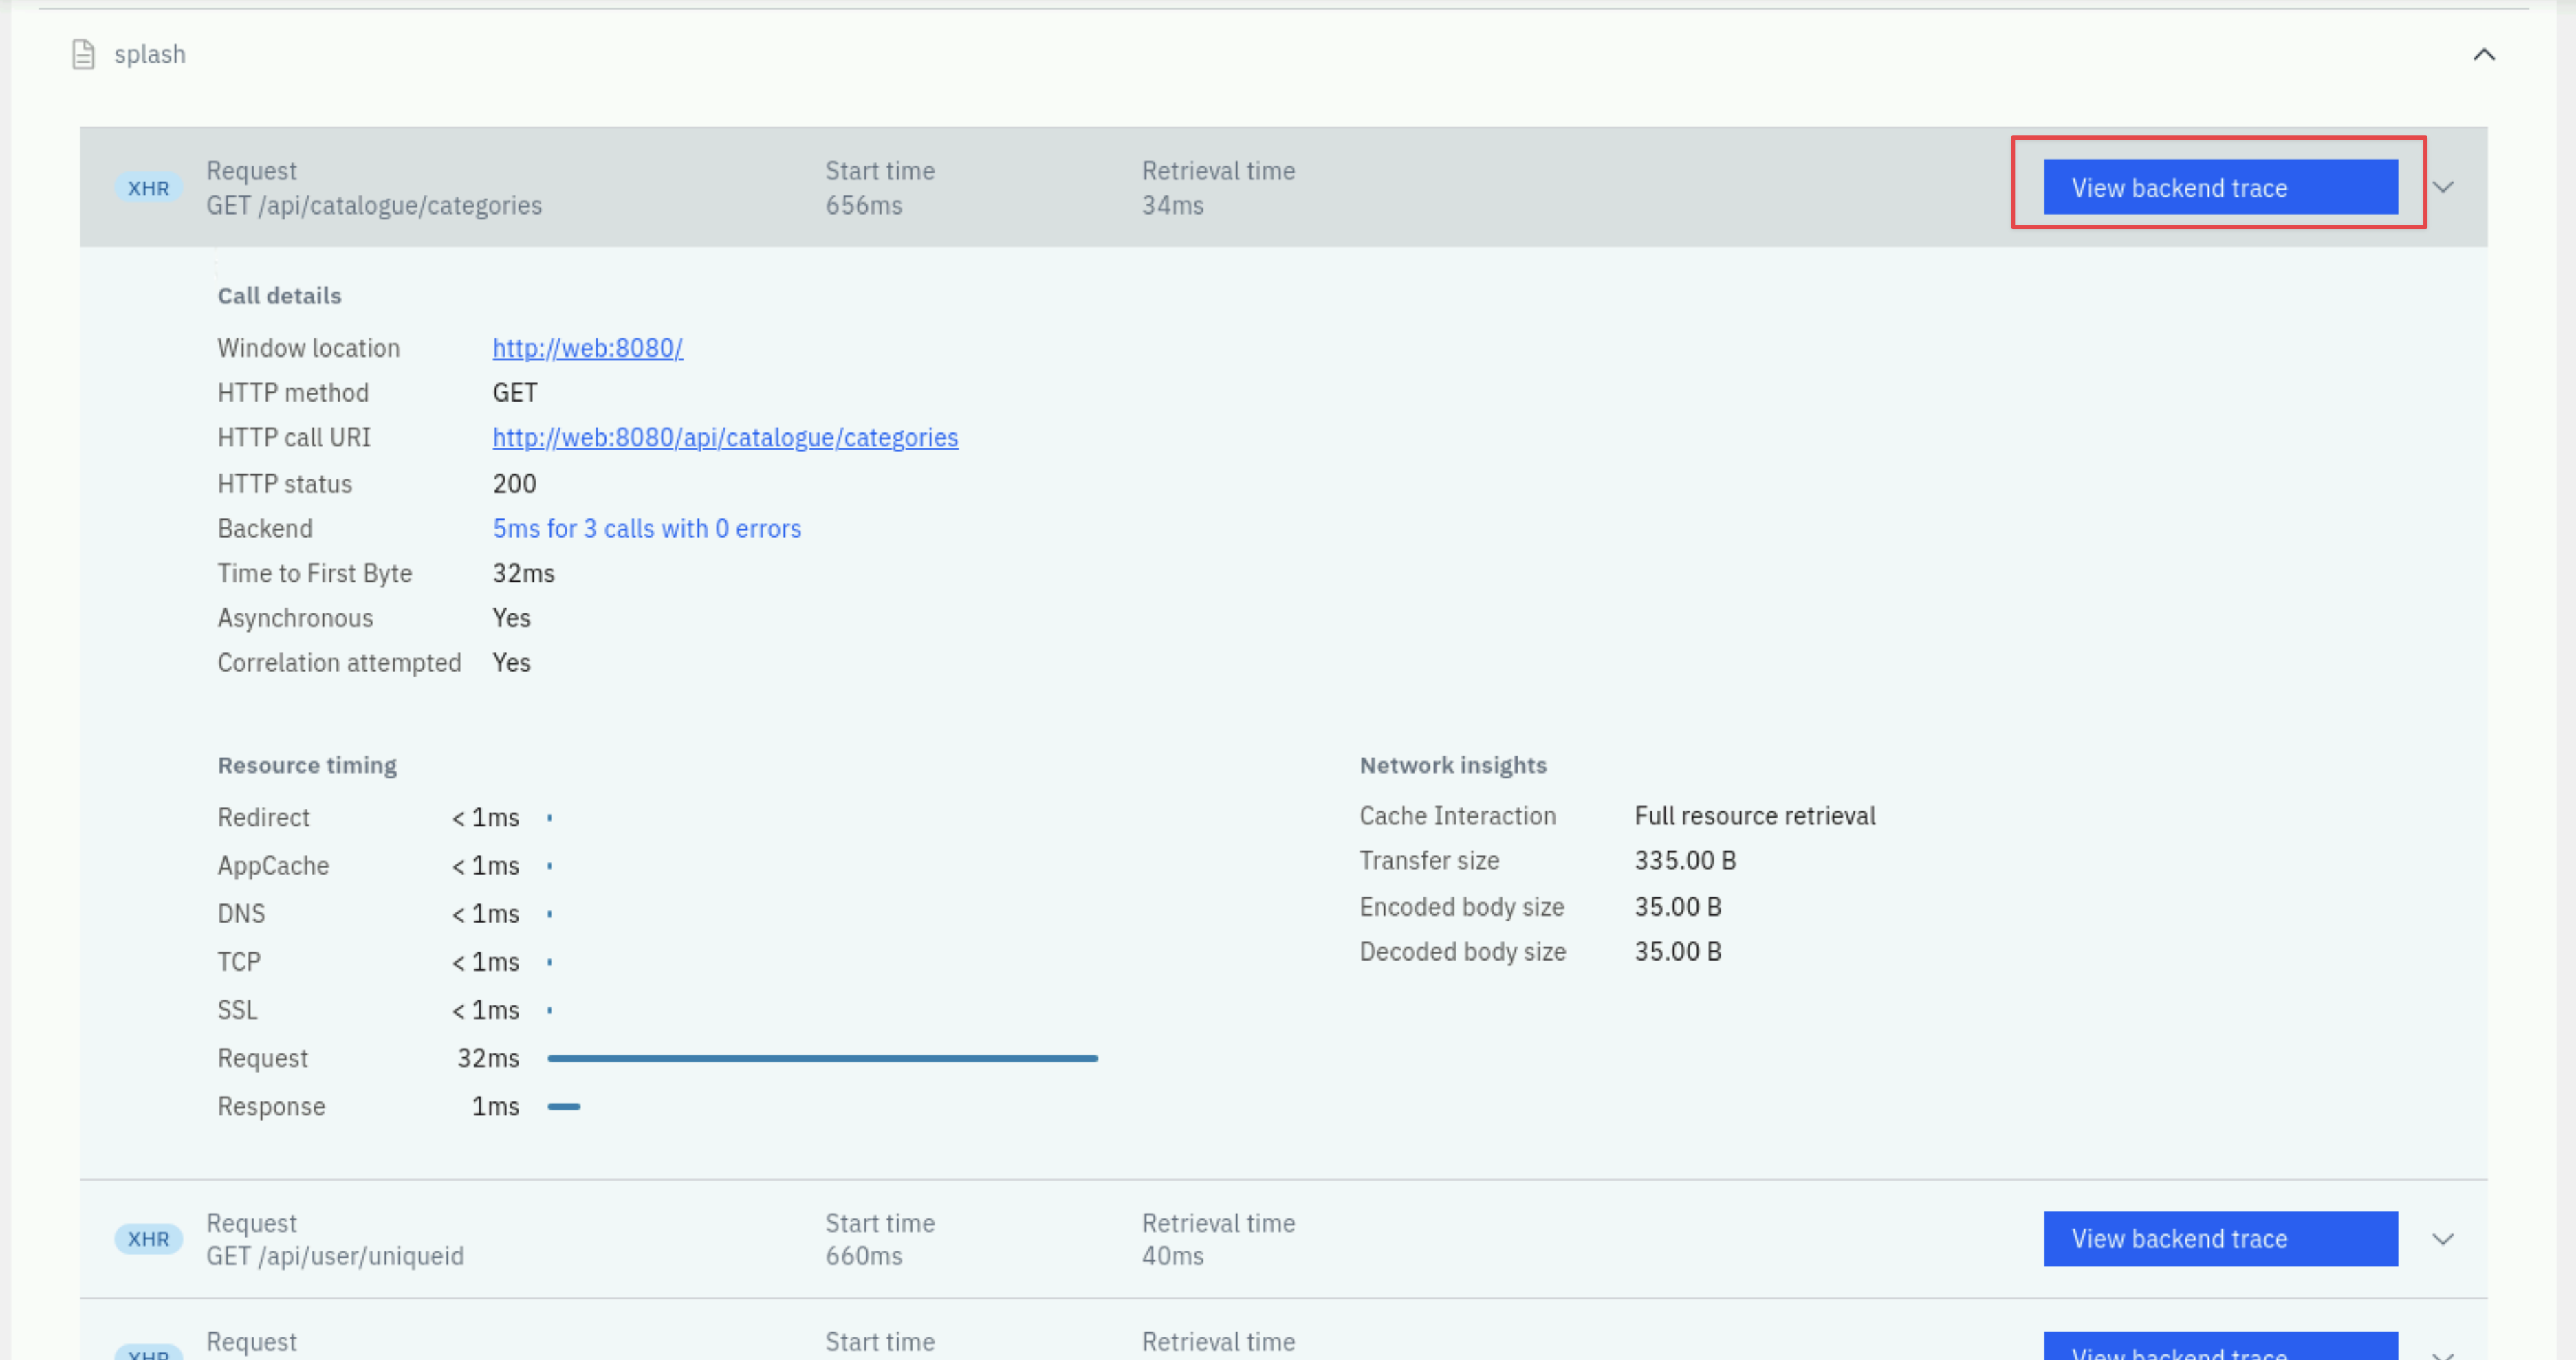
Expand one of the entries on the right by clicking the down arrow to view more details.
We are not going to do it for this lab, but if you click on the View Backend Trace button, you can investigate the backend trace data that you saw earlier in the lab.
3.7: Unbound Analytics
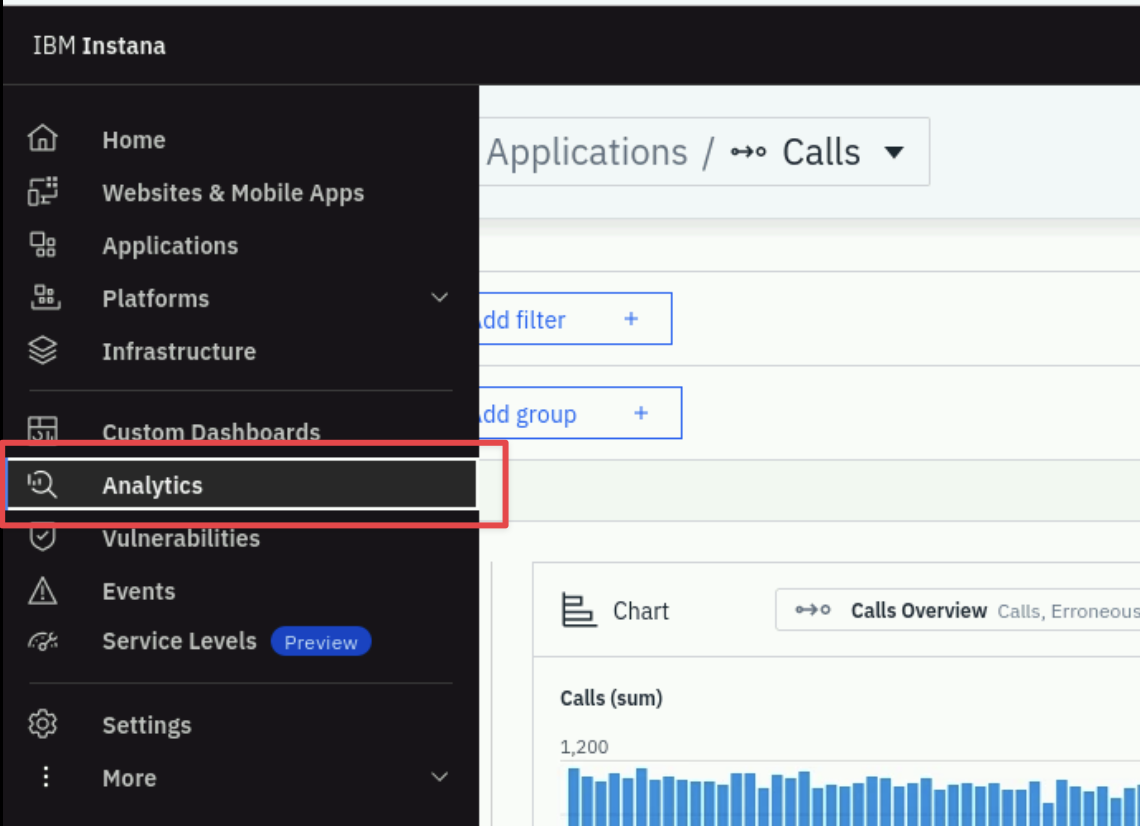
Next, we're going to investigate Instana's unbounded analytics. Navigate to the Analytics using the left side navigation.
Initially, you will see a screen showing 100% of the Application Calls that are happening in the environment.
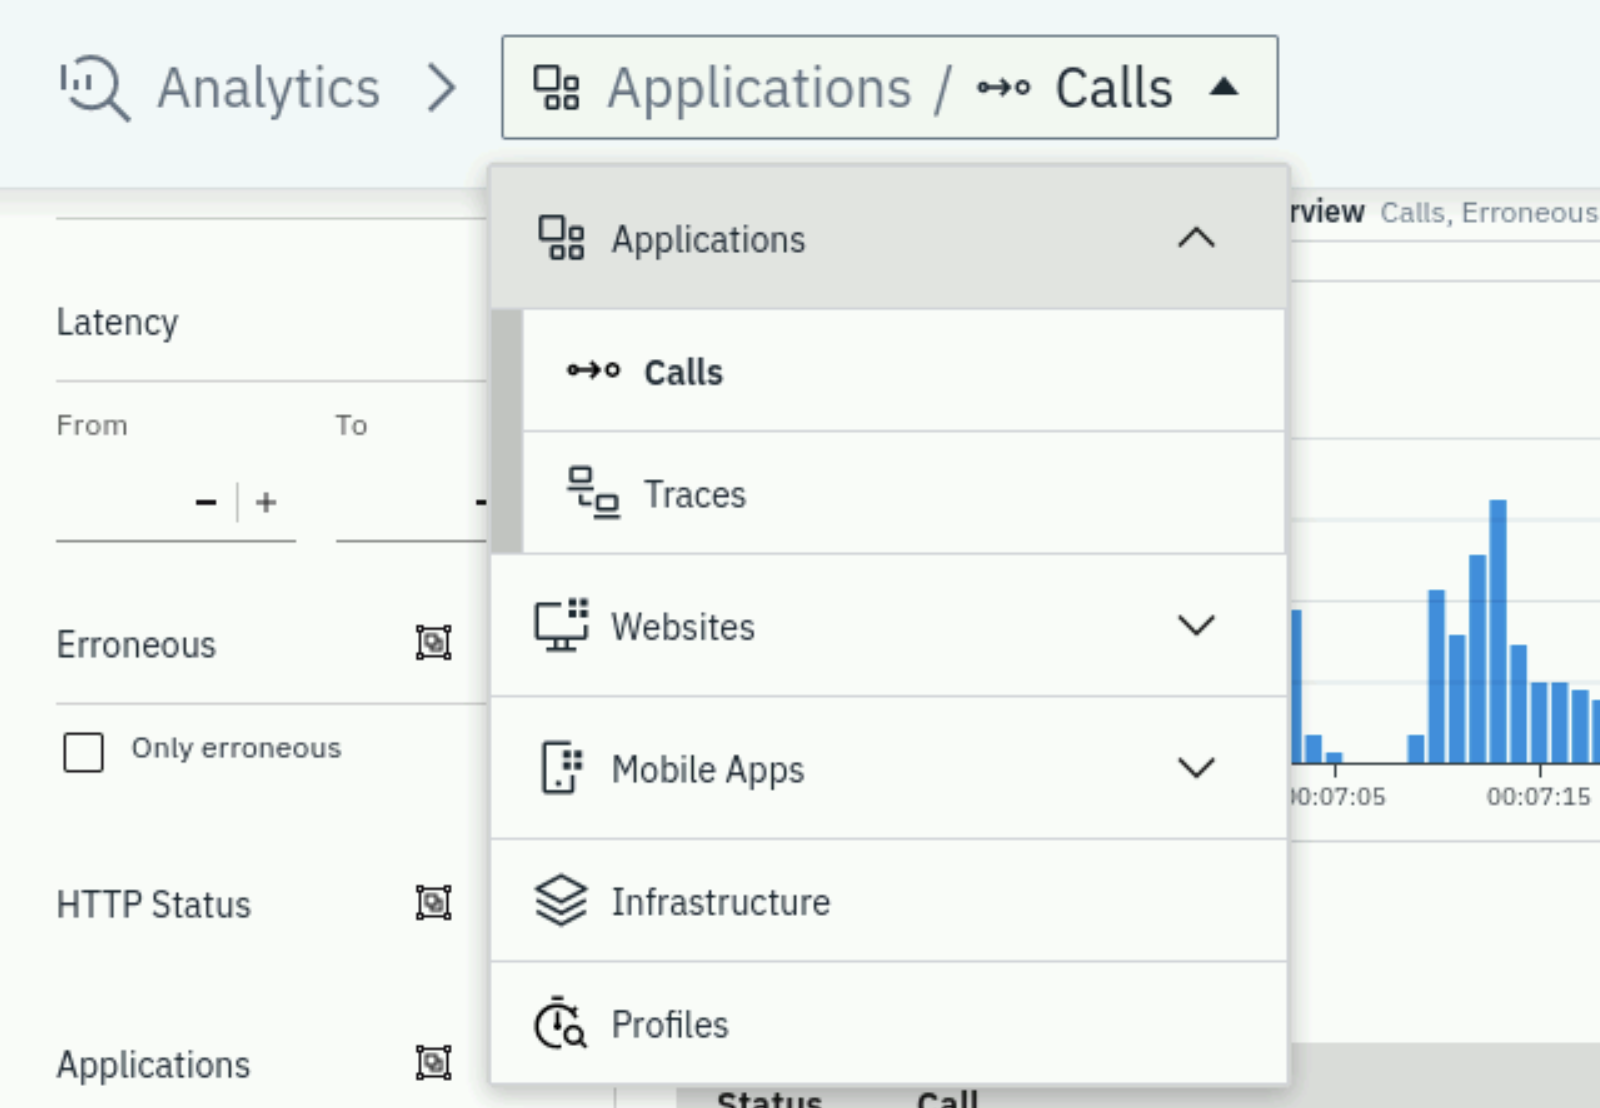
Select the dropdown at the top of the page labeled Applications / Calls to view other options. For example, you could analyze the traces, websites, mobile applications, or profiles. For now, close the dialog and we'll analyze the Application Calls
One of the key Instana capabilities is Unbounded Analytics. This allows you to apply ad-hoc queries to easily find the data you are looking for. On the screen, you'll see a couple of different ways that you can query/filter the metrics.
Firstly ensure your time filter is set to show data for the last hour. Once that is set, on the left side, you'll see a number of ways to filter. Expand the Applications dropdown arrows to see the available options. Then, select one of the checkboxes to filter the data.
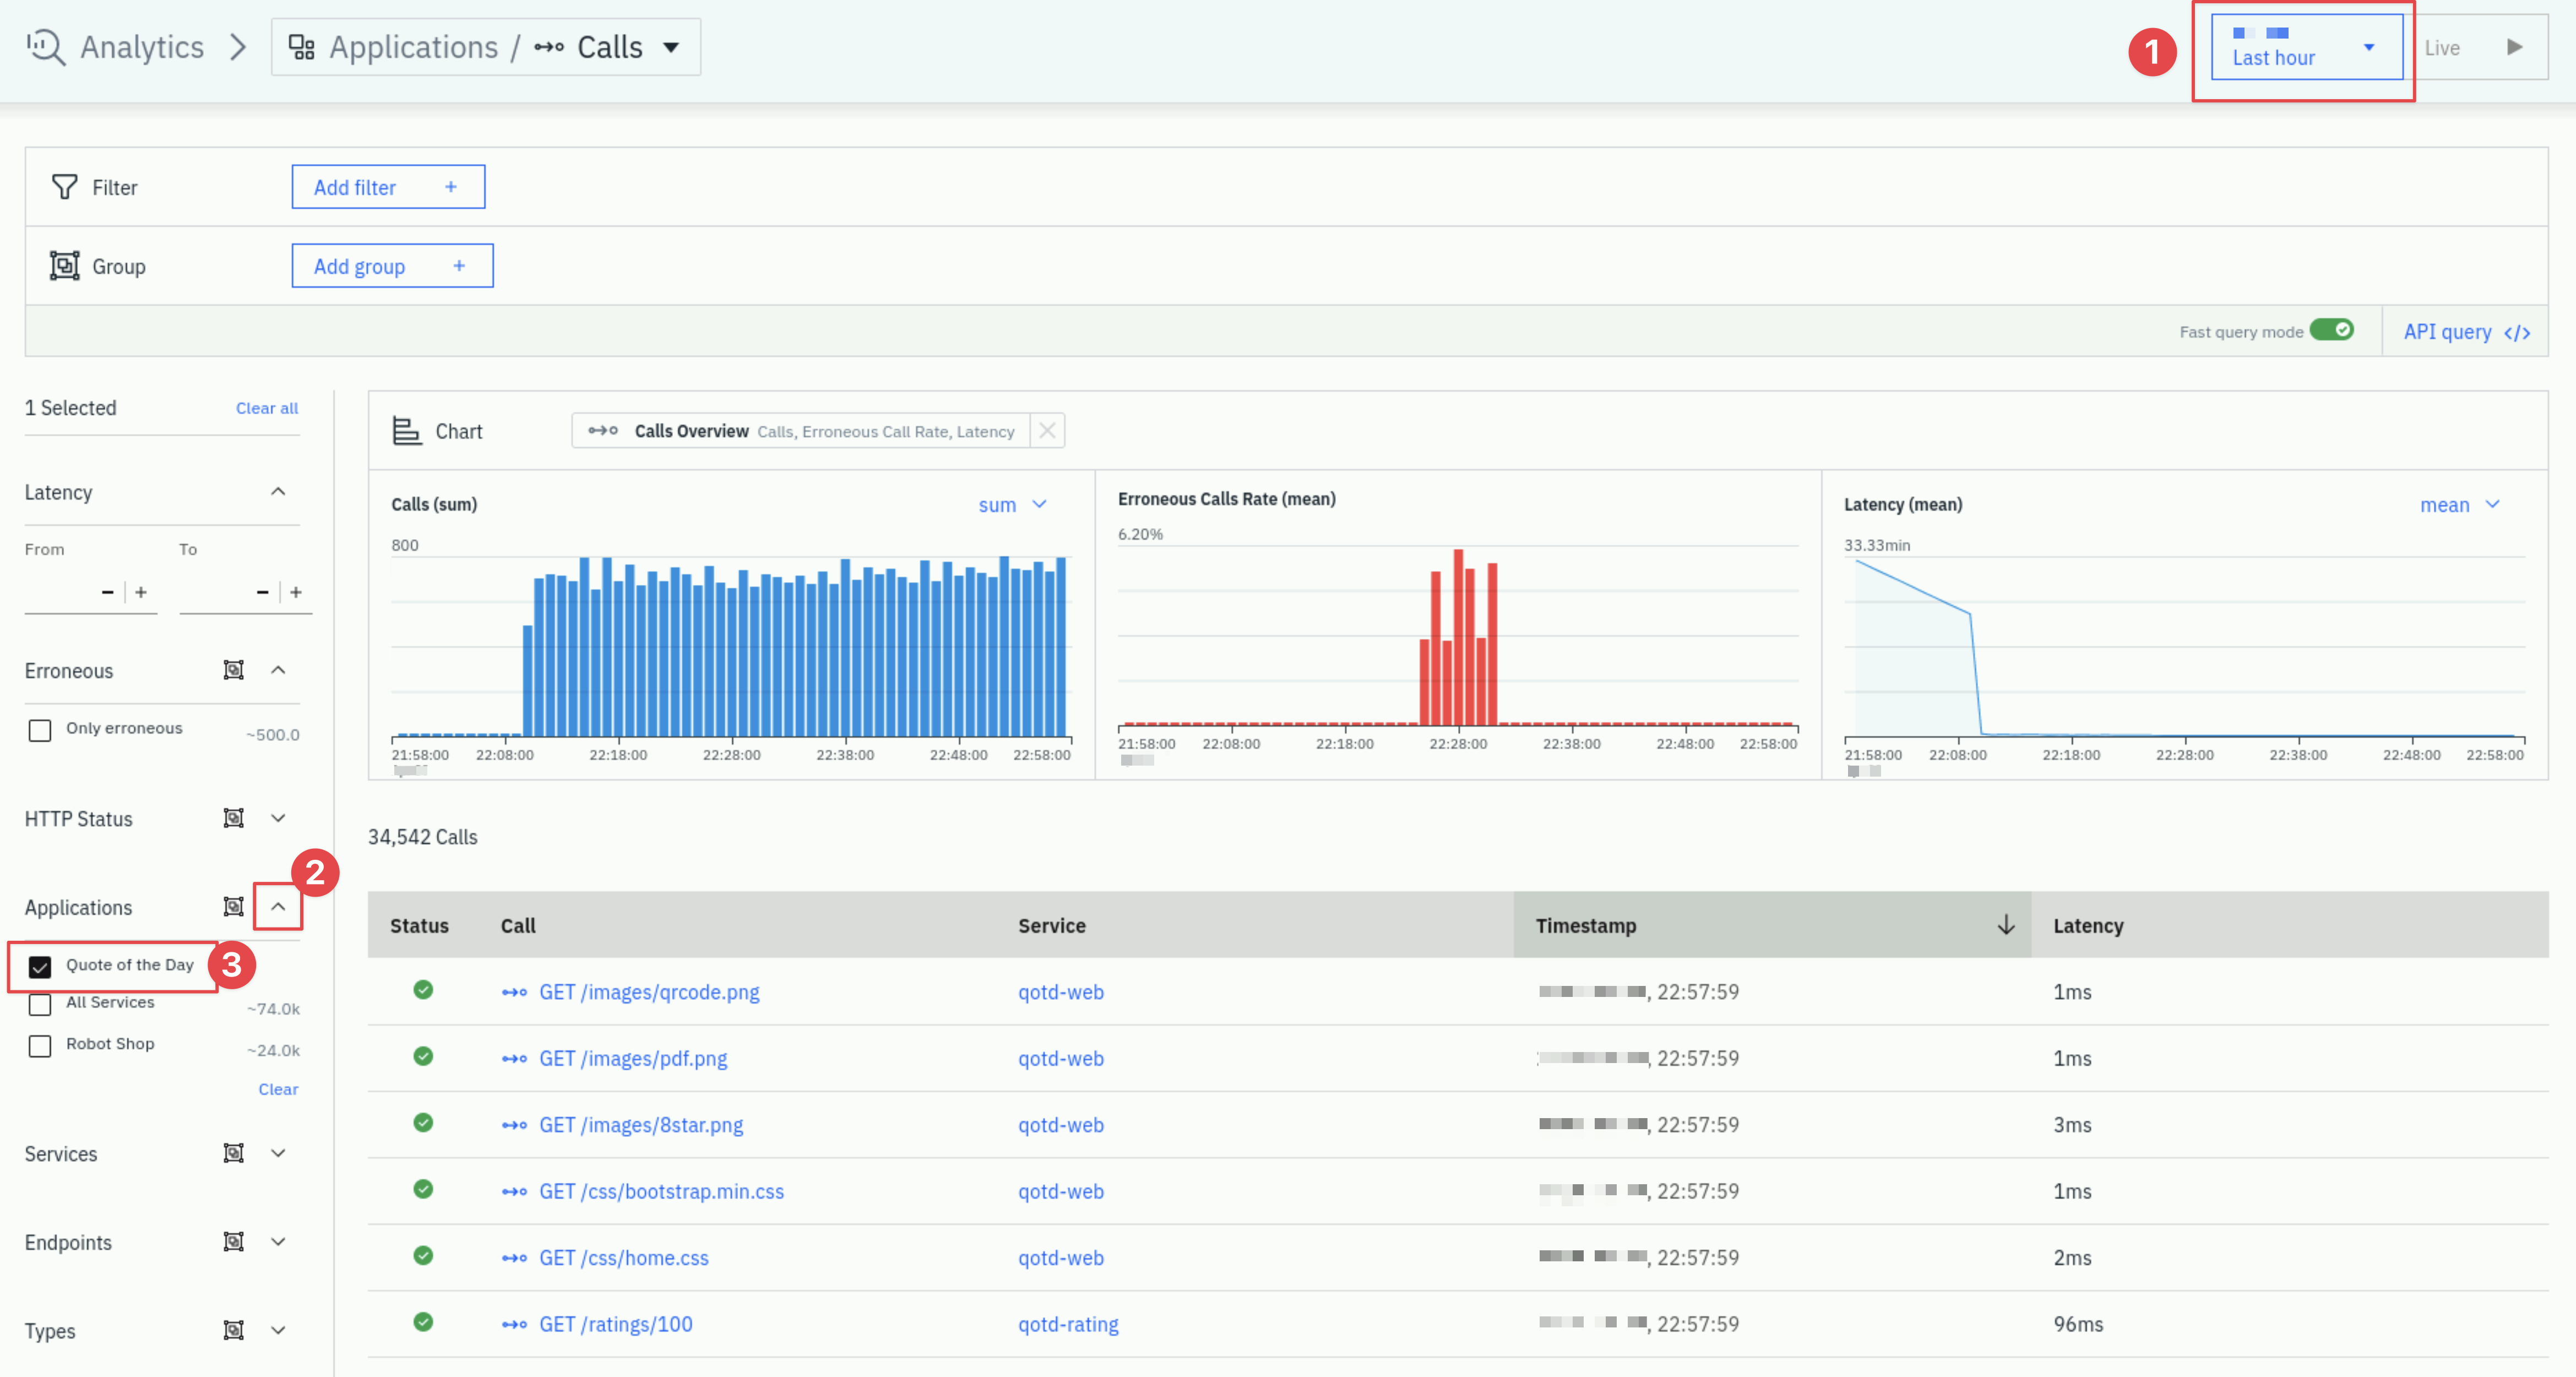
Now, uncheck the checkbox to remove the filter.
Another option is to use the filter and group options at the top of the page. Let's try out an example. Let's say you want to find the slowest SQL statements in the environment. Let's try to implement a filter and group to accomplish that.
Select the Add Filter button at the top of the page. Then, select Call Type and select Database

This will filter the calls to just the database calls. But, the calls are not organized in a meaningful way. So, let's use the group option to group the statements.
Click on the Add Group button. Then, type database in the filter box and select Statement
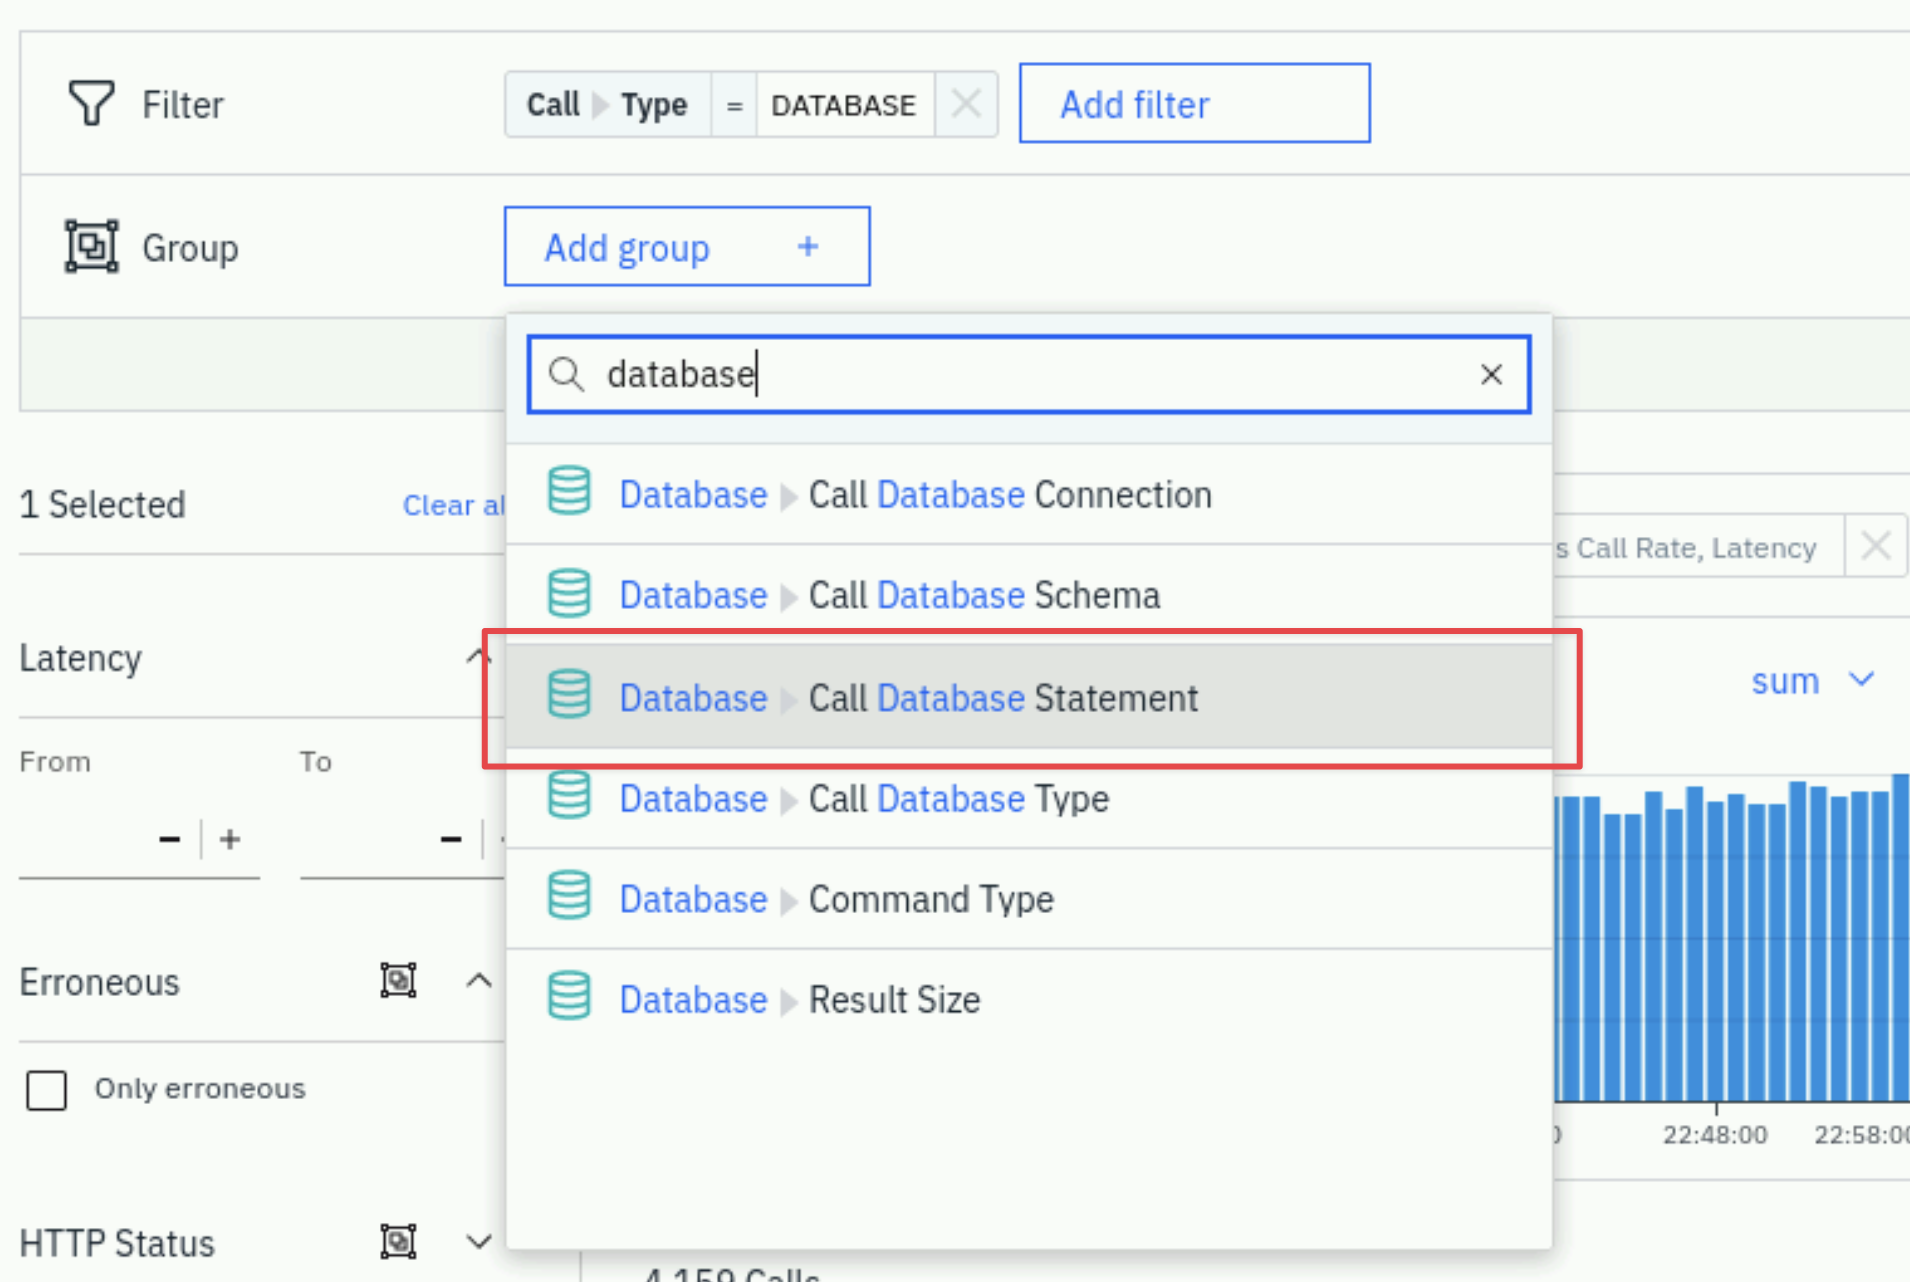
This will group all of the Database statements by unique SQL statements. You can then take these statements and sort them by latency, erroneous calls, etc.
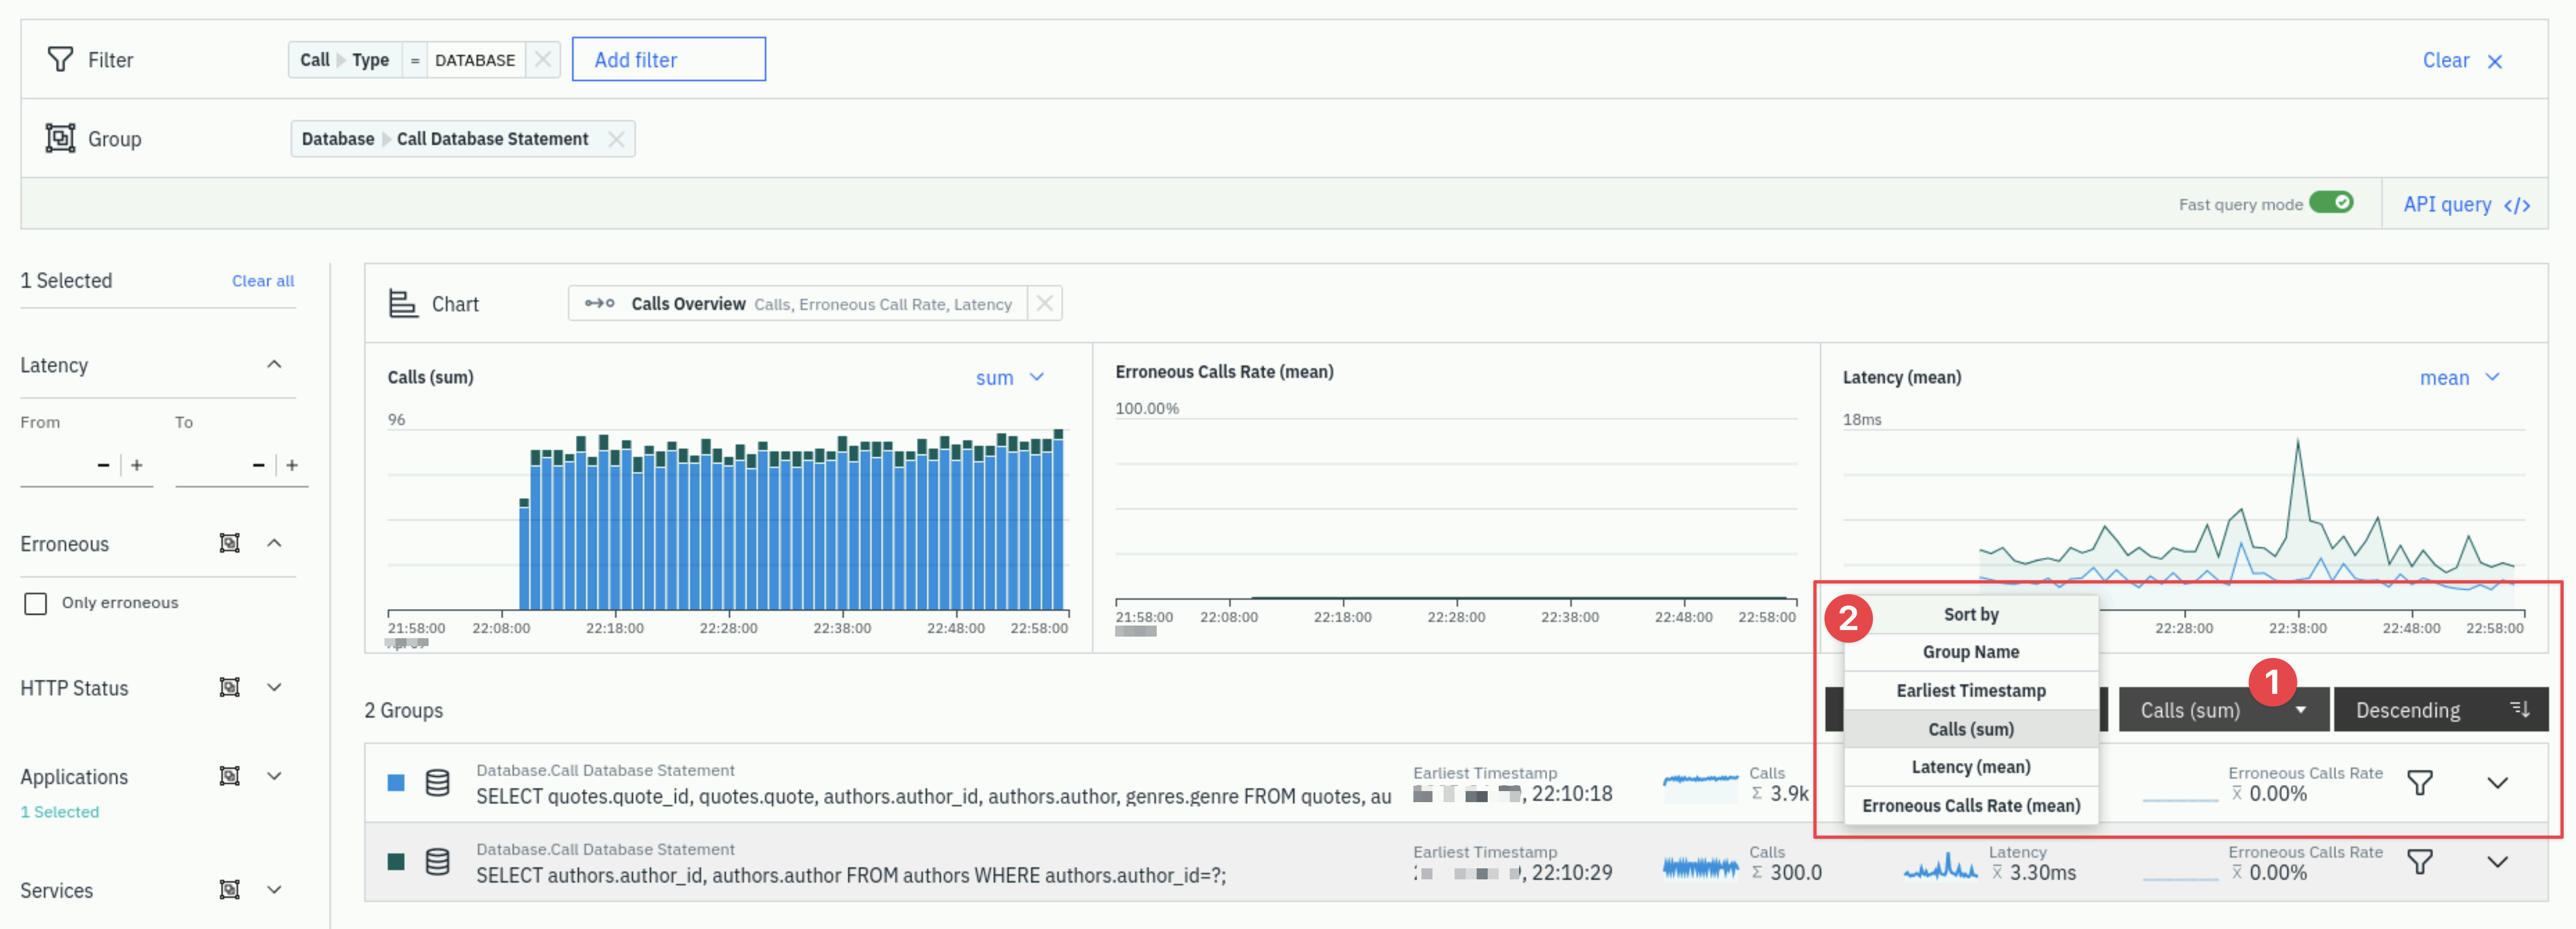
You also have the option select metrics to choose the metrics that you want to see on the screen. For example, change latency from Average to 95th percentile.
3.8: Sharing Instana URLs
Let's explore one more key capability within Instana.
In the upper right corner of the screen, there is a Share button.
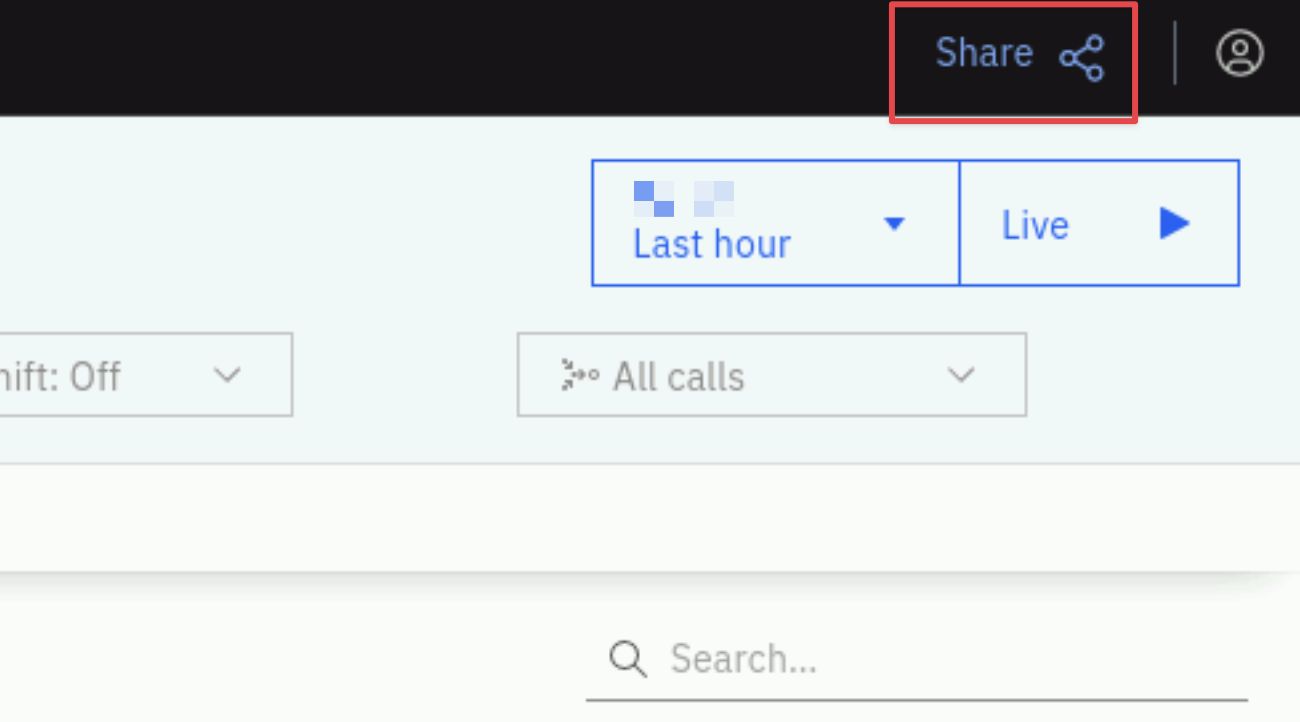
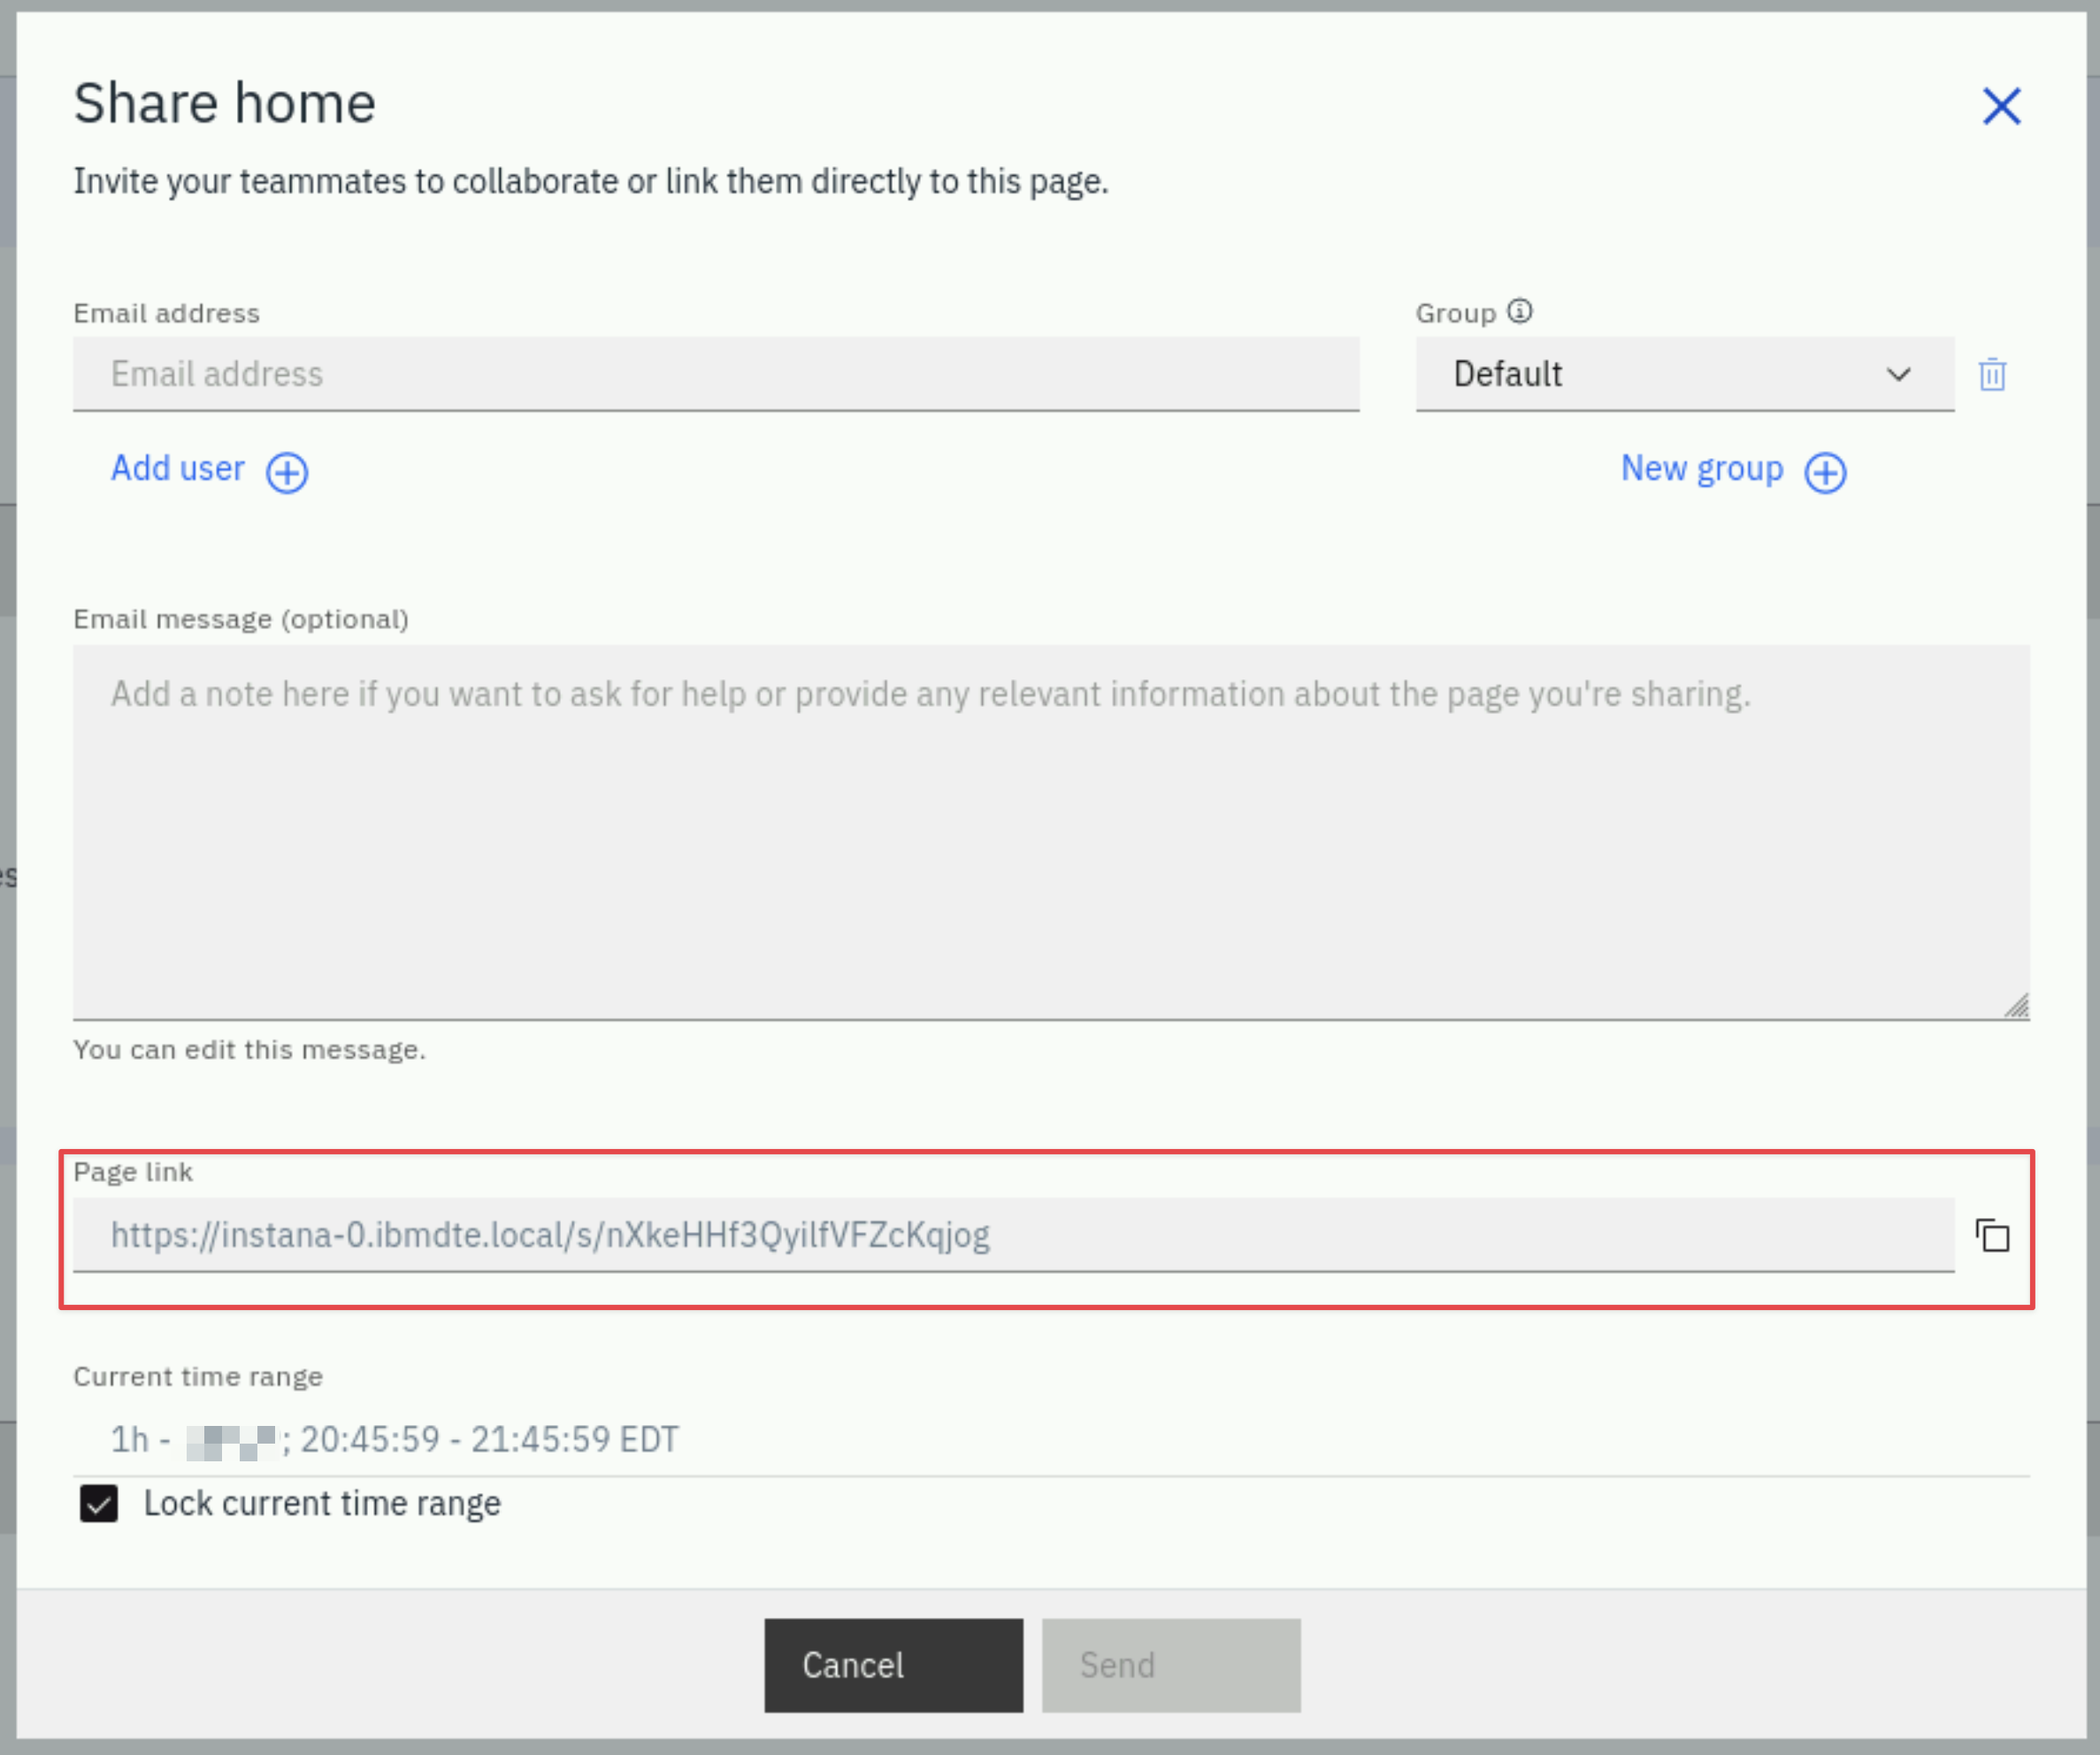
Click Share and a dialog will open.
From here you can share a link that includes your current context so that when the recipient opens the link, it will take them to a screen with the exact same view you are seeing. This can be very valuable when collaborating with team members to diagnose a problem.
Within the dialog, there is also a checkbox to Lock current time range. By locking the current time range, when the link it opened, it will take the person to a view with the exact same time range that you are looking at. Otherwise, they are taken to the most recent time range.
3.9: Summary
In this exercise lab have explored some of the key capabilities within Instana. You explored Kubernetes monitoring and the Infrastructure view. You also created two Application Perspectives for two different demo applications. You learned about website monitoring and the different types of End User Monitoring data that Instana can collect. Finally, you reviewed Instana unbounded analytics capabilities.