Explore Instana and OpenTelemetry traces
Once the Instana and OpenTelemetry Demo Application are in sync, you can start exploring the captured data. This synchronization allows you to delve into the rich telemetry data collected from your microservices. You can analyze various metrics, traces, and logs to gain insights into the performance and behavior of your application.
The Instana dashboard provides a comprehensive view of the data, enabling you to identify performance bottlenecks, monitor resource utilization, and track the flow of requests across different services.
By examining the detailed traces, you can pinpoint the root causes of issues, optimize your application's performance, and ensure a seamless user experience.
Additionally, the correlation of OpenTelemetry data with the underlying infrastructure helps you understand the impact of infrastructure changes on your application, facilitating proactive management and troubleshooting.
5.1 OpenTelemetry tracing
Tracing in OpenTelemetry is a fundamental concept that involves tracking the execution of transactions or workflows through multiple distributed systems. It provides visibility into how requests propagate through services, helping to identify performance bottlenecks, latency issues, and errors.
Key aspects of tracing in OpenTelemetry:
- Spans and Traces: A trace represents the entire journey of a request through the system, while spans are individual units of work within that trace. Each span includes metadata such as timestamps, service names, and operation names, allowing you to see the complete path of a request
- Context Propagation: OpenTelemetry uses context propagation to maintain trace continuity across different services and components. This ensures that all spans within a trace are linked together, providing a coherent view of the request's journey
5.2 Exploring Instana
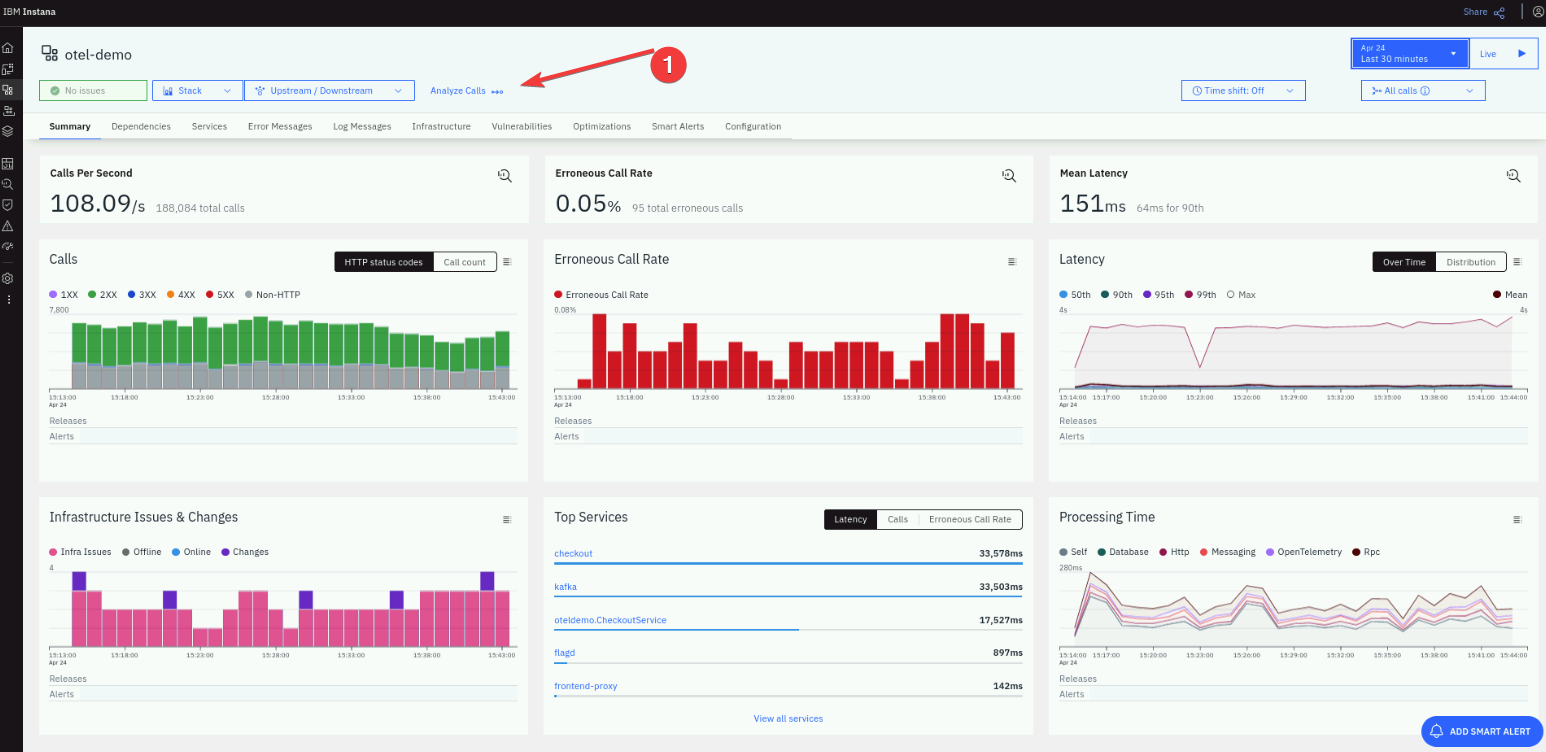
Let's open the newly created Application Perspective "Otel-demo" and click on the "Analyze calls" at the top of the screen as presented on the picture below
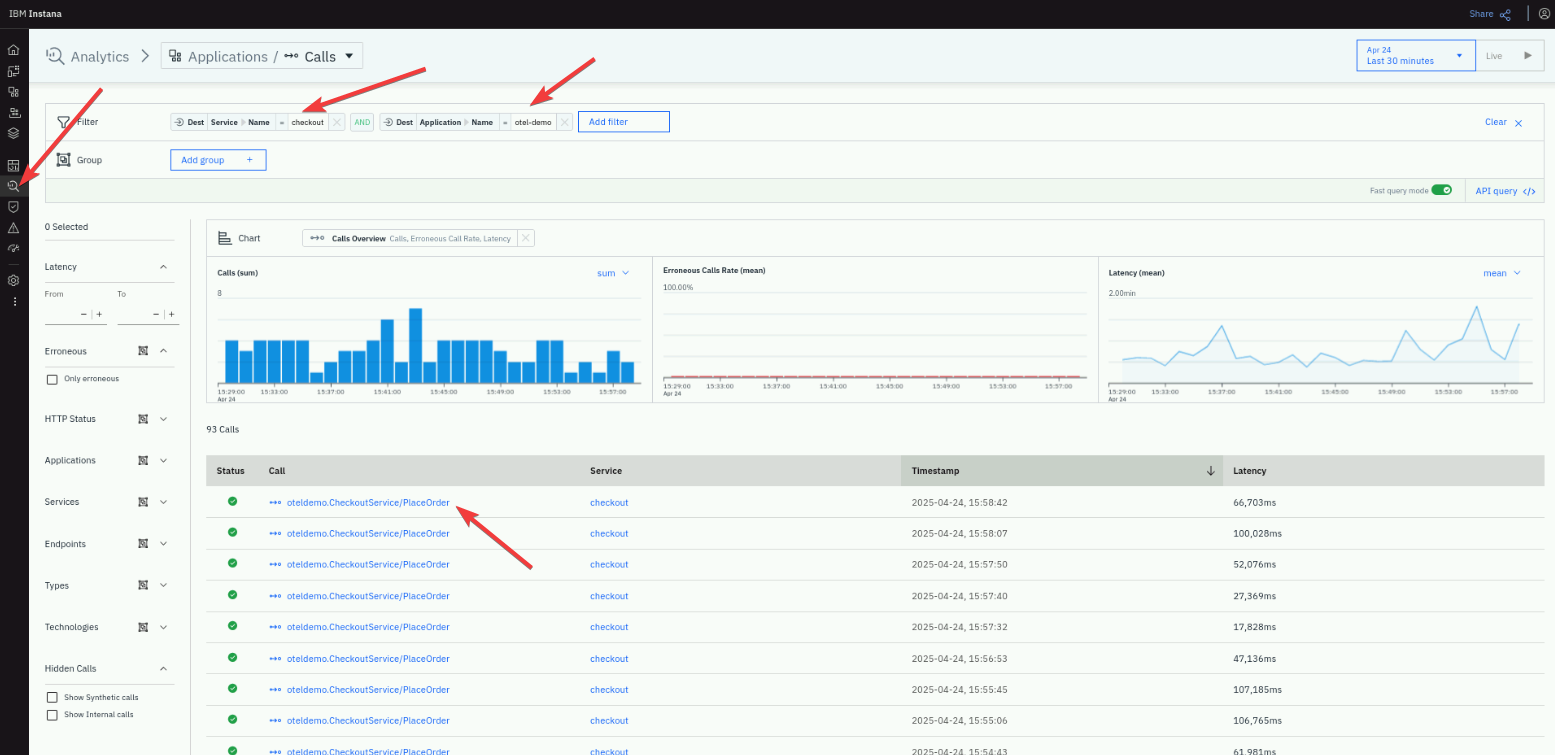
You will be taken to the Analytics view, with populated filters, narrowing down calls to Otel-demo application only.
You can now filter calls and search only within these results, which meet specific criteria:
- Application name:
otel-demo - Service name:
checkout
Click on the call link to see the transaction details.
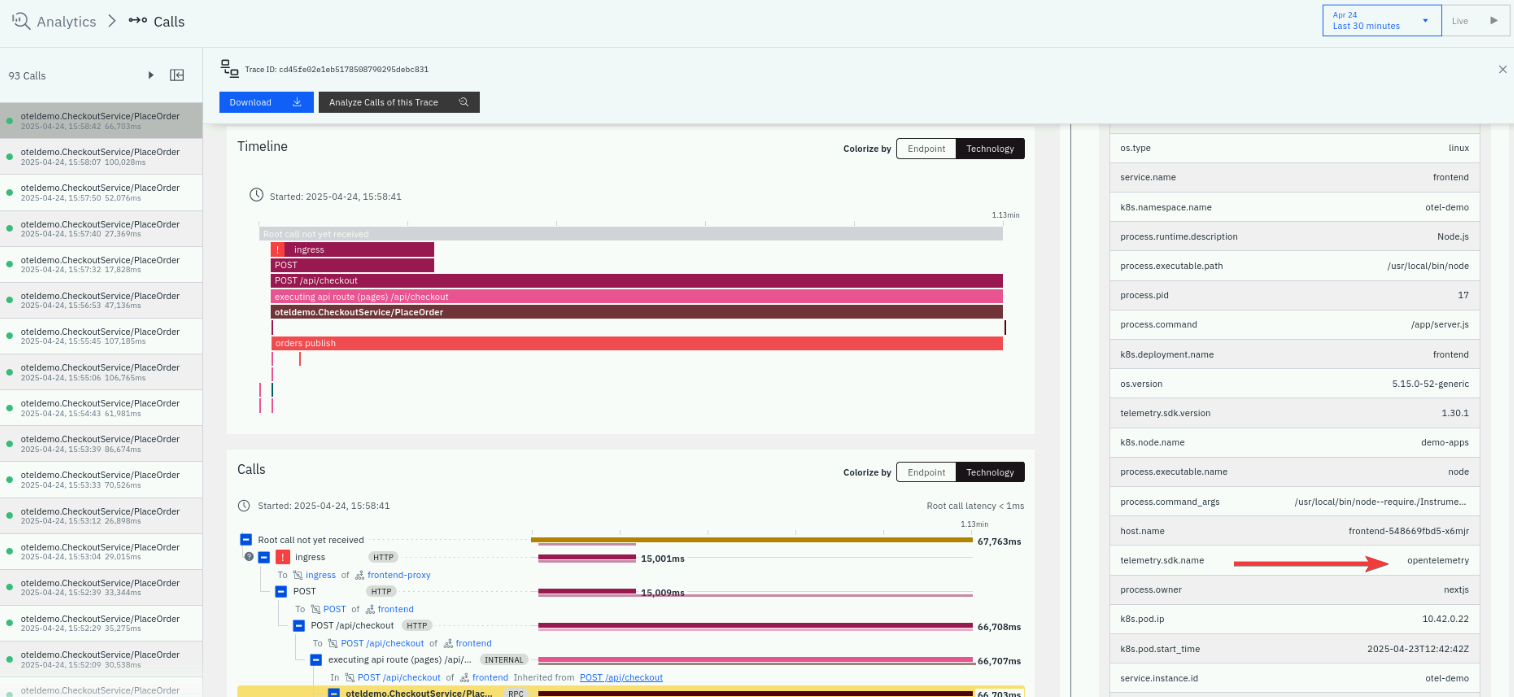
In the detailed view of the call, please take a look at the right side of the screen. You will find there a list of attributes captured by Instana. One of them is called "telemetry.sdk.name" with a value "opentelemetry", which proves that the content is coming from the OpenTelemetry tracer.
5.3 Instana and OpenTelemetry combined
Instana can combine traces coming from applications instrumented by OpenTelemetry and Instana infrastructure metrics delivered by the Instana agent. Please follow the below instructions to find an example of such transaction in your environment.
Using the trace from the previous example (the "checkout" service), please navigate to the right side of the screen and scroll to the bottom of the page. You will then find an "Infrastructure" view, with a full path beginning from the host, the platform, the pod, namespace, resource, etc.
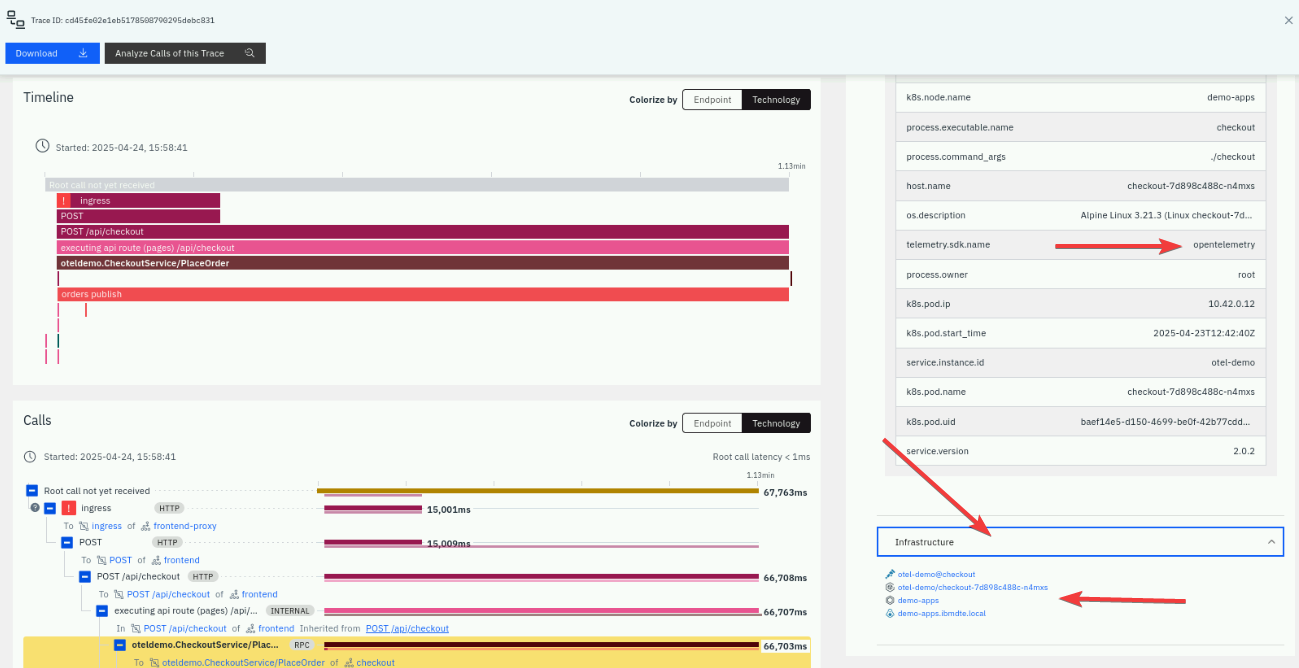
The above example proves the Instana can combine traces from OpenTelemetry and Instana infrastructure data within the same screen under one transaction ID. The Node details are coming from the Instana Agent and the rest od the Infrastructure data is coming from the Instana k8sensor.
K8sensor is a part of the Instana Agent Kubernetes monitoring solution. Read more about the sensor here https://www.ibm.com/docs/en/instana-observability/1.0.294?topic=instana-monitoring-kubernetes#kubernetes-sensors
Instana can combine Instana's proprietary traces and OpenTelemetry traces into a single end-to-end trace.
OpenTelemetry tracing - code examples
This section is here for informational purposes. There are no steps to execute.
If you wish to use OpenTelemetry in your application, here is the example snippet which shows, how to build the proper instrumentation.
use OpenTelemetry\API\Common\Instrumentation\Globals;
use OpenTelemetry\API\Trace\Span;
use OpenTelemetry\API\Trace\SpanKind;
use Psr\Http\Message\ResponseInterface as Response;
use Psr\Http\Message\ServerRequestInterface as Request;
use Slim\App;

function calculateQuote($jsonObject): float
{
    $quote = 0.0;
    $childSpan = Globals::tracerProvider()->getTracer('manual-instrumentation')
        ->spanBuilder('calculate-quote')
        ->setSpanKind(SpanKind::KIND_INTERNAL)
        ->startSpan();
    $childSpan->addEvent('Calculating quote');

    try {
        if (!array_key_exists('numberOfItems', $jsonObject)) {
            throw new \InvalidArgumentException('numberOfItems not provided');
        }
        $numberOfItems = intval($jsonObject['numberOfItems']);
        $quote = round(8.90 * $numberOfItems, 2);

        $childSpan->setAttribute('app.quote.items.count', $numberOfItems);
        $childSpan->setAttribute('app.quote.cost.total', $quote);

        $childSpan->addEvent('Quote calculated, returning its value');
    } catch (\Exception $exception) {
        $childSpan->recordException($exception);
    } finally {
        $childSpan->end();
        return $quote;
    }
}

return function (App $app) {
    $app->post('/getquote', function (Request $request, Response $response) {
        $span = Span::getCurrent();
        $span->addEvent('Received get quote request, processing it');

        $jsonObject = $request->getParsedBody();

        $data = calculateQuote($jsonObject);

        $payload = json_encode($data);
        $response->getBody()->write($payload);

        $span->addEvent('Quote processed, response sent back', [
            'app.quote.cost.total' => $data
        ]);

        return $response
            ->withHeader('Content-Type', 'application/json');
    });
};
Please note the use of OpenTelemetry/API and further use of the span builders.
5.4 OpenTelemetry as out-of-the-box observability
More and more middleware platforms are embedding OpenTelemetry tracing capabilities to provide out-of-the-box observability. For example, IBM MQ now supports OpenTelemetry to trace message flows across queues and topics, helping teams monitor message delivery latency and identify processing delays.
IBM App Connect Enterprise (ACE) integrates OpenTelemetry to trace message flows through integration nodes and flows, offering visibility into how data transformations and routing decisions are made.
Similarly, IBM DataPower Gateway includes OpenTelemetry support to trace API calls and security processing, which is crucial for understanding performance and enforcing compliance in API-driven architectures.
These integrations allow organizations to gain deep insights into complex, hybrid environments without needing to manually instrument every component, accelerating troubleshooting and improving system reliability.
5.5 Summary
In this section, you've learnt that Instana can easily represent merged data collected from OpenTelemetry and Instana native agent.