OpenTelemetry
OpenTelemetry is an open-source observability framework with a collection of software development kits (SDKs), vendor-neutral or vendor-agnostic APIs, and tools for instrumentation. This technology can generate, collect, export, and instrument telemetry data to analyze your platform's behavior and performance. OpenTelemetry, also known as OTel, is designed to provide comprehensive insights into distributed systems, making it easier to monitor and troubleshoot complex applications. By standardizing the way telemetry data is collected and processed, OpenTelemetry helps ensure consistency and interoperability across different platforms and tools.
One of the key advantages of OpenTelemetry is its flexibility and extensibility. Developers can integrate it with various back-end systems and observability tools, allowing them to tailor their monitoring solutions to specific needs. Additionally, OpenTelemetry supports multiple programming languages, making it accessible to a wide range of developers and applications.
OpenTelemetry is included in the Instana license, meaning users can leverage its powerful capabilities without incurring additional costs. This integration simplifies the process of setting up observability for applications monitored by Instana, providing a seamless experience for users looking to enhance their performance monitoring and troubleshooting capabilities.
3.1 OpenTelemetry instrumentation
For the purpose of this lab, we will use the OpenTelemetry Demo Application. The source code is available here.
The OpenTelemetry Demo Application is a microservice-based application designed to showcase the seamless integration with an Instana backend. This demo highlights the capabilities of Instana in collecting OpenTelemetry data, correlating OpenTelemetry tracing with the underlying monitored infrastructure, and demonstrating trace continuity between Instana tracing and OpenTelemetry.
The OpenTelemetry Demo Application has already been installed for you in the lab environment, providing a ready-to-use setup for exploring its features. To enable OpenTelemetry in the Instana agent, we will follow these steps:
- Configure the Instana Agent: Ensure the Instana agent is properly configured to collect OpenTelemetry data.
- Instrument Your Application: Integrate OpenTelemetry SDKs into your application code to start generating telemetry data. This includes adding tracing and metrics instrumentation to capture relevant data points.
- Verify Data Collection: Check that the Instana agent is successfully collecting and correlating OpenTelemetry data. Use Instana's dashboard to monitor the incoming telemetry and ensure trace continuity.
- Analyze and Optimize: Utilize Instana's analytics tools to analyze the collected data, identify performance bottlenecks, and optimize your application's performance based on the insights gained.
By following these steps, you can fully leverage the capabilities of OpenTelemetry and Instana to achieve robust monitoring and observability for your microservice-based applications.
3.2 OpenTelemetry signals
OpenTelemetry signals are the core components used to capture and represent telemetry data from software systems, enabling observability into their behavior and performance. These signals come in three primary forms: traces, metrics, and logs.
- Traces provide insight into the flow of requests through distributed systems, helping identify bottlenecks and latency issues.
- Metrics offer numerical data about system performance, such as CPU usage, request counts, or error rates, which are essential for monitoring and alerting.
- Logs contain timestamped records of events that occur within a system, useful for debugging and auditing.
Together, these signals form a view of system health and performance, allowing developers and operators to detect, diagnose, and resolve issues more effectively. OpenTelemetry standardizes the collection and export of these signals, making it easier to integrate with various observability tools.
Instana is capable of monitoring OpenTelemetry tracing, metrics, and logs. The lab is going to focus on tracing and logs.
3.3 Enable OpenTelemetry in Instana agent
By default, the OpenTelemetry data ingestion in the Instana host agent is activated. There are no actions which you need to take in order to enable the data ingestion. The example of a configuration.yaml with the manually enabled OpenTelemetry ingestion looks like below
com.instana.plugin.opentelemetry:
  grpc:
    enabled: true
  http:
    enabled: true
You can confirm, the Instana agent is waiting for the data by checking, if the agent is exposing Otel standard ports - 4317 and 4318. In order to check it, please run
the below command against the demo-apps K3S cluster:
kubectl get services -n instana-agent
You should be able to see a similar response to the one presented below:
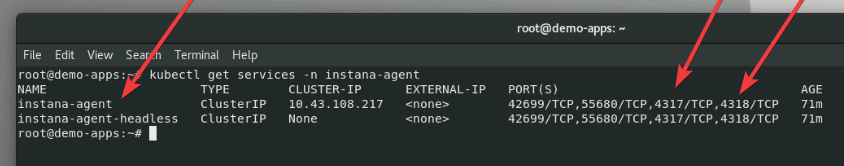
For more details, please check the Instana agent documentation.
3.4 Verify OpenTelemetry Demo Application state
Let's find out if the OpenTelemetry Demo Application pods are up and healthy by running the below command:
kubectl get pods -n otel-demo
You should be able to see similar results as shown below:
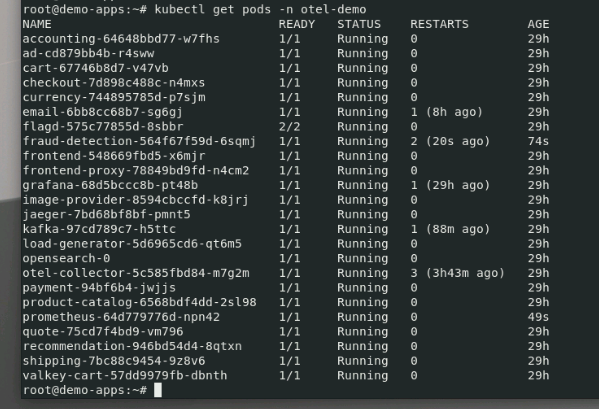
Having pods in a RUNNING state will ensure the OpenTelemetry Demo
Application is working.
In case some of the pods are in a non-running state, try to restart them using the below command:
kubectl delete pod <REPLACE-WITH-POD-NAME> -n otel-demo
3.5 Verify OpenTelemetry Demo Application configuration
As stated in the beginning of this lab, the Demo application has already been pre-configured to work with the Instana agent. Let's see an example location of the configuration, where you can see, how the link between application and Instana agent looks like.
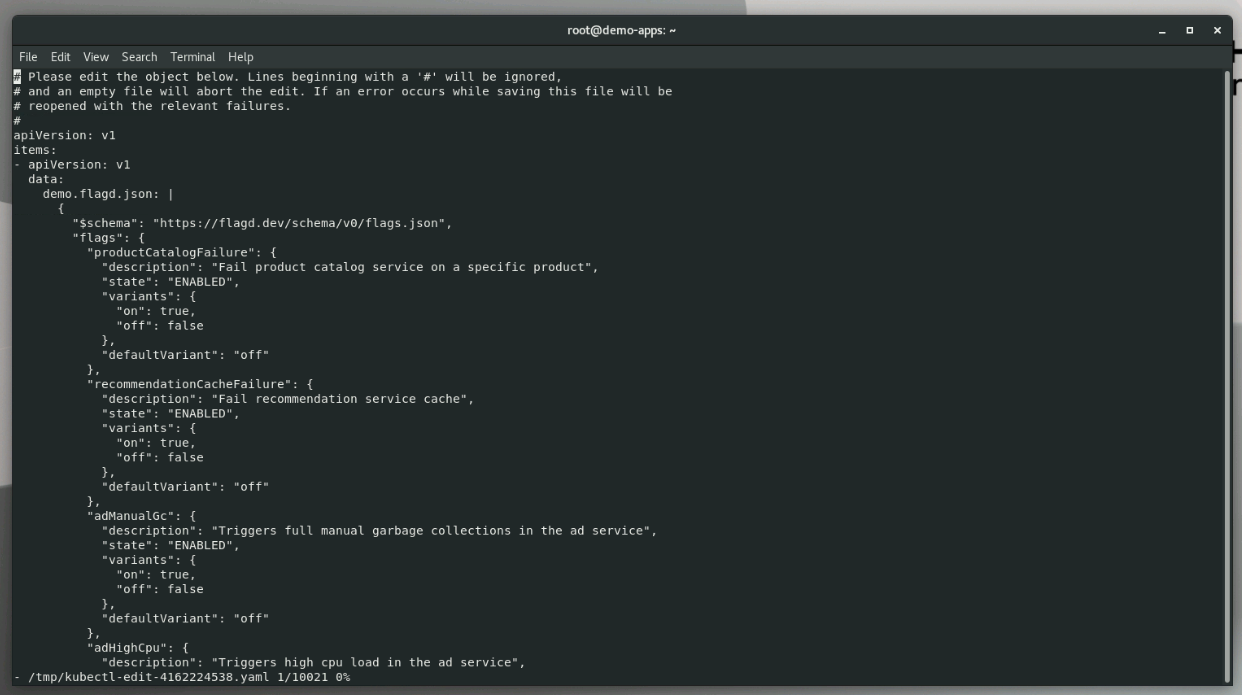
Let's check what the OpenTelemetry Demo application configmap looks like by
running this command:
kubectl edit configmap -n otel-demo
As a result, you will see a long configuration file with all of the application-specific settings.
Now, let's find the port 4317 which we already know, the agent is waiting for
the OpenTelemetry data. Search the file by typing the below command:
?4317
and then hit n for the next result, you should see a direct link to an Instana
agent port 4317 configured within the configmap:
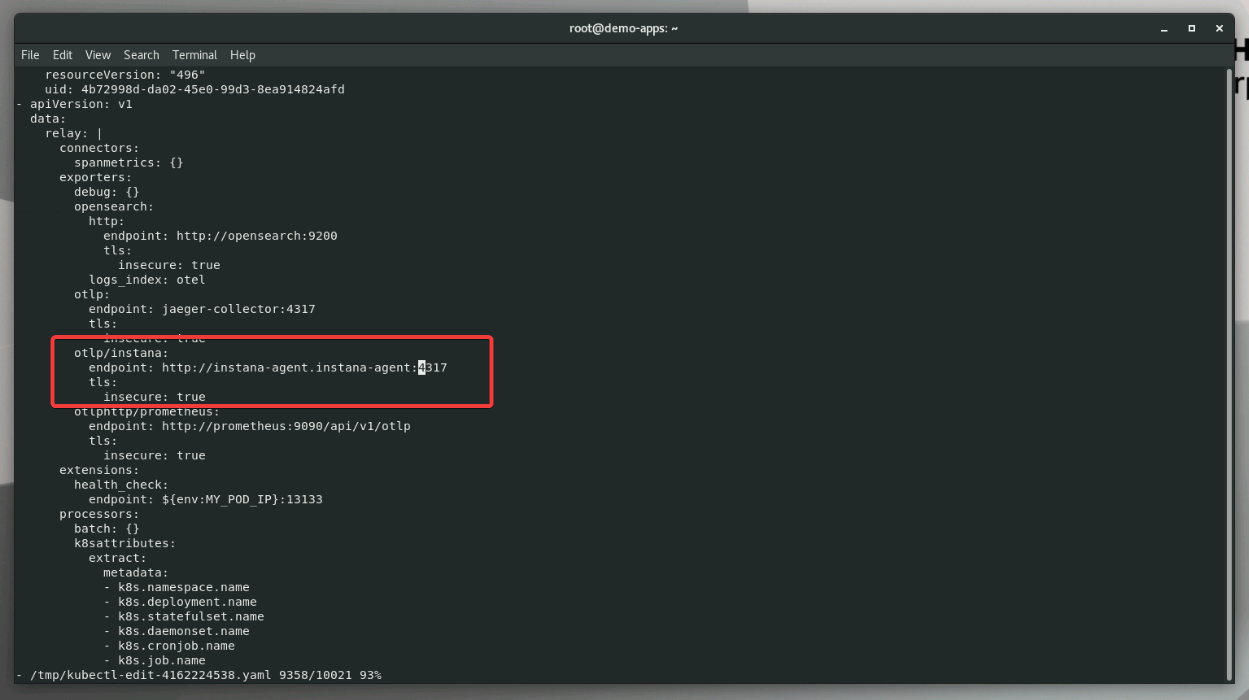
This is the confirmation that the OpenTelemetry Demo Application was configured
to send OpenTelemetry data to the Instana agent on port 4317.
You can now close the configmap by hitting ESC and typing
:q!
3.6 Verify OpenTelemetry Demo Application live state
Your instance of OpenTelemetry Demo Application is available under the https://otel-demo.apps.demo-apps.ibmdte.local. Let's use a browser to open that page. Please note the https in the address bar. Also, do not worry about the security message - accept the self-signed certificate.
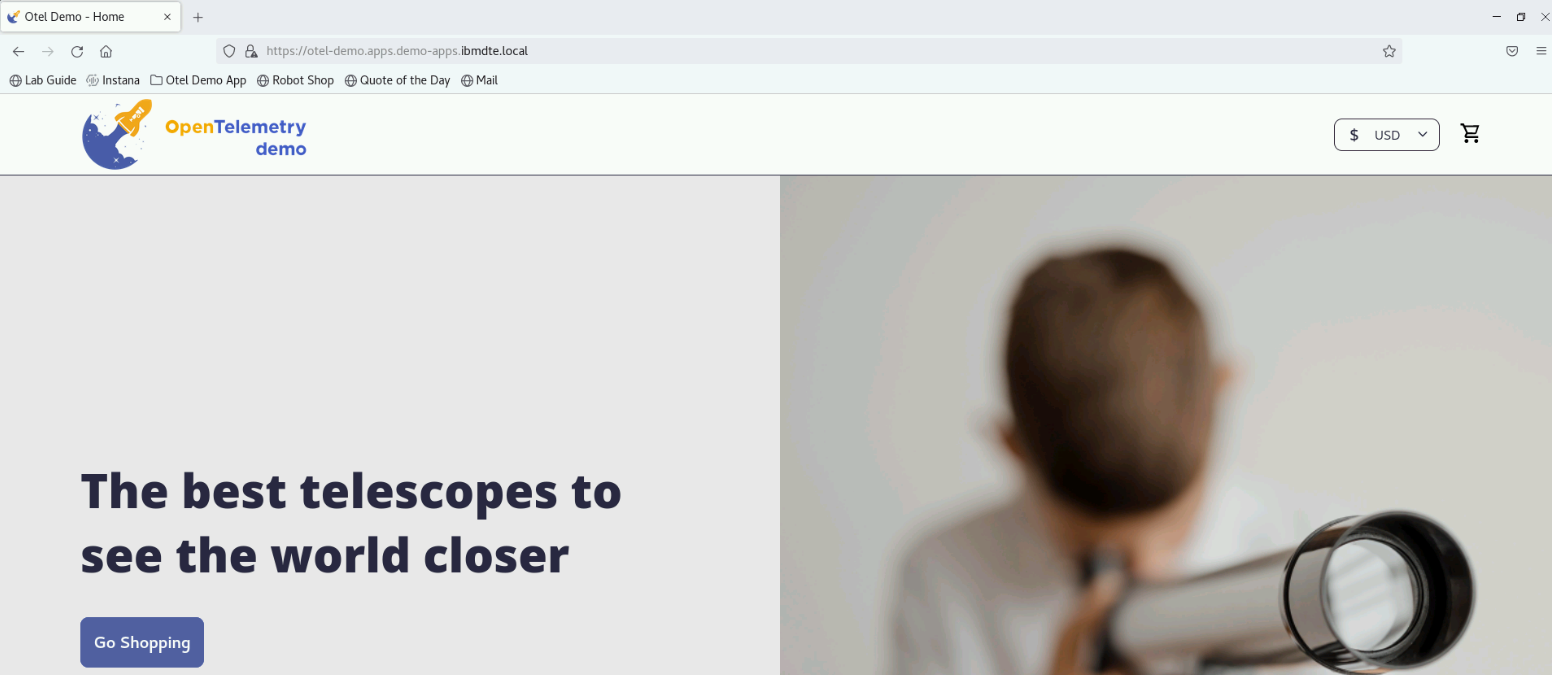
If you are able to see the page presented within the above picture, it means the application is up and delivering content correctly.
3.7 Summary
So far you have been able to accomplish the following:
- Have installed the Instana agent on the
demo-appscluster. - Have the the agent accepting the OpenTelemetry data on ports
4317and4318. - Have the OpenTelemetry Demo Application installed on the cluster.
- Have the demo application configured to send OpenTelemetry data to the
agent's hostname on port
4317. - Have the demo application accessible in the browser.
Now, it's time to move to the next step, please continue to the next section of the lab.