OpenTelemetry Collector
Besides the application metrics and traces, OpenTelemetry standard also supports ingesting logs content. In this scenario, you will learn how to deliver custom logs to the Instana backend using OpenTelemetry Collector Contrib.
The OpenTelemetry Collector offers a vendor-agnostic implementation of how to receive, process and export telemetry data. It removes the need to run, operate, and maintain multiple agents/collectors. This works with improved scalability and supports open source observability data formats (e.g. Jaeger, Prometheus, Fluent Bit, etc.) sending to one or more open source or commercial backends. The local Collector agent is the default location to which instrumentation libraries export their telemetry data.
OpenTelemetry collector objectives:
- Usability: Reasonable default configuration, supports popular protocols, runs and collects out of the box.
- Performance: Highly stable and performant under varying loads and configurations.
- Observability: An exemplar of an observable service.
- Extensibility: Customizable without touching the core code.
- Unification: Single codebase, deployable as an agent or collector with support for traces, metrics, and logs.
In this lab, we will be using OpenTelemetry Collector Contrib, which source-code can be found here.
6.1 Instana backend - configuration
Depending on when you are executing this lab, Logging is setup as an optional feature and it's not enabled by default. The log collection via the runtimes is collected by default. If you want OpenTelemetry base logging, you need to enable the feature flag.
Let's enable that feature, by following these steps:
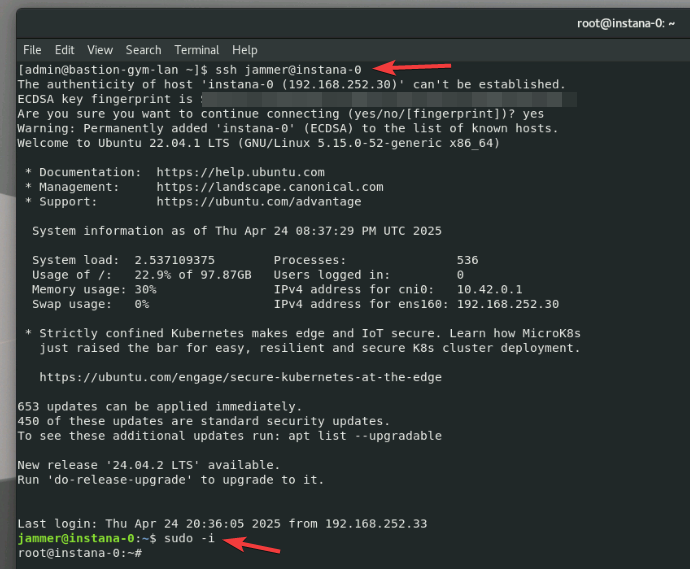
Use the ssh terminal and login to the instana backend server
ssh jammer@instana-0
and then switch to the root user
sudo -i
as presented in the below screen
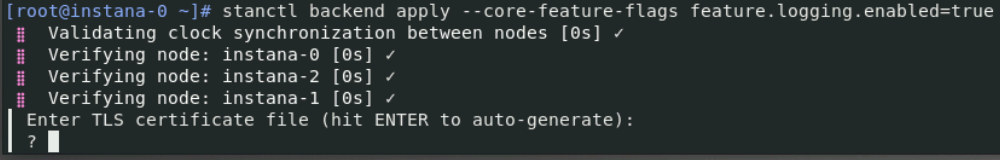
Enable the logging feature by running the below command
stanctl backend apply --core-feature-flags feature.logging.enabled=true
after applying the command, Instana will ask about the TLS certificate, please hit enter to accept the default certificate
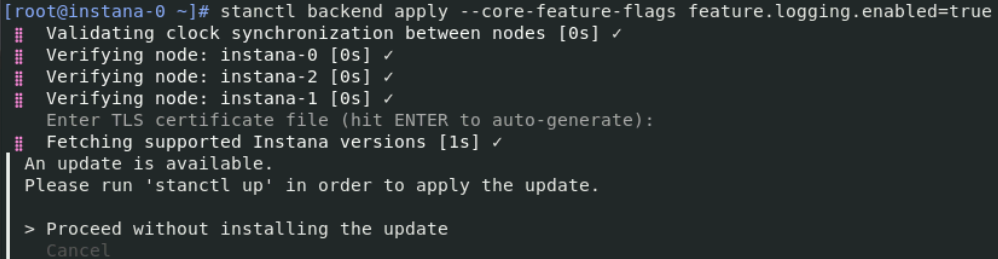
after applying the command, Instana will ask about update options. In this lab, we are NOT going to update Instana, so please select "Proceed without installing the update"
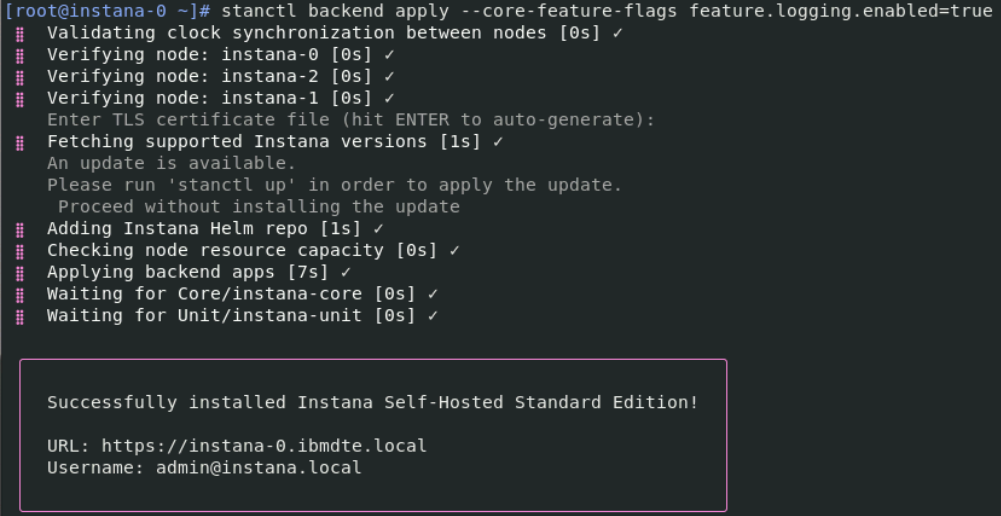
finally, Instana should return confirmation the additional feature was updated correctly
you can close this terminal window by running the below command:
exit
Please note, the Logging feature accepting the OpenTelemetry custom logs require License Add-on
For the Instana SaaS, additional logging licenses need to be purchase
For the Instana self-hosted there is no add-on charge for short-term log collection
In both cases, you need to update the license.
Please read and follow these instructions.
6.2 Instana backend - verification
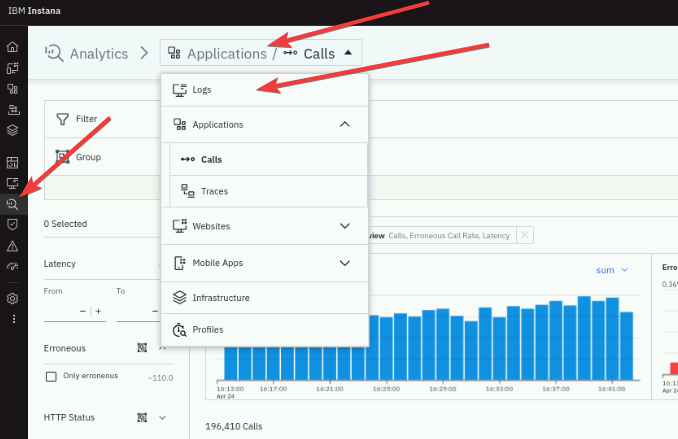
After applying backend changes, please navigate to the Instana UI and refresh the page (use button F5). After refreshing, please open Instana UI / Analytics / Logs - if the Logs section is visible, it means the Instana backend is ready to accept the OpenTelemetry log content. Please confirm your Instana instance with the below screenshot
6.3 Instana agent - configuration
In this scenario, you will configure OpenTelemetry Collector to send OpenTelemetry data to Instana backend through the Instana agent. First, you need to make sure, the Instana agent is up and running on the "bluebox" host.
The agent was pre-installed into your Lab environment.
Open a new terminal window and login to the "bluebox" host using the below command:
ssh jammer@bluebox
and then let's switch to the root user
sudo -i
Please run the following command to start the agent on "bluebox" host:
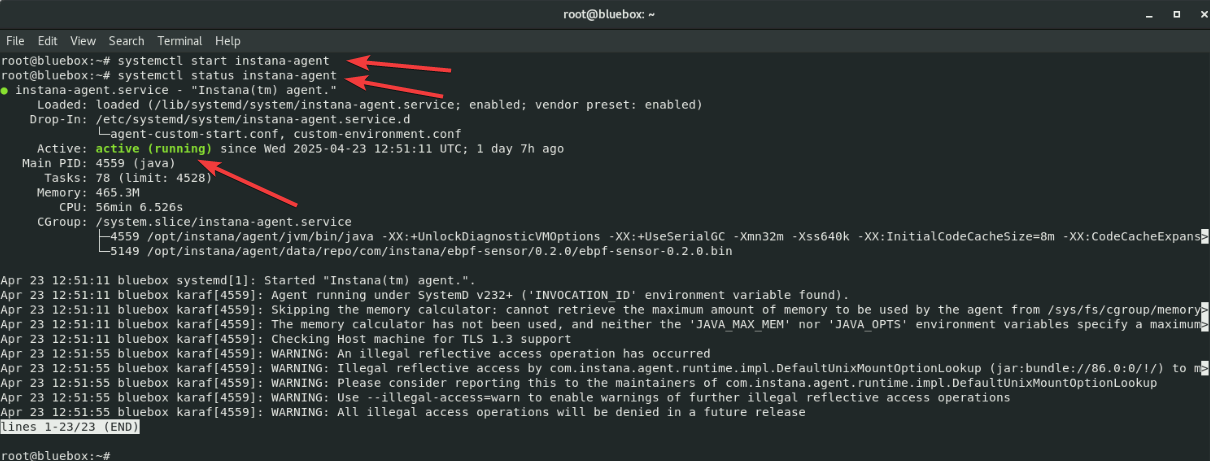
systemctl start instana-agent
After a moment, please check the status of the recently started agent by typing below command
systemctl status instana-agent
The response should indicate, that the agent is up and running as in the below screen
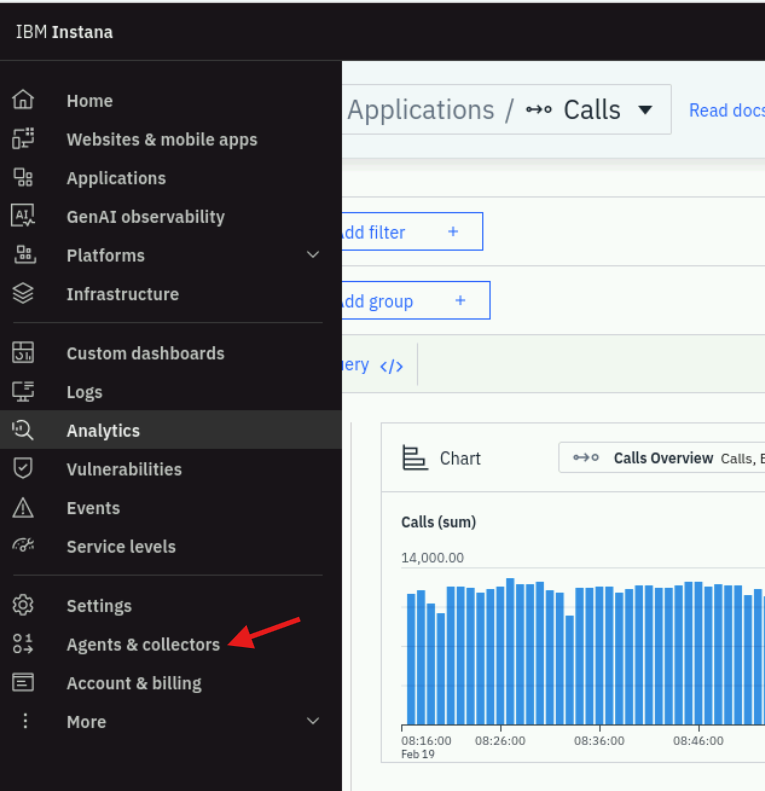
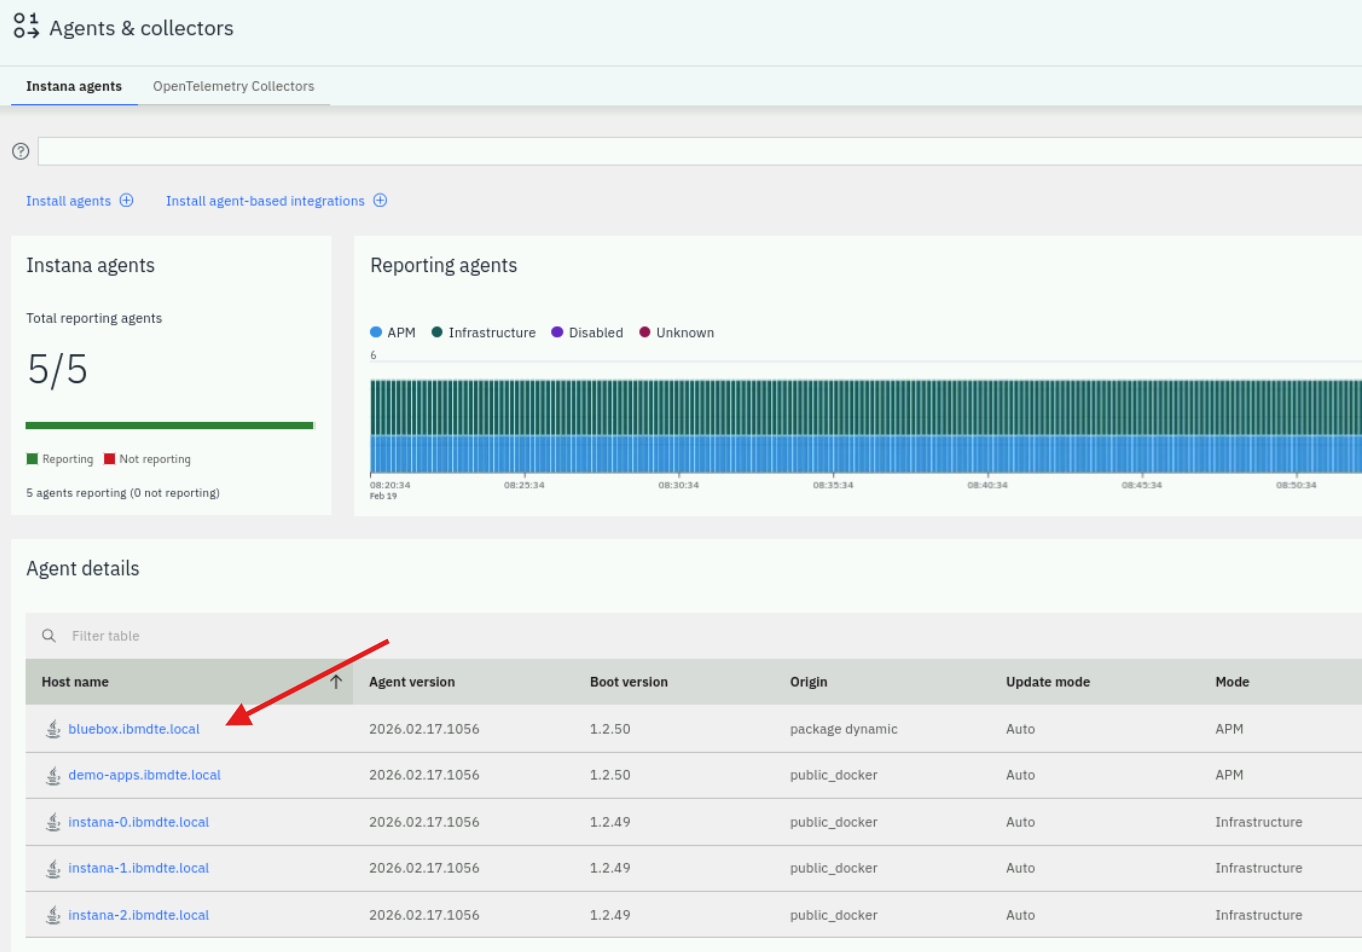
After few minutes, please check the Instana UI and confirm the new agent is reporting data to the Instana backend. Hover over main menu on the left and select Agents & collectors. screen below with the agent bluebox.ibmdte.local:
You should see similar content to the below screen
6.4 OpenTelemetry Collector - configuration
Once the Instana agent is up and running, you can configure the OpenTelemetry Collector.
OpenTelemetry Collector was already pre-installed into your environment. Please check the below information about the installation, but remember you don't need to install the collector during this Lab
Please review this installation steps.
During this scenario, we will be using OpenTelemetry Collector Contrib, which is more advanced version of the standard Collector.
Let's review the OpenTelemetry Collector configuration file, by viewing config.yaml:
cd /root/otelcol-contrib
vim config-simple.yaml
The content of the file looks like in the below picture
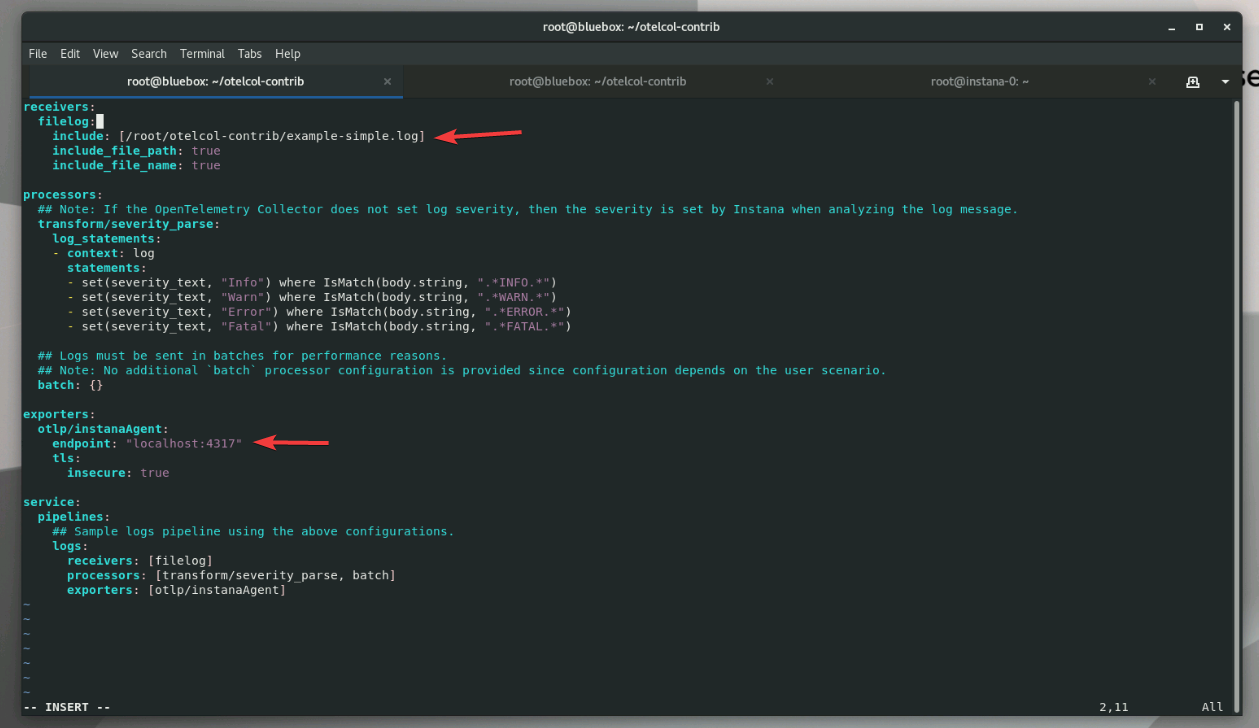
There are two key elements of the configuration file:
- log file which will be monitored (in our case - /root/otelcol-contrib/example-simple.log)
- OTLP endpoint (in our case - localhost:4317)
Please note, that the Otel data can also be sent directly to the Instana backend. This is an alternative approach. In this scenario, we will be using the Instana Agent as a "gateway" which will deliver OpenTelemetry data to the Instana backend.
Other elements of the configuration file (based on the Otel protocol):
-
receivers - which element is providing the data to the Otel model. There are many different receivers, depending on the file/data types. Receivers, indicate that there are MANY available receivers such as SNMP, prometheus, databases, and many more, but we will be focusing on collecting log data and will be using the filelog receiver
-
processors - allow you to process the data before the data is sent to the exporter, for example data cleaning, re-formatting, enriching, etc.
-
exporters - indicate that it exports the data from the collector contrib to a target that is capable of receiving OpenTelemetry data. In our case that's Instana backend. It is possible to send data to multiple exporters
Other interesting settings within the configuration file:
- The "include" section at the top indicates which file(s) to monitor. In our case - example.log. You can specify one or more filenames as well as directories. When specifying a directory, you can also specify an "exclude" condition.
- Setting the severity to "Fatal" if we find FATAL in the log
- Instana's Agent is listing for GRPC data on port 4317. By default, the Instana Agent listens on the loopback address, so you MUST configure the OpenTelemetry collector contrib to use either "localhost" or "127.0.0.1"
The file is ready to be used by the OpenTelemetry collector, let's close the configuration file:
<escape> q!
and start the OpenTelemetry Collector service
sudo otelcol-contrib --config=config-simple.yaml
after a moment you should be able to see information about the service waiting for the events like on below screen
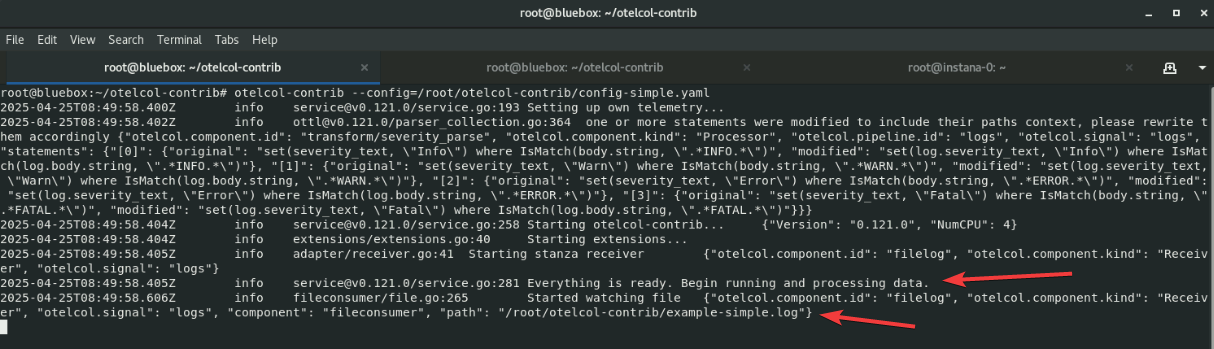
The service is now ready to accept the log changes. Please keep this terminal window open (do not stop the service) and move to the next section.
6.5 Log content creation
The above configuration will tail the desired log file content. Any new entries that are not filtered out by our configuration settings will be captured by the collector. Now, let's simulate new log entries creation - the goal is to be sure that OpenTelemetry Collector will send the log data, throught the Instana agent to the Instana backend.
Please open a new terminal and login (again) to the "bluebox" host. We need two active sessions, because the previous one keeps the OpenTelemetry Collector up and running. Please login to the "bluebox" host:
ssh jammer@bluebox
switch to the root user
sudo -i
navigate to the OpenTelemetry directory
cd /root/otelcol-contrib
run these commands, which will add new lines into the existing log file
echo "2024-02-02 ERROR first line message1" >> example-simple.log
echo "2024-03-02 ERROR second line message2" >> example-simple.log
echo "2024-04-02 ERROR third line message3" >> example-simple.log
6.6 Instana verification
After a short moment, please navigate to the Instana UI -> Analytics -> Logs section and confirm, you can see three logs entries delivered by the Agent using the OpenTelemetry standard. Try filtering by Most recent first if you cannot see them. You should be able to see similar content to the below screenshot:
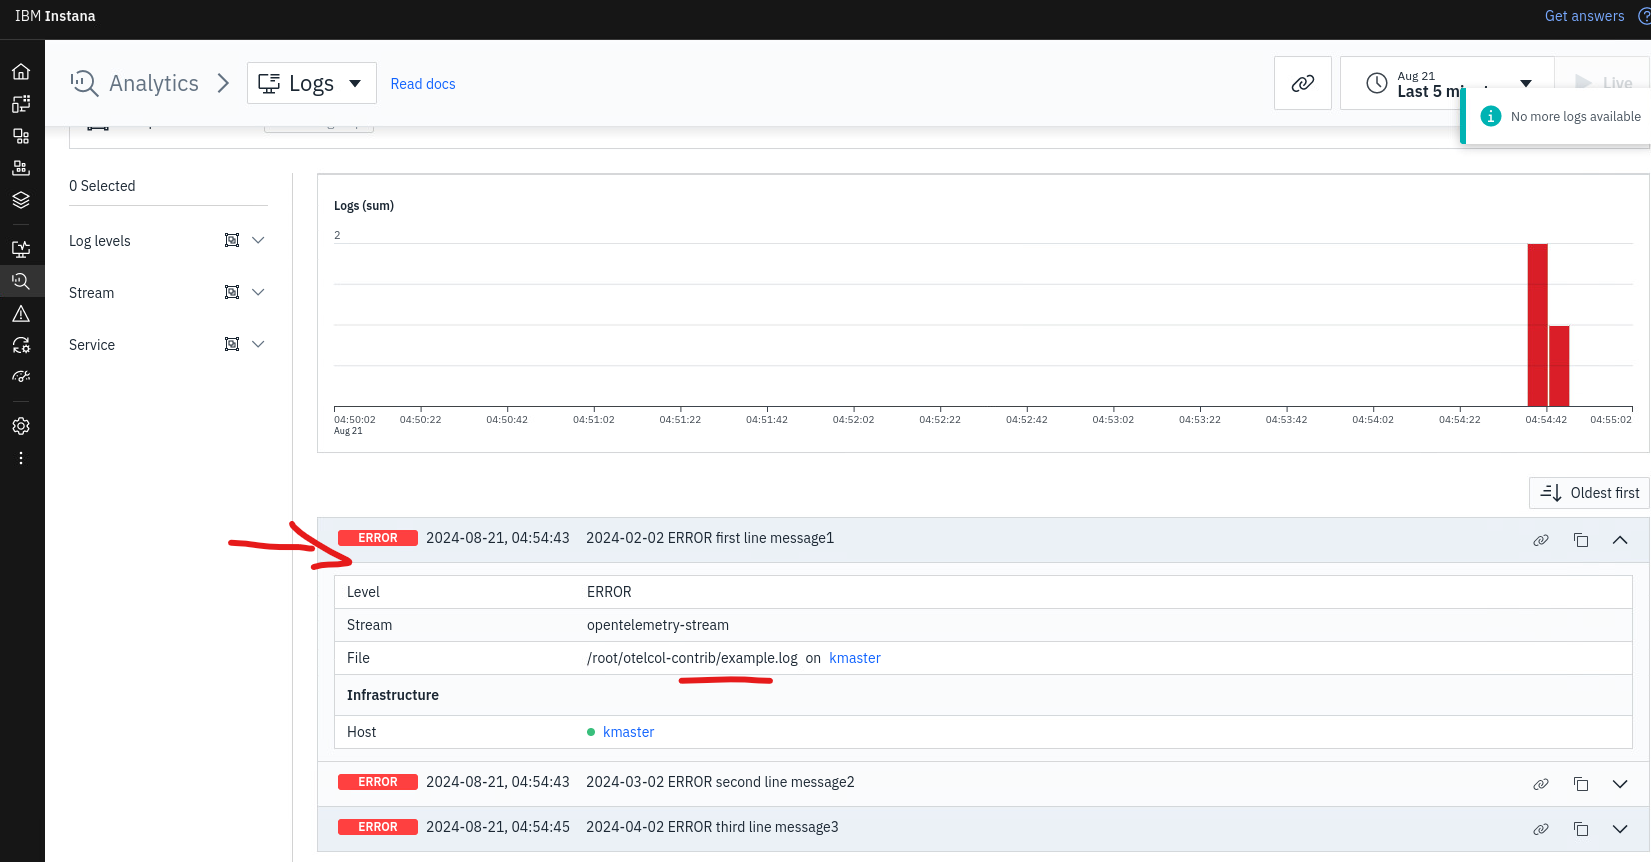
You have just used Instana to accept custom log content using the external OpenTelemetry Collector.
You can now exist out of the running otelcol-contrib process using ctrl + c to free up the ports used for the next example.
6.7 More complex example
In the previous example, we've been focusing on simple, one-line log files. Now, let's try to parse and send to Instana more advanced multi-line log file. In this case, it is parsing out the IBM MQ FDC. It pulls out a couple of key pieces of information from the FDC log.
Let's stop the OtelContrib collector, as we will be using other configuration file. Go back to the console with running service and hit CTRL+C to stop the ingestion
Let's review the more advanced log example.
Make sure you are still in the right directory
cd /root/otelcol-contrib
Please open a example.FDC file by typing
vim example.FDC
The content will be like presented below. Please note, the multi-line entries
+-----------------------------------------------------------------------------+
|                                                                             |
| IBM MQ First Failure Symptom Report                                         |
| =========================================                                   |
|                                                                             |
| Date/Time         :- Mon November 11 2024 10:45:21 EST                      |
| UTC Time          :- 1731339921.997850                                      |
| UTC Time Offset   :- -300 (EST)                                             |
| UTC Date/Time     :- 2024-11-11 15:45:21.997850 (1731339921997850)          |
| Host Name         :- acemq2                                                 |
| Operating System  :- Linux 5.14.0-427.16.1.el9_4.x86_64                     |
| OS Details        :- Red Hat Enterprise Linux 9.4 (Plow)                    |
| PIDS              :- 5724H7251                                              |
| LVLS              :- 9.3.0.15                                               |
| Product Long Name :- IBM MQ for Linux (x86-64 platform)                     |
| Vendor            :- IBM                                                    |
| O/S Registered    :- 1 (libmqmcs_r.so) Installed                            |
| Data Path         :- /var/mqm                                               |
| Installation Path :- /opt/mqm                                               |
| Installation Name :- Installation1    (1)                                   |
| License Type      :- Production                                             |
| Probe Id          :- XC338001                                               |
| Application Name  :- MQM                                                    |
| Component         :- xehAsySignalHandler                                    |
| Source filename   :- /build/jslot1/p930_P/src/lib/cs/unix/amqxerrx.c        |
| Line Number       :- 886                                                    |
| Build Date        :- Nov 29 2023                                            |
| Build Level       :- p930-015-231129                                        |
| Build Type        :- IKAP - (Production)                                    |
| Effective UserID  :- 1001 (mqm)                                             |
| Real UserID       :- 1001 (mqm)                                             |
| Program Name      :- amqzlaa0                                               |
| Arguments         :- -mQM1 -fip0                                            |
| Standard Streams  :- 0 1 2                                                  |
| Addressing mode   :- 64-bit                                                 |
| LANG              :- en_US.UTF-8                                            |
| Process           :- 9205                                                   |
| Process(Thread)   :- 9226                                                   |
| Thread            :- 2    AsyncSignal                                       |
| Perf Counter      :- 7225916878486                                          |
| UserApp           :- FALSE                                                  |
| Last HQC          :- 0.0.0-0                                                |
| Last HSHMEMB      :- 0.0.0-0                                                |
| Last ObjectName   :-                                                        |
| Major Errorcode   :- xecE_W_UNEXPECTED_ASYNC_SIGNAL                         |
| Minor Errorcode   :- OK                                                     |
| Probe Type        :- MSGAMQ6209                                             |
| Probe Severity    :- 3                                                      |
| Probe Description :- AMQ6209W: An unexpected asynchronous signal (15 :      |
|   SIGTERM) has been received and ignored.                                   |
| FDCSequenceNumber :- 0                                                      |
| Arith1            :- 15 (0xf)                                               |
| Arith2            :- 1 (0x1)                                                |
| Comment1          :- SIGTERM                                                |
| Comment2          :- Signal sent by pid 1                                   |
| Comment3          :- systemd                                                |
|                                                                             |
+-----------------------------------------------------------------------------+

MQM Function Stack
xehAsySignalMonitor
xehHandleAsySignal
xcsFFST

MQM Trace History
{ xihCSThreadClear
-{ xcsEmptyCBM
-} xcsEmptyCBM rc=OK
} xihCSThreadClear rc=OK
{ xppInitialiseDestructorRegistrations
} xppInitialiseDestructorRegistrations rc=OK
{ xehAsySignalMonitor
-{ xppPostAsySigMonThread
-} xppPostAsySigMonThread rc=OK
Data: 0xffffffff 0x00000000
Data: 0xffffffff 0x00000000
Data: 0xffffffff 0x00000000
Data: 0xffffffff 0x00000000
Data: 0xffffffff 0x00000000
As you can see in the above example, there are specific fields and values which we would like to extract. For example, we are particularly interested in "Probe ID", "Application Name", "Major Errorcode" and "Minor Errorcode". Our filtering should remove all other, not important parts of the log file and focus on the information which brings a value to the team.
Close the file by typing
!q
Let's examine the config-advanced.yaml with a command
vim config-advanced.yaml
receivers:
  filelog:
    ## Path to the log files that must be read.
    include: ["/root/otelcol-contrib/*.FDC"]

    exclude_older_than: 1m
    include_file_path: true
    include_file_name: true

    ## Preserve the leading white spaces so that the example 'recombine' operator works as expected.
    preserve_leading_whitespaces: true
    operators:
      # Example use of the 'recombine' operator to handle multi-line log statements.
      - type: recombine
        combine_field: body
        source_identifier: attributes["log.file.path"]
        is_last_entry: body matches "^\\+---.*$"

      # Remove recombined log messages that do not contain this string.
      # This basically ignores the rest of the FDC file contents
      - type: filter
        expr: not (body contains "IBM MQ First Failure Symptom Report")

      - type: regex_parser
        regex: '\| Probe Id +:- (?P<ProbeId>\w+).*|$'

      - type: regex_parser
        regex: '\| Major Errorcode +:- (?P<MajorErrorCode>\w+).*|$'

      # Squash the multi-line log message into a single line by remove newline characters
      - type: regex_replace
        field: body
        regex: "\n"
        replace_with: ""

      # Replace entire squashed message body with hard-coded string (not possible without squash)
      - type: regex_replace
        field: body
        regex: ".*"
        replace_with: "IBM MQ First Failure Symptom Report"

processors:
  ## Adding a tag name of BusinessApp with a value of QOTD
  attributes/insertIntoLoggingSubPayload:
    actions:
      - key: "BusinessApp"
        value: "QOTD"
        action: insert

exporters:
  debug:
    verbosity: detailed

  file:
    path: ./otel-file-exporter.json
    append: false
    rotation:
      max_megabytes: 10
      max_days: 3
      max_backups: 3
      localtime: true
    format: json

  ## The Instana Agent supports GRPC payloads
  otlp/instanaAgent:
    ## Be sure to set the appropriate HOST:PORT combination.
    ## Note: The GRPC port will be 4317 (unless port-forwarding is used to change this).
    endpoint: "localhost:4317"
    ## endpoint: "otlp-http.instana2.tivlab.raleigh.ibm.com:443"
    ## TLS encryption is disabled in this example. To enable TLS encryption, see [Sending OpenTelemetry data to the Instana agent](https://www.ibm.com/docs/en/instana-observability/current?topic=opentelemetry-sending-data-instana-agent#enabling-tls-encryption-for-opentelemetry-ingestion).
    tls:
      insecure: true

service:
  pipelines:
    ## Sample logs pipeline using the above configurations.
    logs:
      receivers: [filelog]
      processors: [attributes/insertIntoLoggingSubPayload]
      exporters: [otlp/instanaAgent, debug, file]
As you can see, the configuration is more complex, comparing to the previous example. There are couple of important parts of the file:
- Operators – We've added an "operators" section to ensure the log file is parsed correctly and efficiently, enabling structured and meaningful log data extraction.
-
The recombine operator is used to merge consecutive log lines into a single log entry based on defined expression rules. This is particularly useful for multi-line logs, such as stack traces or verbose error messages, which would otherwise be split and misinterpreted.
-
The is_last_entry operator helps identify the final log entry in a file that should be processed. This is essential for ensuring that only complete and relevant log data is passed downstream, avoiding partial or incomplete entries.
-
The filter operator allows selective processing by filtering incoming log entries that match a specific expression. This helps reduce noise and focus on logs that are relevant for analysis or alerting.
-
The regex_parser operator extracts structured data from unstructured log messages. It parses a string-type field (specified by parse_from) using a regular expression pattern, enabling the extraction of fields like timestamps, log levels, or error codes.
-
The regex_replace operator modifies the content of a string-typed field (specified by field) using a user-defined or well-known regular expression. It can be used to clean, mask, or standardize log data, such as anonymizing sensitive information or normalizing formats.
- Processors – We've added a processors section to enrich the content of log messages, making them more informative and context-aware for Instana.
- The insert processor is used to add custom metadata to each log entry. In this case, it creates an additional tag called "BusinessApp" with the value "QOTD". This enrichment adds business context to the logs, making it easier to filter, search, and correlate logs in Instana. It also supports better tagging and grouping of logs by application, which is especially valuable in environments with multiple services.
Let's start the OpenTelemetry Contrib Collector using the new config-advanced.yaml by the below command
sudo otelcol-contrib --config=config-advanced.yaml
Similarly as before, let's now open a new terminal window, login to the "bluebox" host and switch to root user.
If you see the error that starts with Error: failed to create SDK: binding address localhost:8888, you
may not have ended the previous otelcol-contrib process. Run sudo pkill otelcol-contrib to close it.
Once done, we should create a new FDC file, so that our Collector could pick it up and deliver to Instana backend. Open a new terminal tab and connect to bluebox again.
Copy the existing FDC file
cd /root/otelcol-contrib
cp example.FDC example-new.FDC
6.8 Instana verification - advanced
After a short moment, please navigate to the Instana UI -> Analytics -> Logs section and confirm, you can see logs entries delivered by the Agent using the OpenTelemetry standard. You should be able to see similar content to the below screenshot:
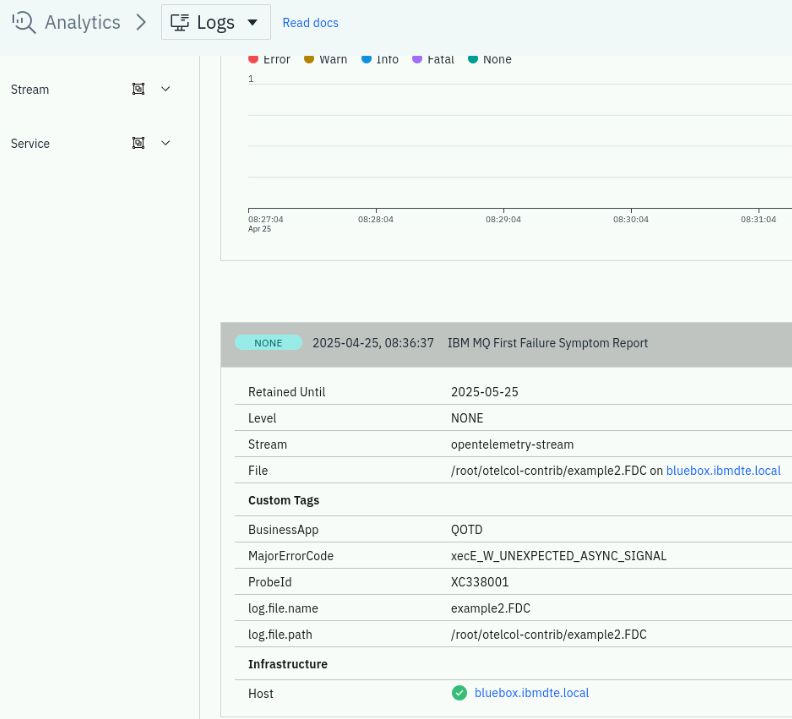
It was shown, that Instana can accept custom, multi-line log content, using external OpenTelemetry Collector.
Please note additional fields visible on the above screen:
-
Business App - the extra context field added during log parsing. The field allows you to create a filter or search over the provided value.
-
Major Error Code - additional contextual information about the specific error code visible within the log file. This will help to understand the potential root cause of a problem captured by Instana
-
Probe ID - additional value we've extracted from a long log file - will help with faster identification of an impacted infrastructure resource.
6.9 Summary
This section concludes the Lab. In this section you have learned:
- How to setup, configure and run the OpenTelemetry Collector Contrib,
- How to configure traditional Instana Agent to accept the Otel communication,
- How to explore the Instana Analytics/Logs UI
Please review additional information about OpenTelemetry Collector filelog receiver.