Understanding the UI
The screenshots in the lab documentation may not look identical to your individual environment. The aim of this section is to get familiar with the key UI points of interest.
3.1: Open the Turbonomic Dashboard
If you are unsure how to get access to the Bastion host (Guacamole) see Accessing a Lab Environment
Open the Turbonomic ARM user interface in your browser:
-
Select Activities at the top left of the bastion host.
-
Select Firefox
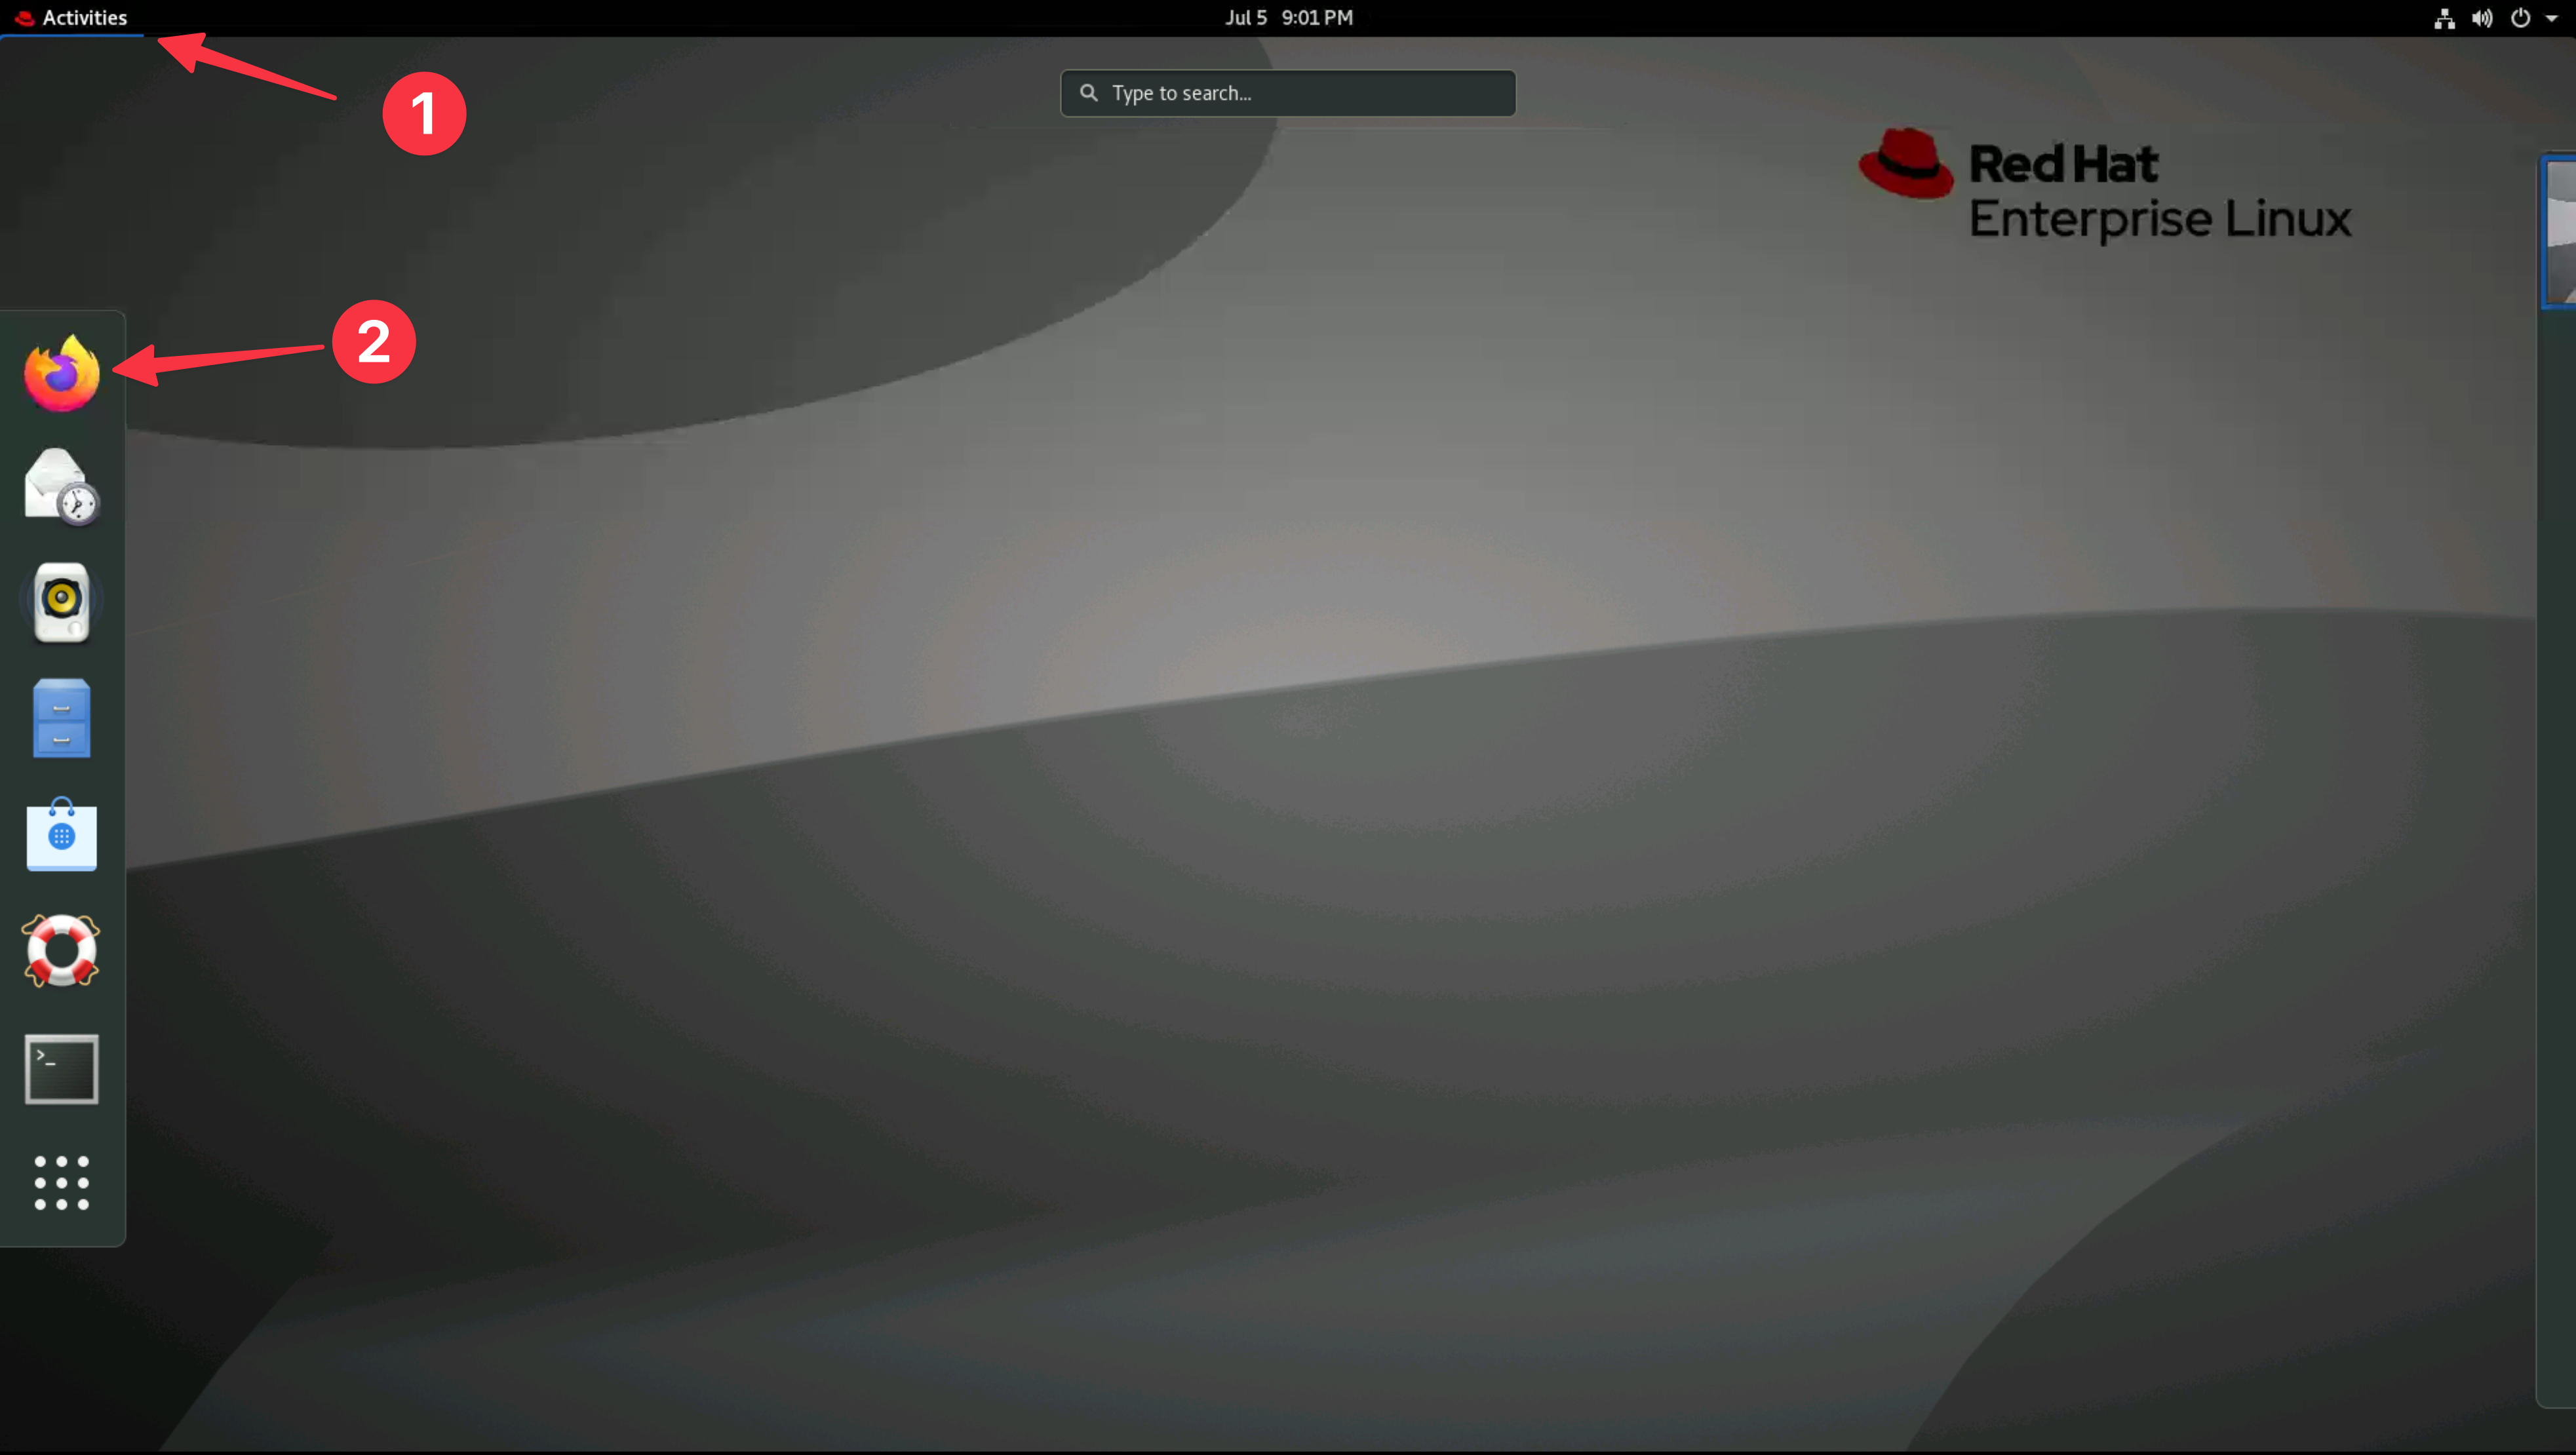
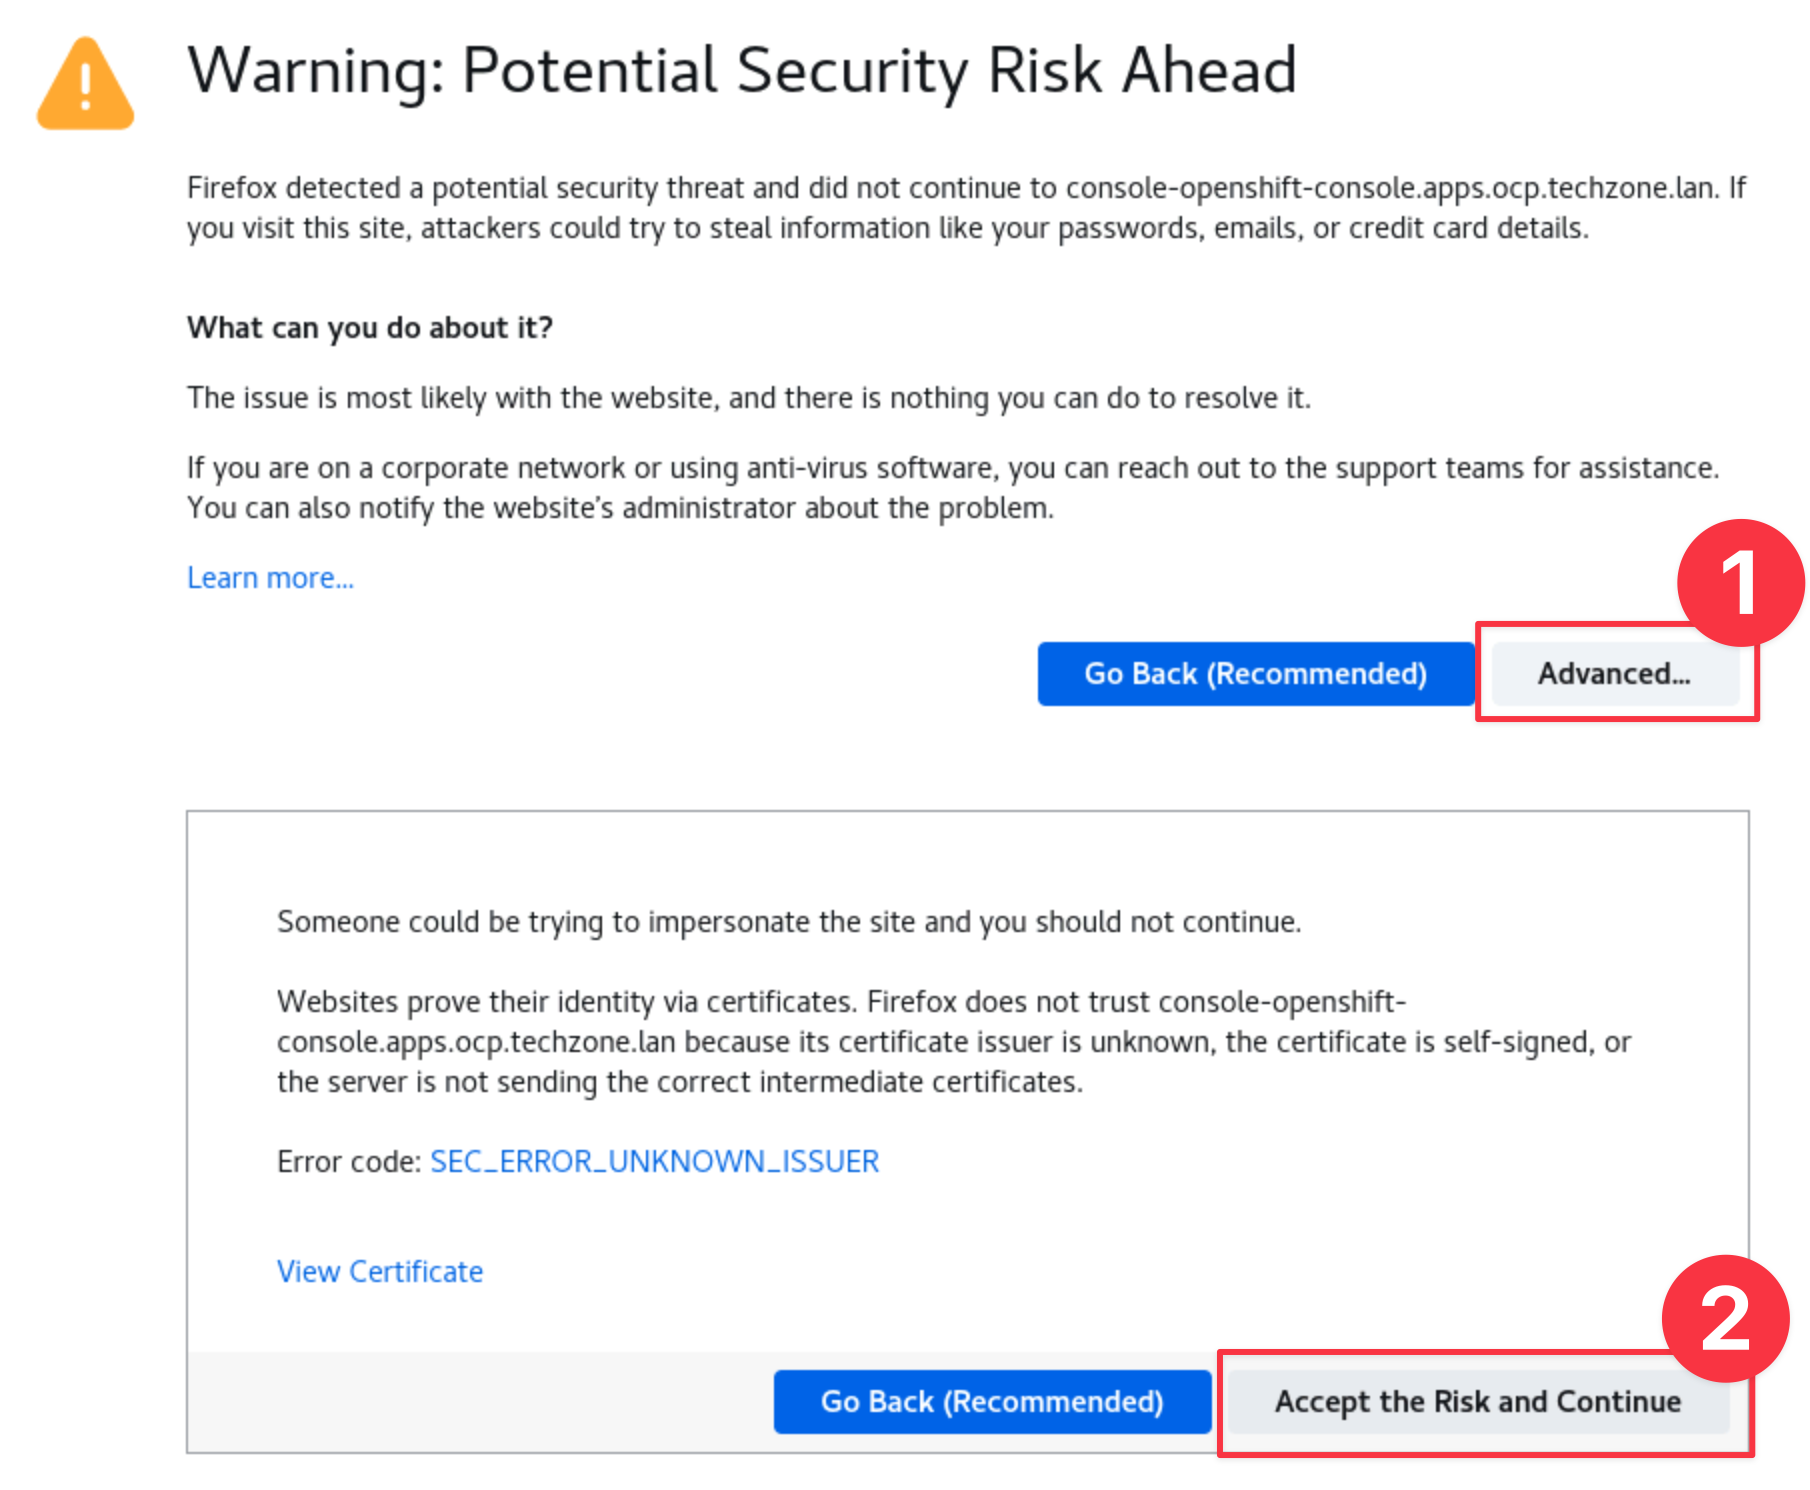
- Navigate to the Turbonomic UI home page by selecting the Turbonomic bookmark
You can safely ignore the warning about the certificate being untrusted.
3.2: Turbonomic UI
-
Login to Turbonomic
- Username:
administrator - Password:
Passw0rd
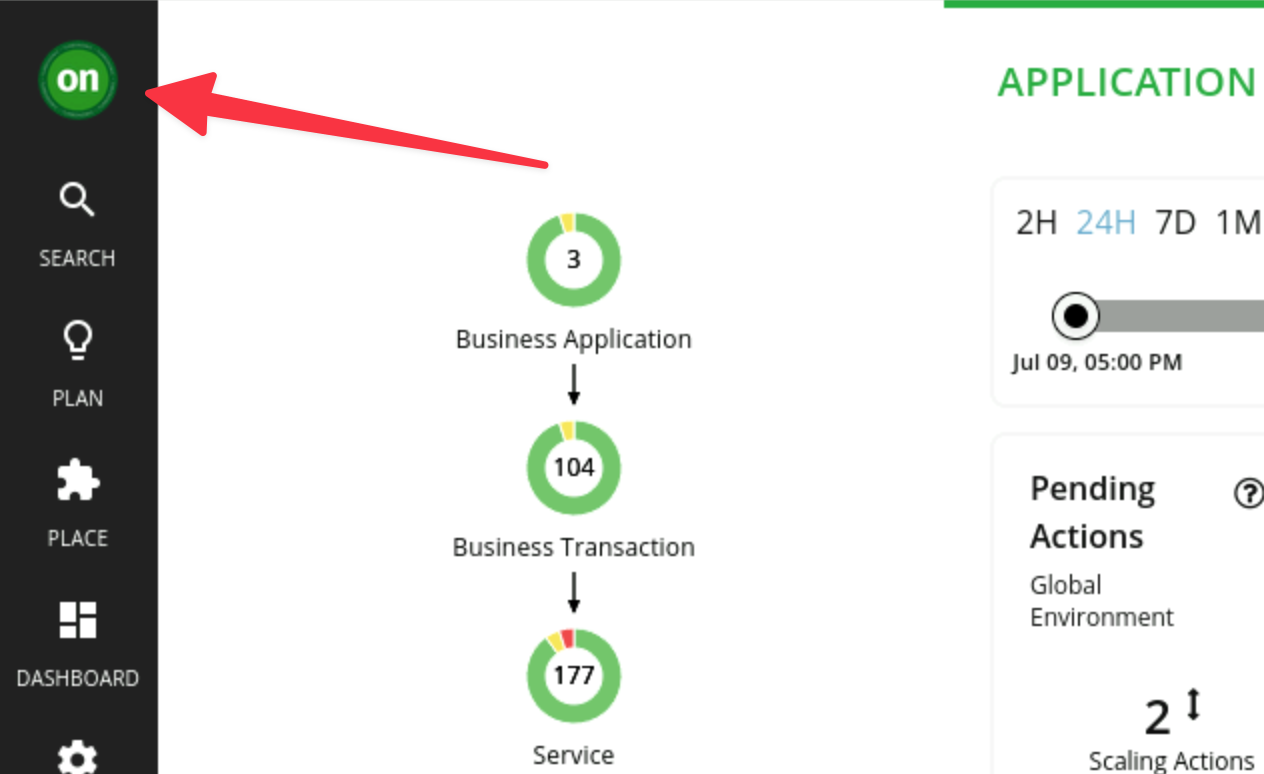
tipTo get back to the homepage, you can click the green ON icon in the top-left (left navigation pane):
- Username:
There is currently a known issue with the integration between Turbonomic and Instana in the lab environment preventing data ingest from Instana.
Until this is resolved the workaround is to re-save and rediscover the Instana target. To do this:
- Select Settings from the left navigation pane
- Select Target Configuration
- Edit the Instana target that is in a critical state. DO NOT change anything. Just click Save.
- Check the checkbox next to the Instana target and click Rediscover
This will force a re-discovery of the Instana target and should resolve the issue. The UI will begin to populate with data from Instana after a few minutes.
-
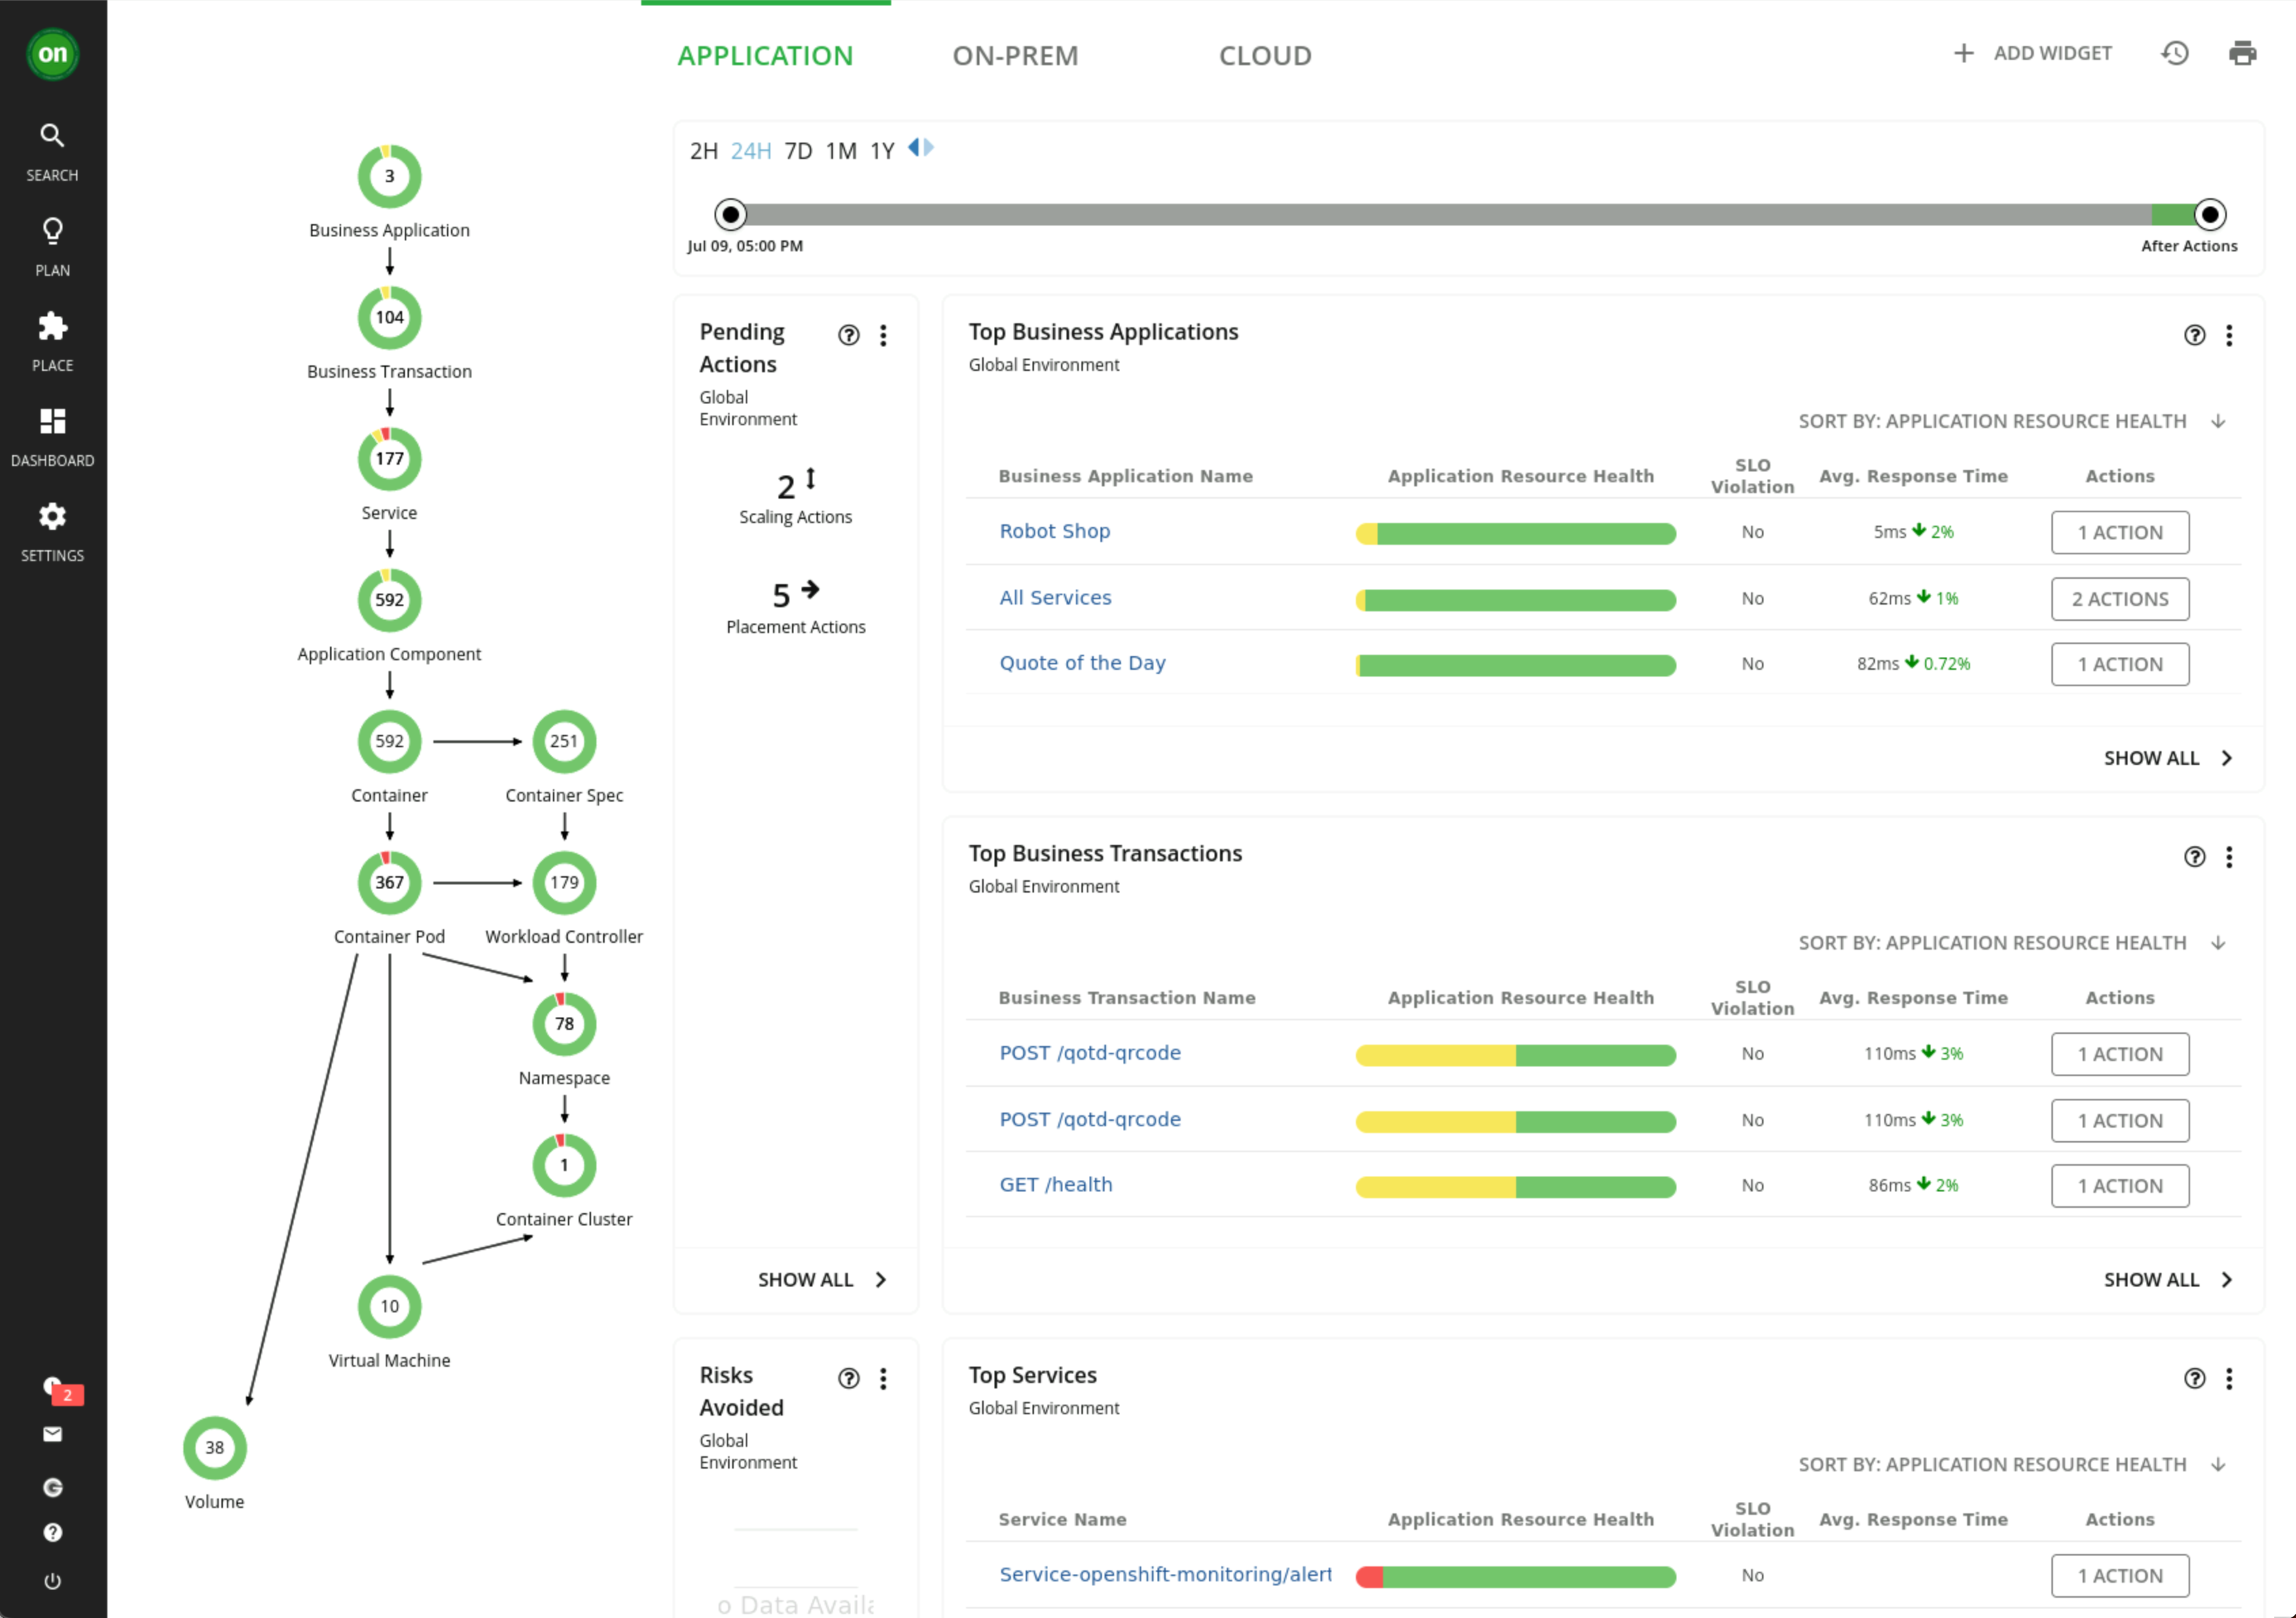
Once logged in you will see the Turbonomic UI homepage. Lets start by familiarising ourselves with the UI.
-
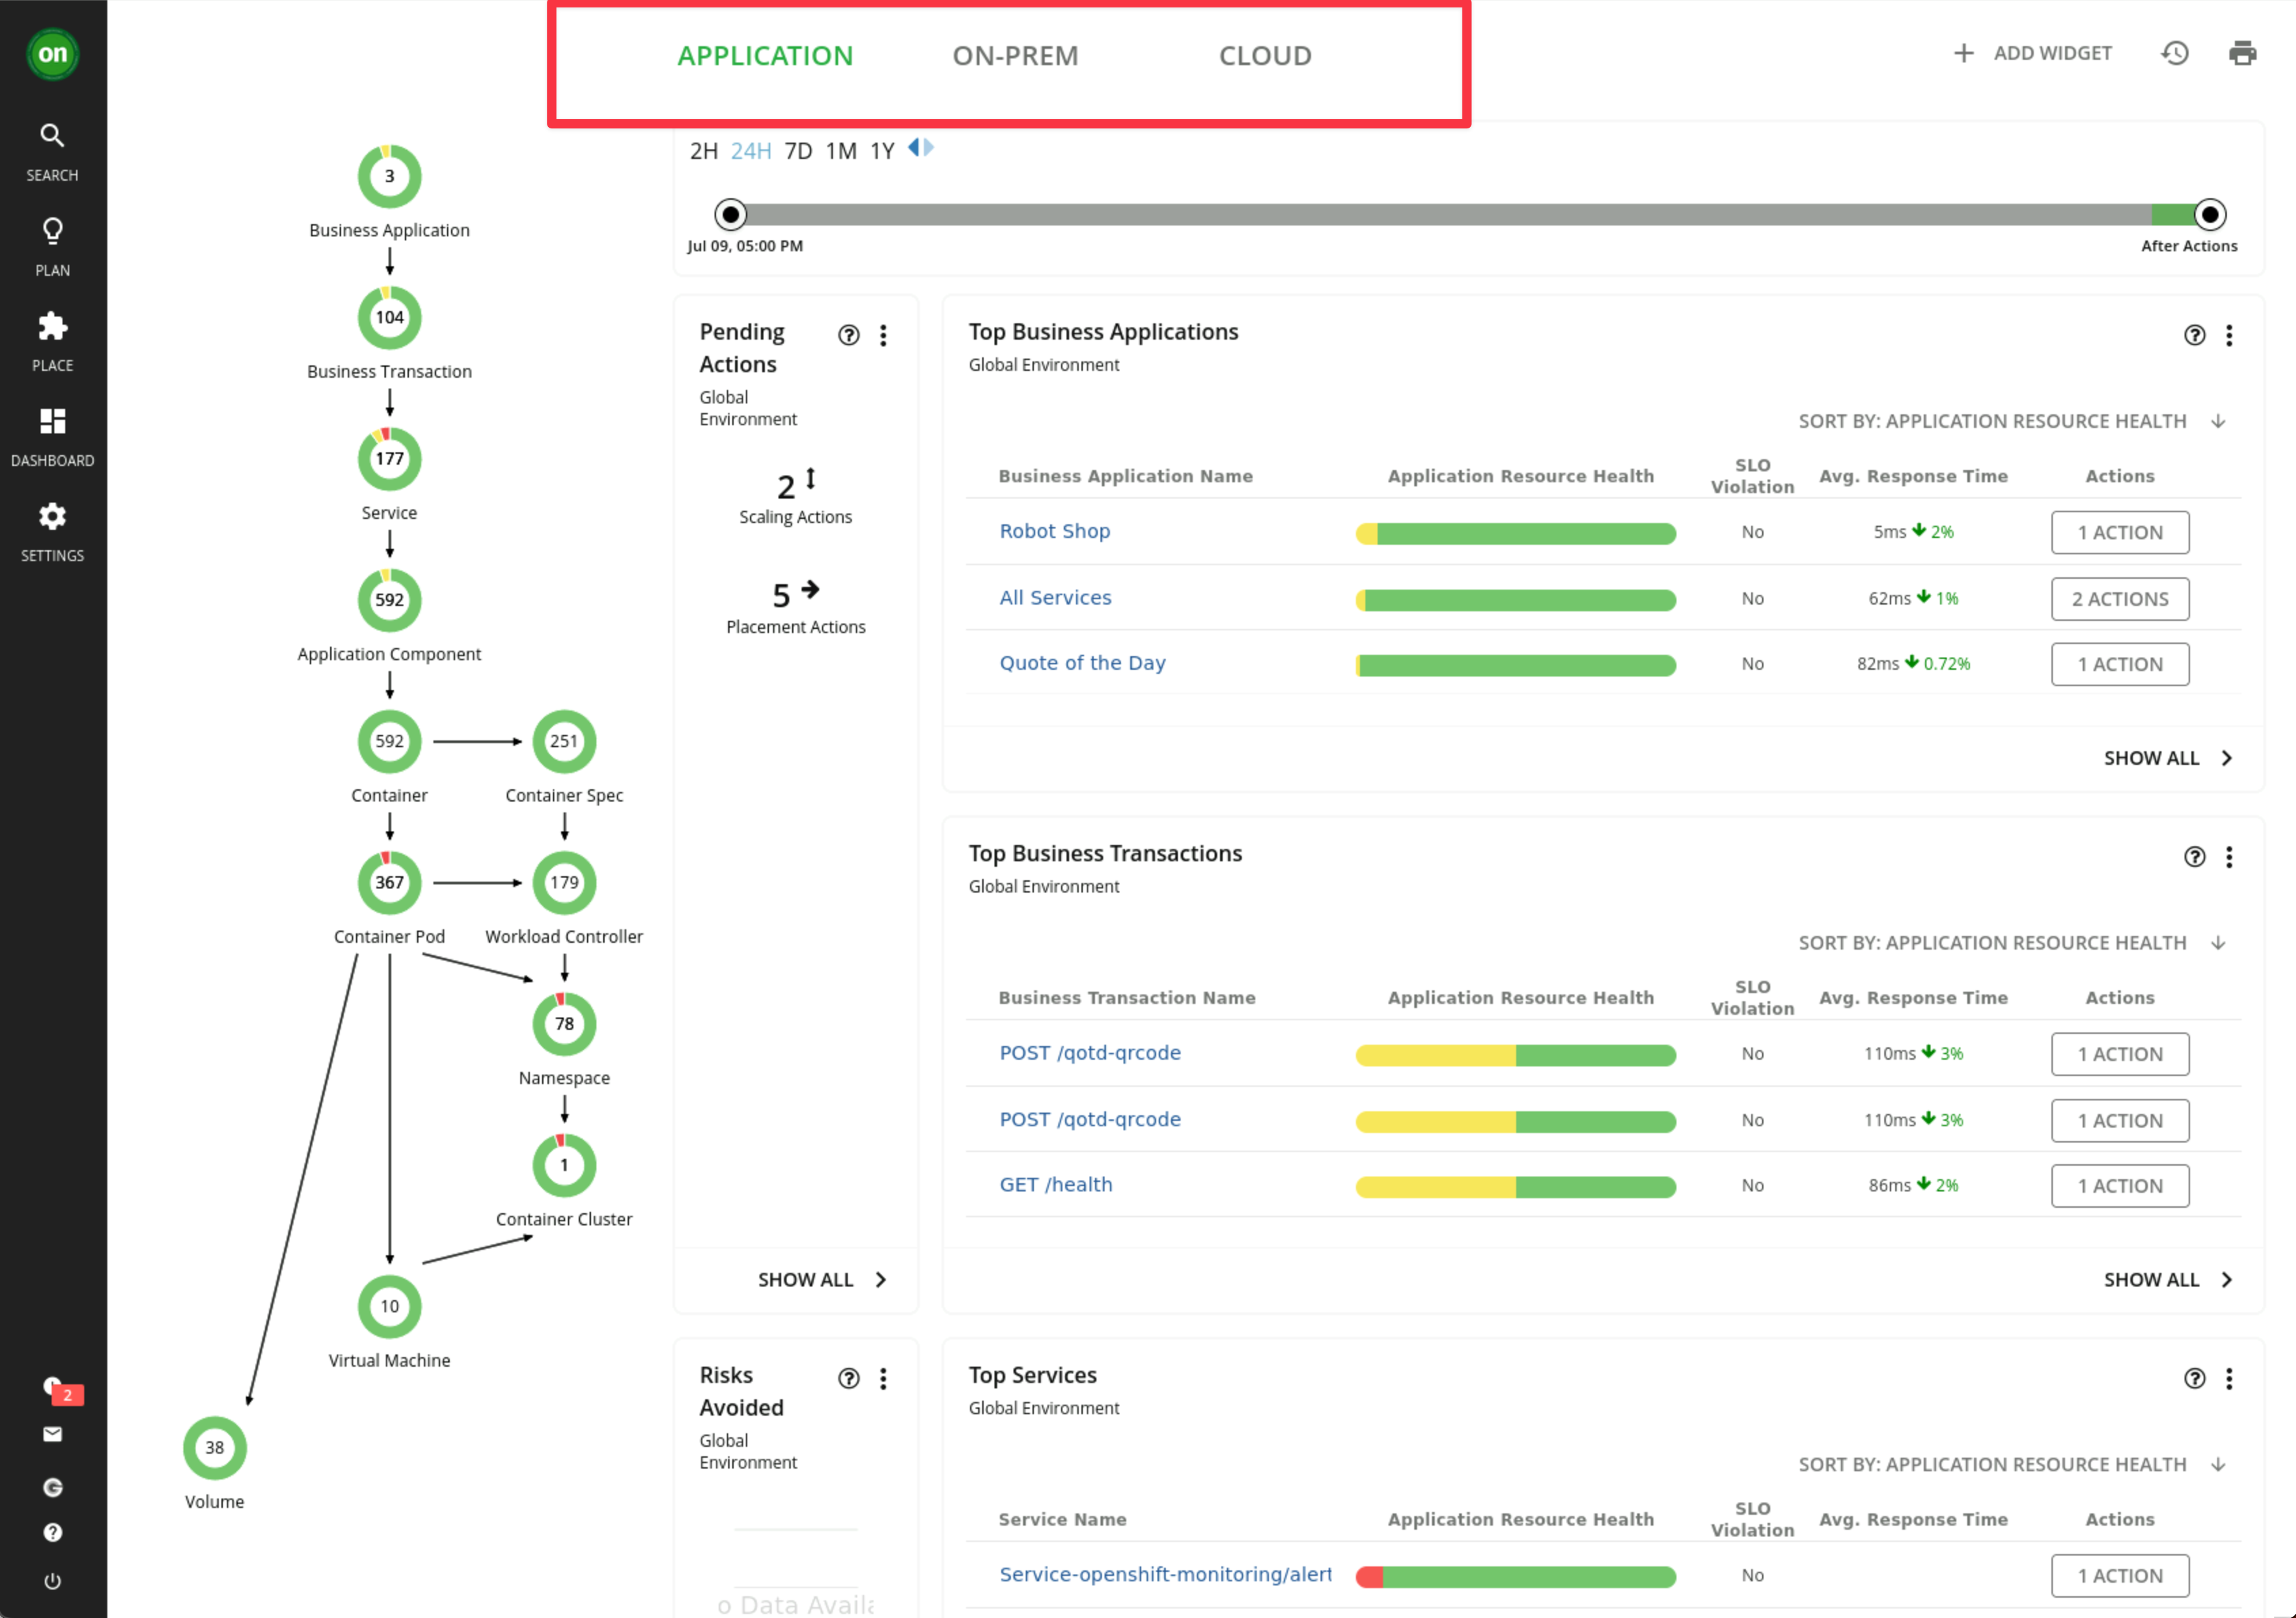
The three tabs at the top of the page allow you to navigate between different environmental views
-
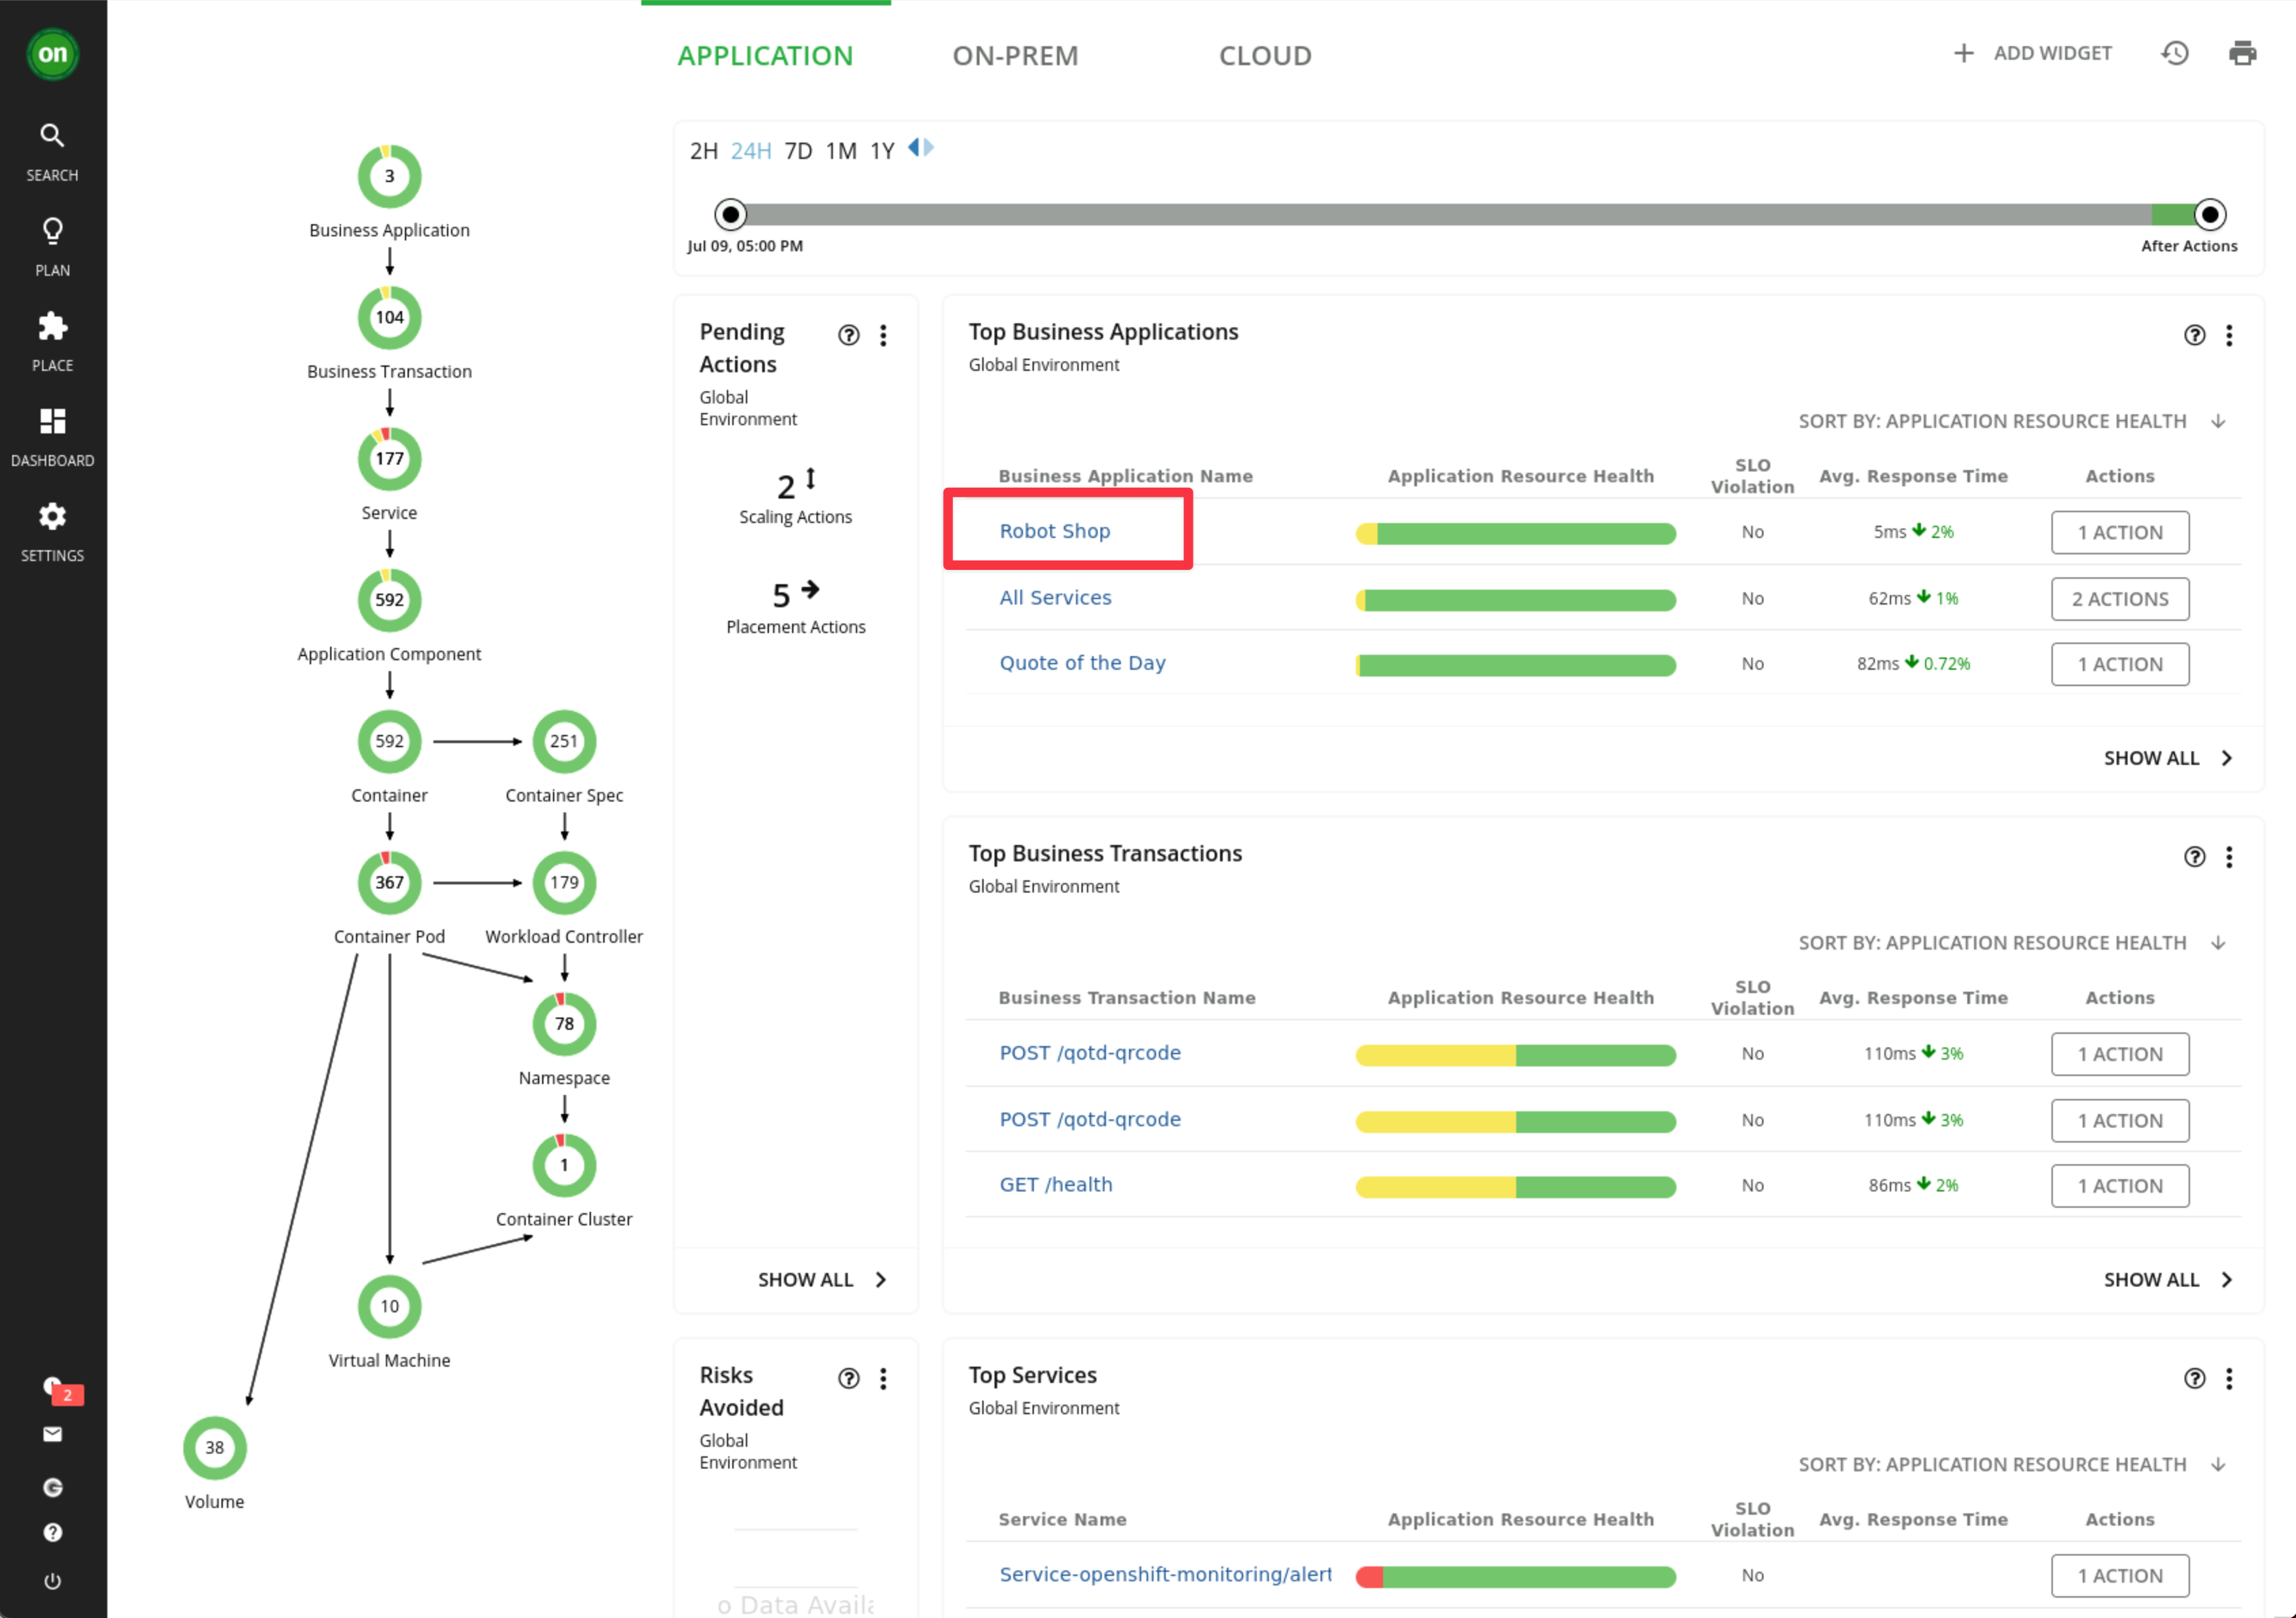
When Turbonomic ARM is deployed and selected environments are targeted, Turbonomic discovers all of the entities in the targeted environments. It then builds out this graphic you see here called the Supply Chain. This environment has already been pre-configured with an Instana integration, so you can see entities that have been imported from Instana in the supply chain:
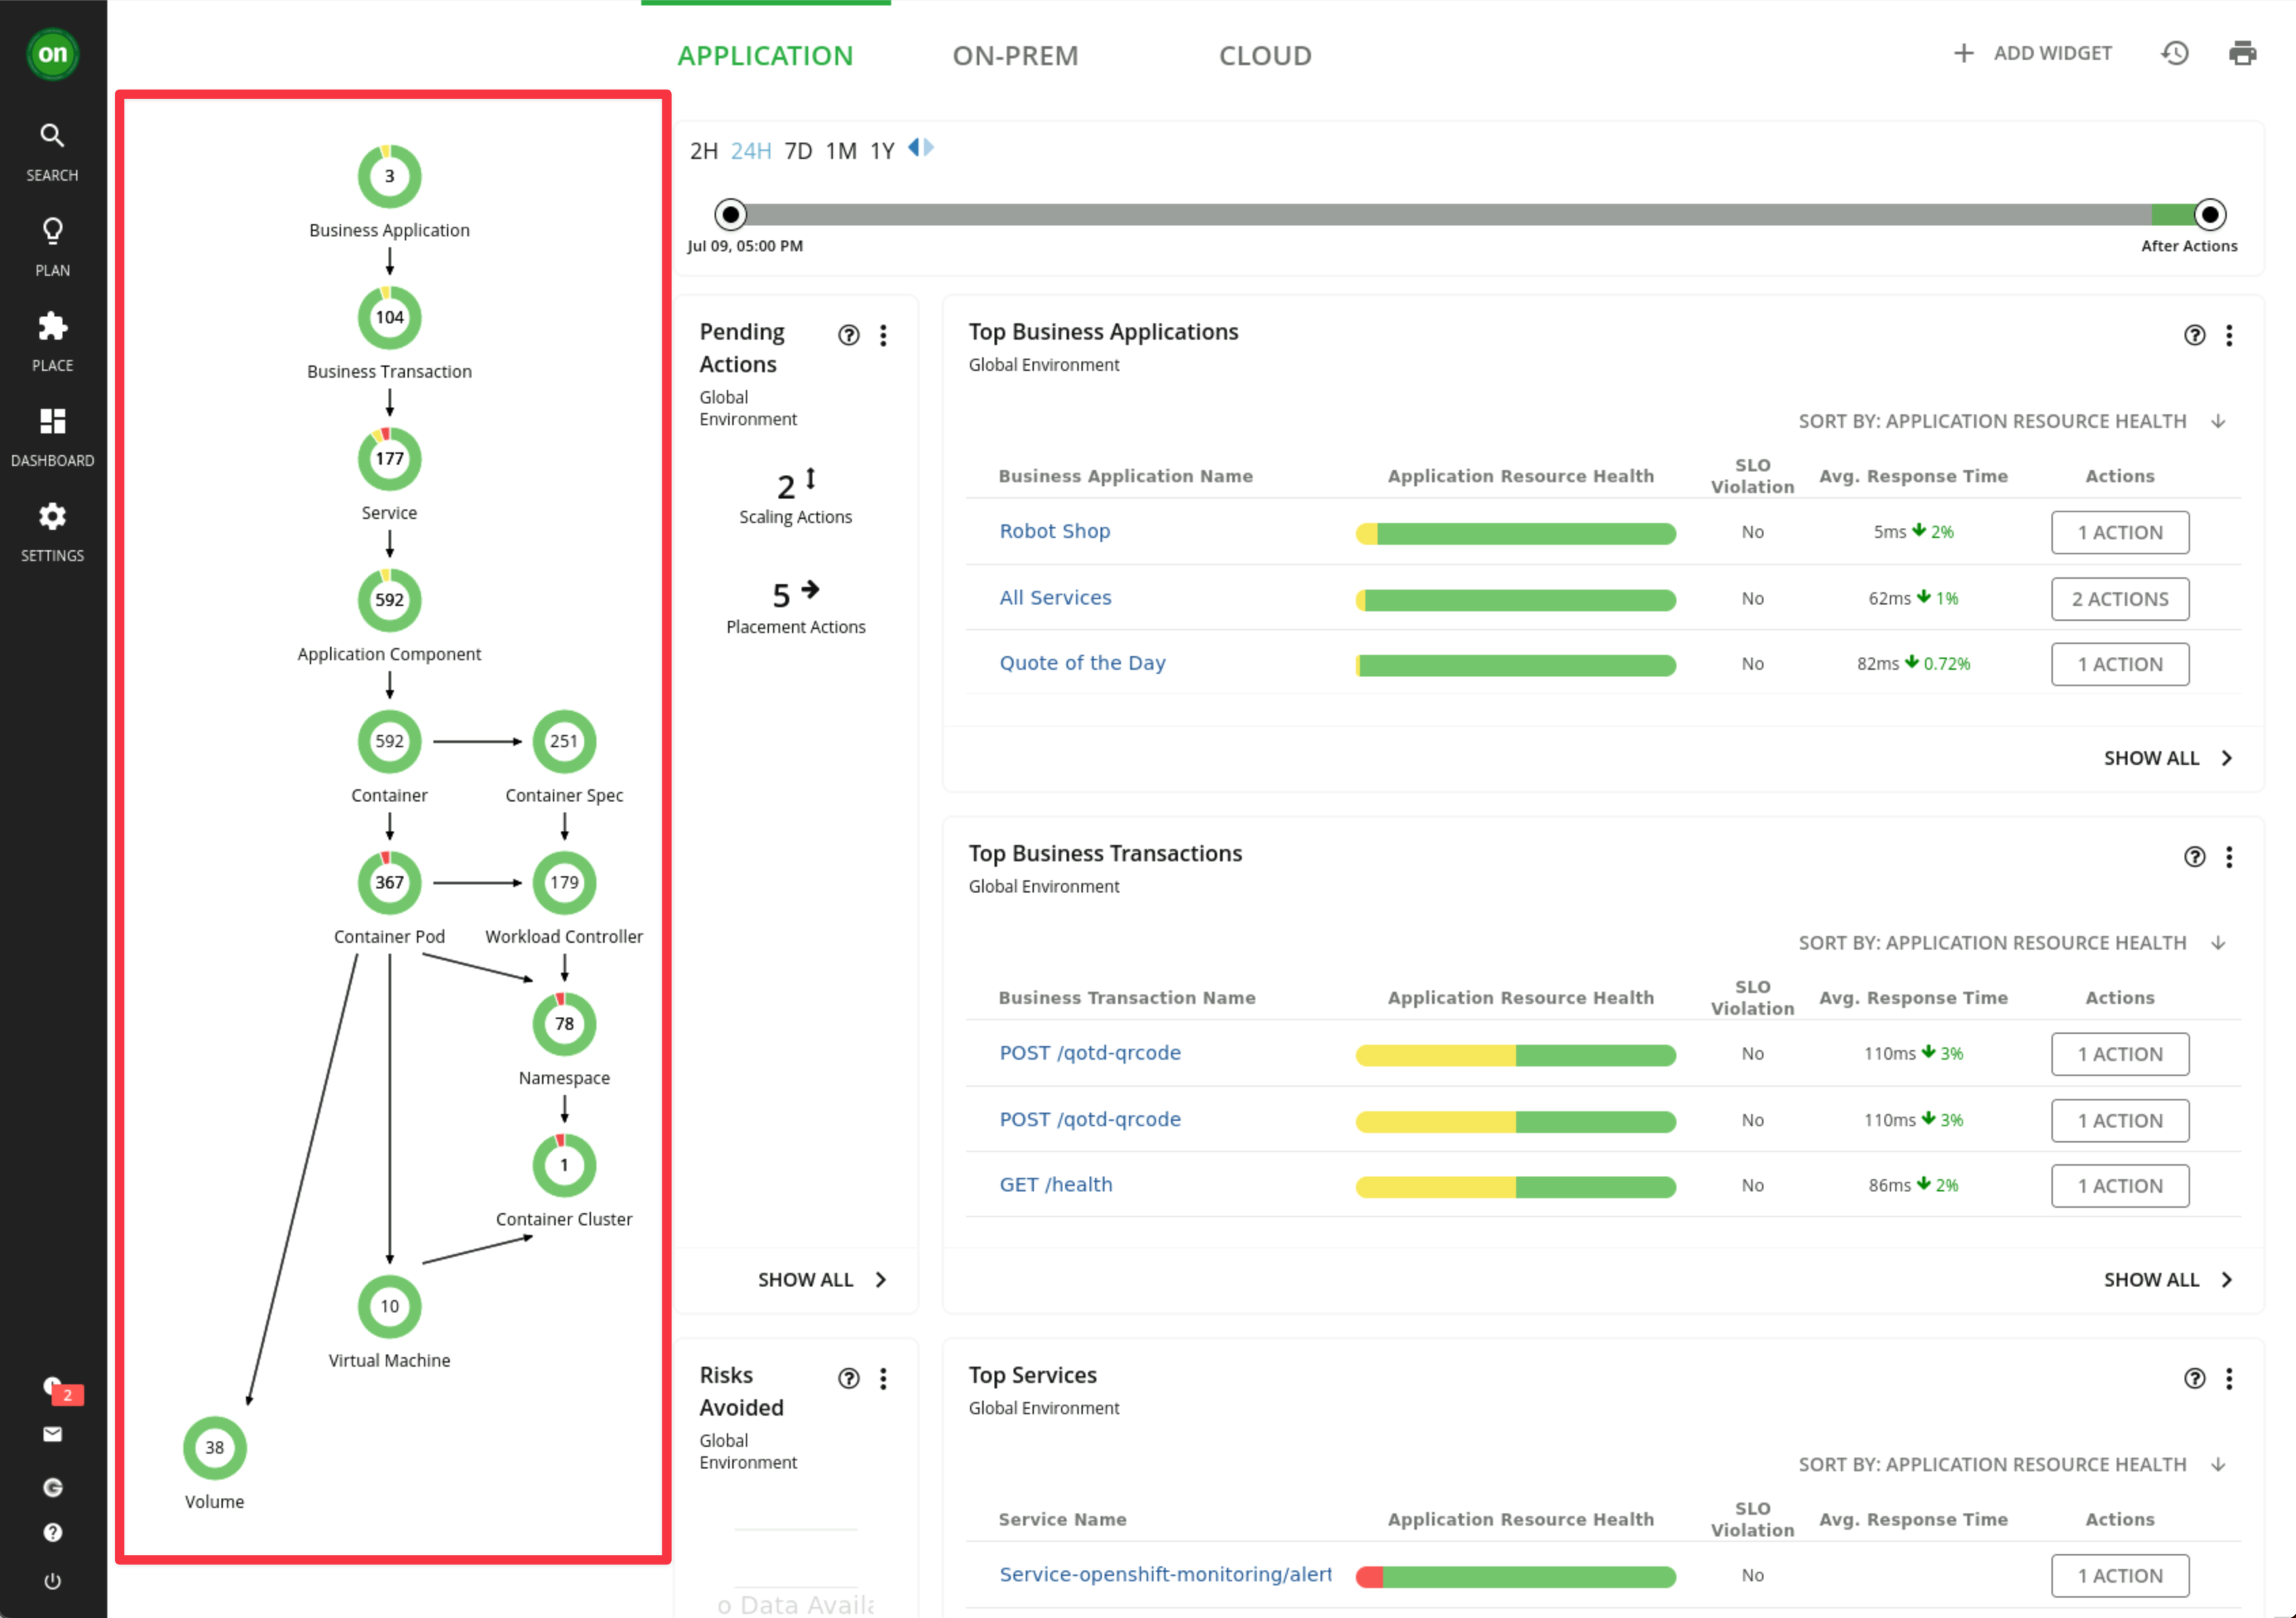
The Supply Chain stitches together all of the entities from the top-level business application down through to the supporting infrastructure.
-
Notice that the entities have different colors:
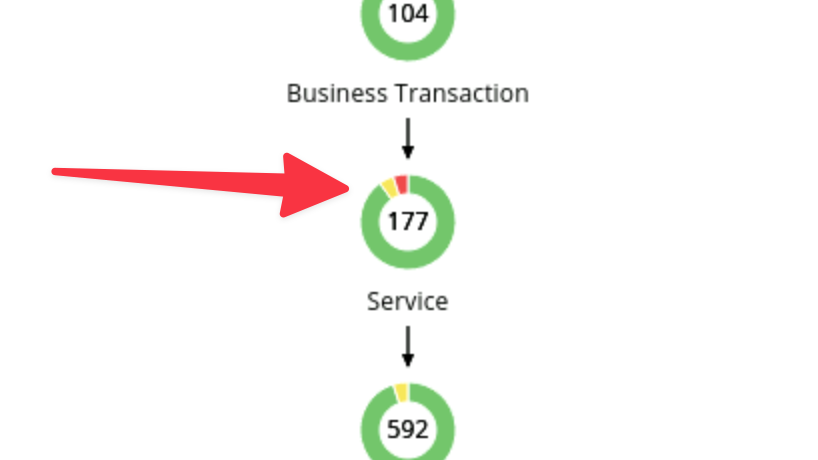
- red indicates performance risk, e.g. where entities need to be moved to a more optimal host or scaled up because of resource congestion or under-provisioning.
- yellow indicates efficiency opportunities, e.g. where resources can be reclaimed due to overprovisioning, or potentially turned off / deleted.
- green indicates entities in their desired, optimal state, which is what we are after. Green means no recommended actions at this time.
infoCost is a by-product of assuring application performance. If actions can be safely taken for efficiency gains without impacting application performance and therefore user experience, Turbonomic ARM will recommend, and if enabled to, take the automated actions to proactively ensure application performance whilst making the most efficient use of your infrastructure, resources and cloud budget.
-
Also on this home page, you have high level view via widgets for:
- Top Business Applications
- Top Business Transactions
- Top Services
- Pending Actions
- Risks Avoided
These widgets allow you to quickly assess the risk to the running applications in your environment. Not only can you quickly see the applications with the highest risk, but you can also click
Show Allto see the complete list of Business Applications and relevant metrics: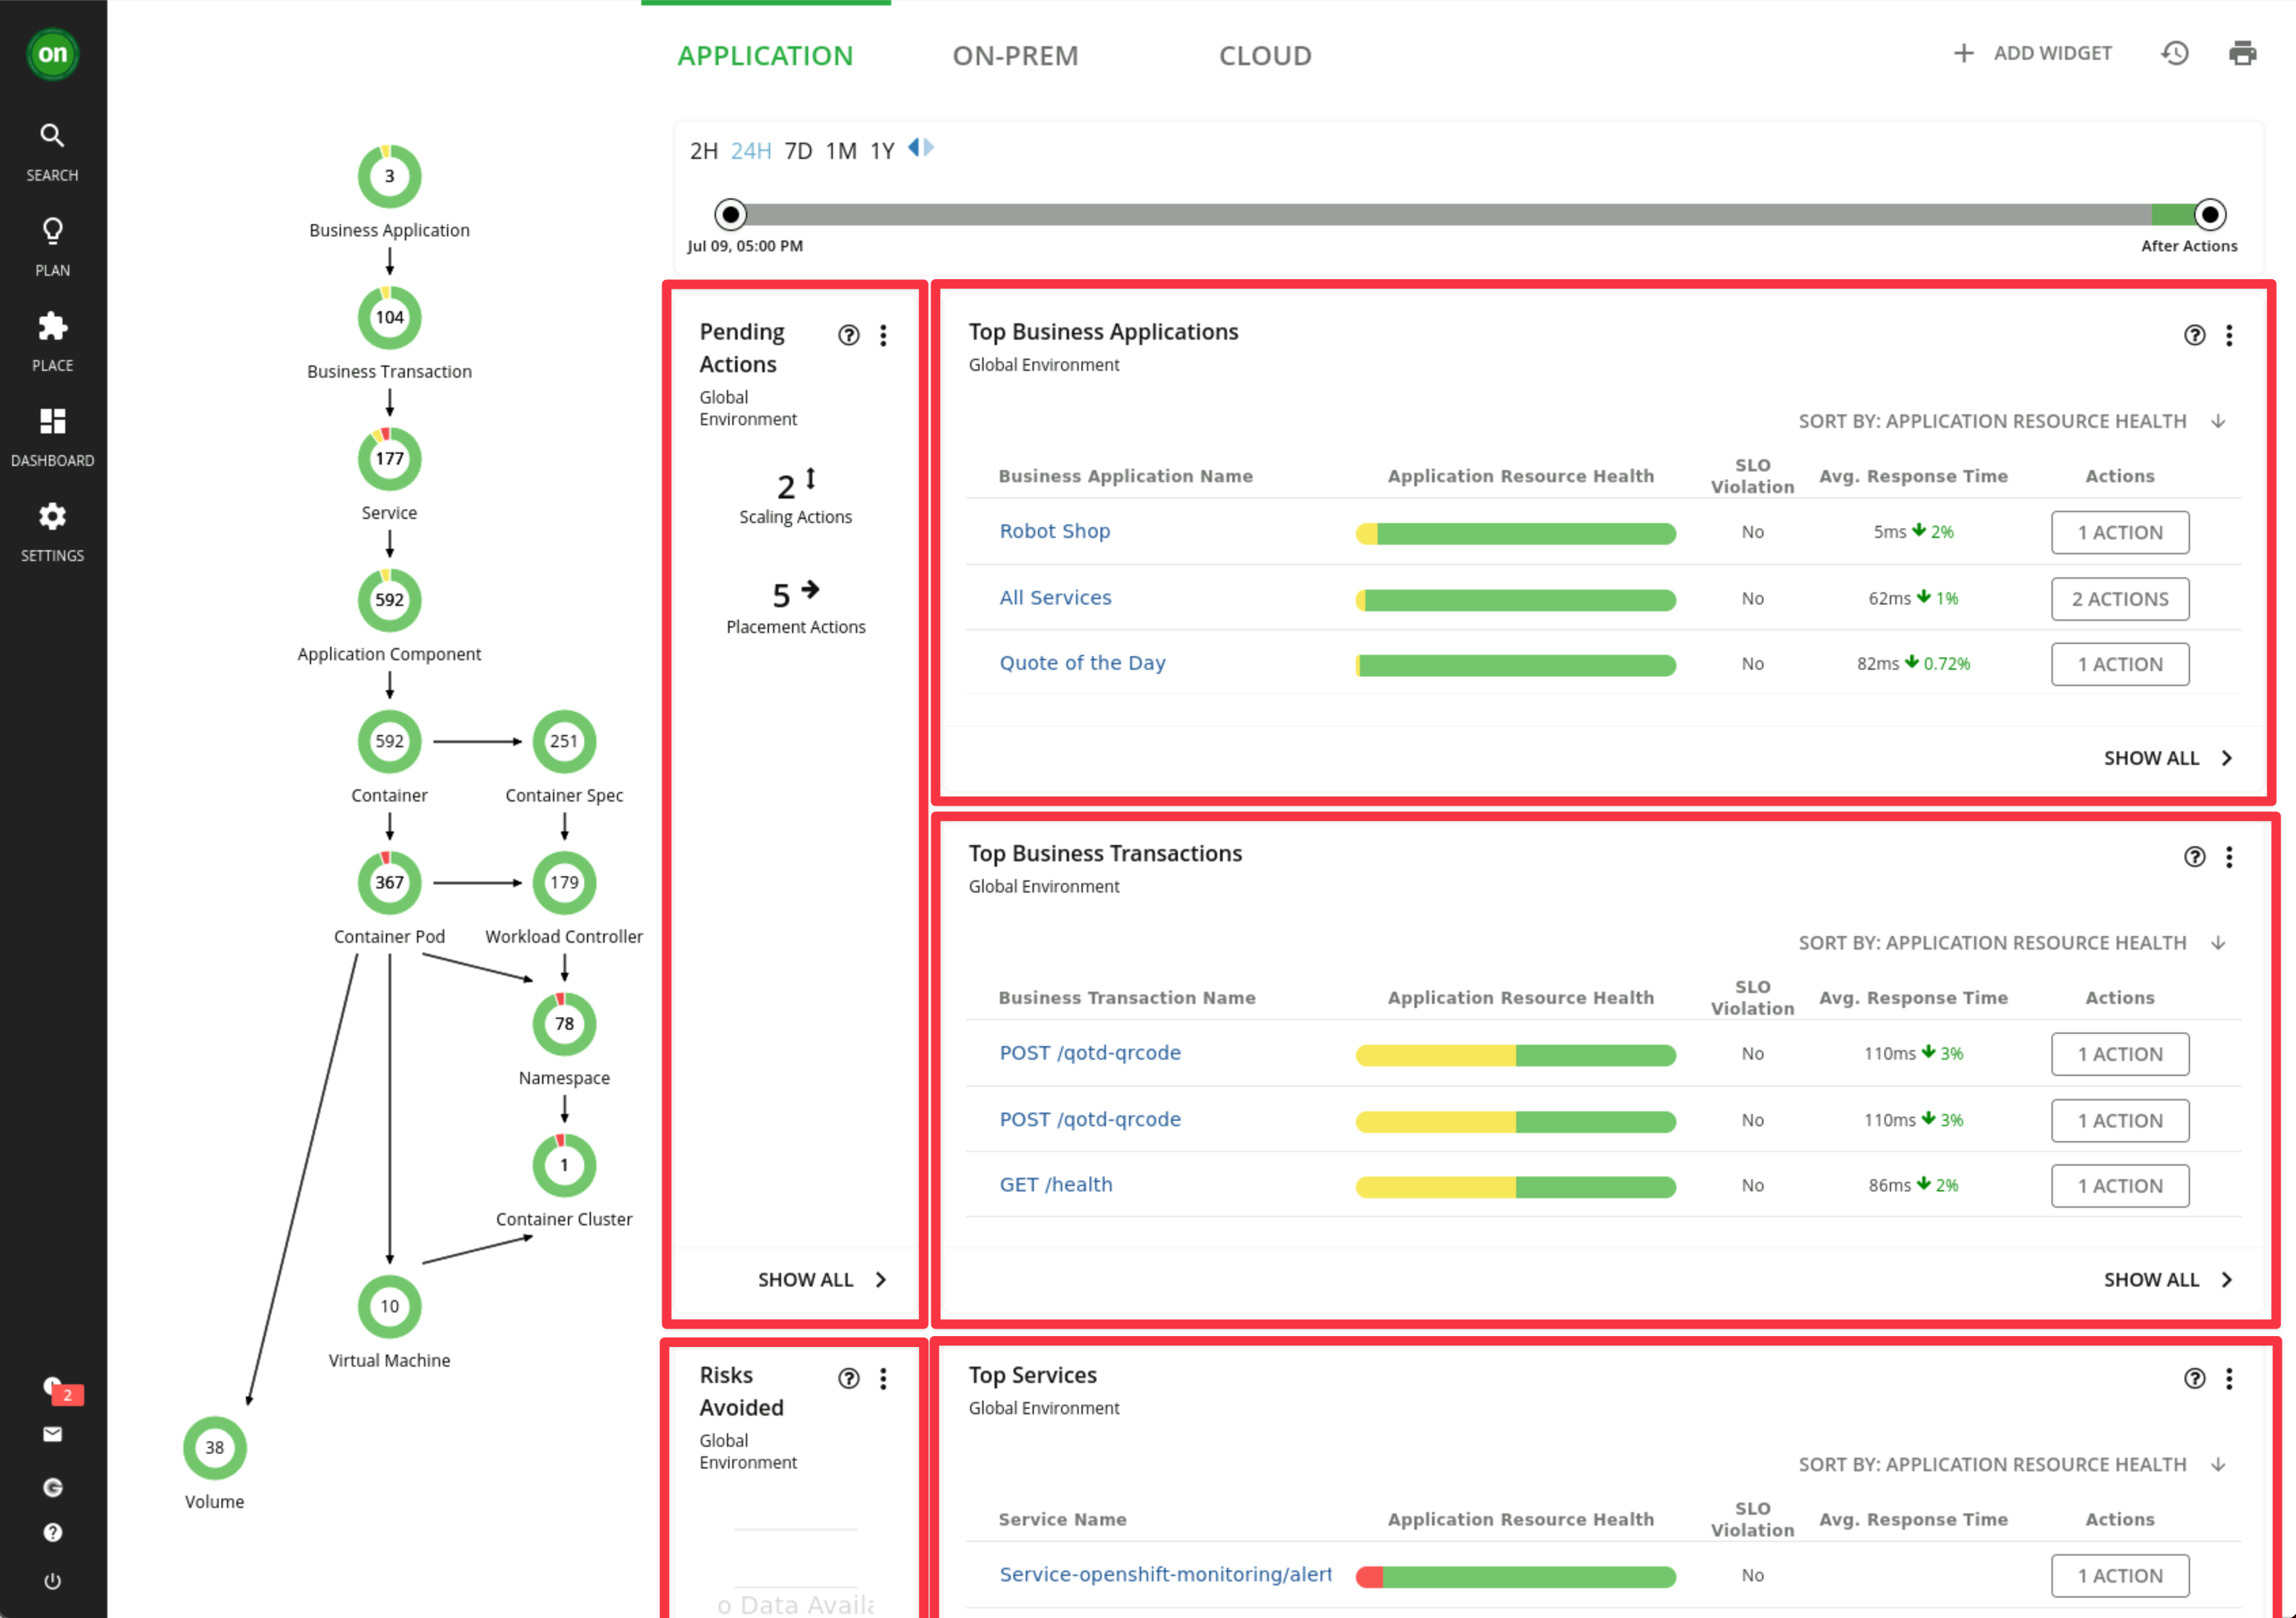
3.3: Key Terminology
Some terminology which we should be familiar with when discussing Turbonomic:
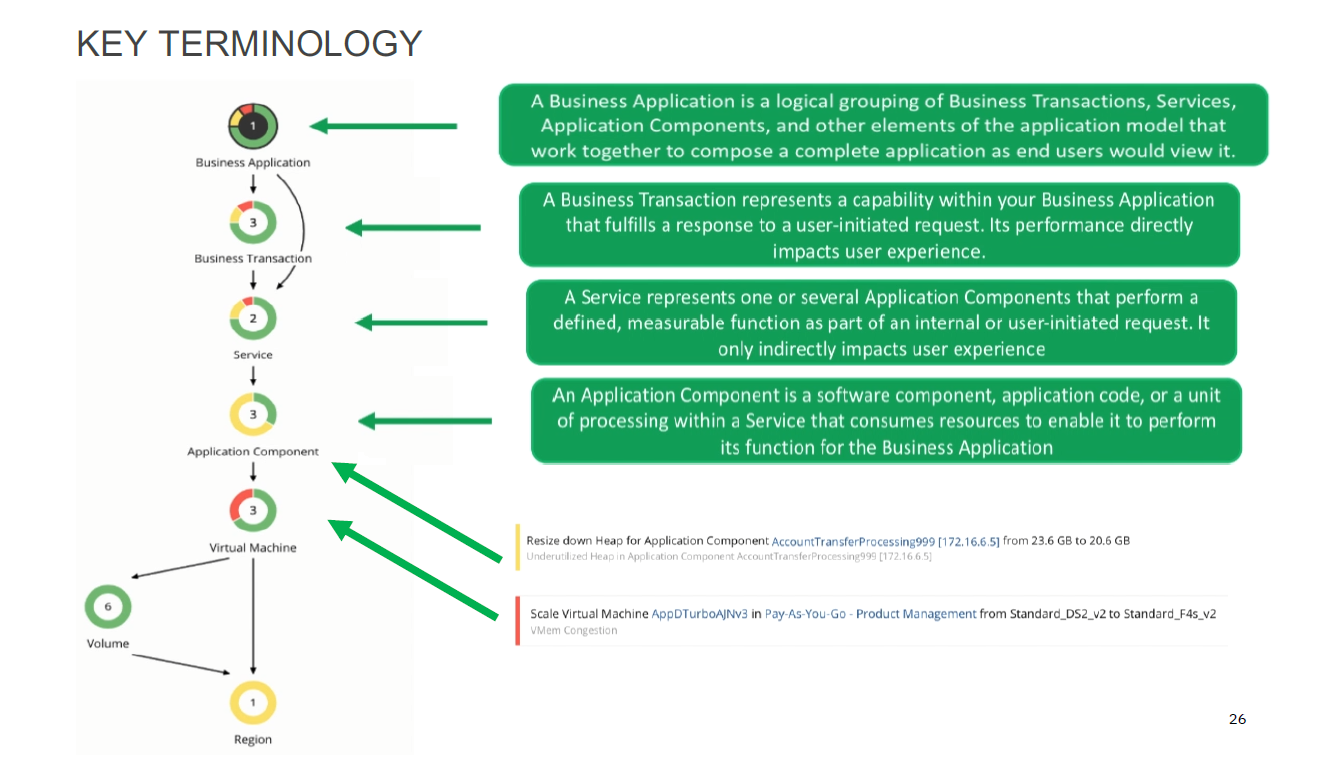
In addition to the terms defined in the diagram above, Actions are recommended for Application Components or underlying Infrastructure and propagated up the stack.
These actions are determined by Turbonomic ARM's patented analytics and take into consideration all elements of the stack holistically to ensure that the application performance is assured at all times when these actions are executed.
Fundamentally, that is the key point of ARM. No actions are recommended in isolation and always have the business critical application's performance in mind. In this way, proactive, automated steps can be taken to ensure the applications have the resources they need, when they need them.
Ultimately, these actions can mitigate against SLO breaches, which may then result in poor user experience and potentially SLA violations.
3.4: Business Application Drill Down
-
Click on your Robot Shop application from the Top Business Applications widget.
-
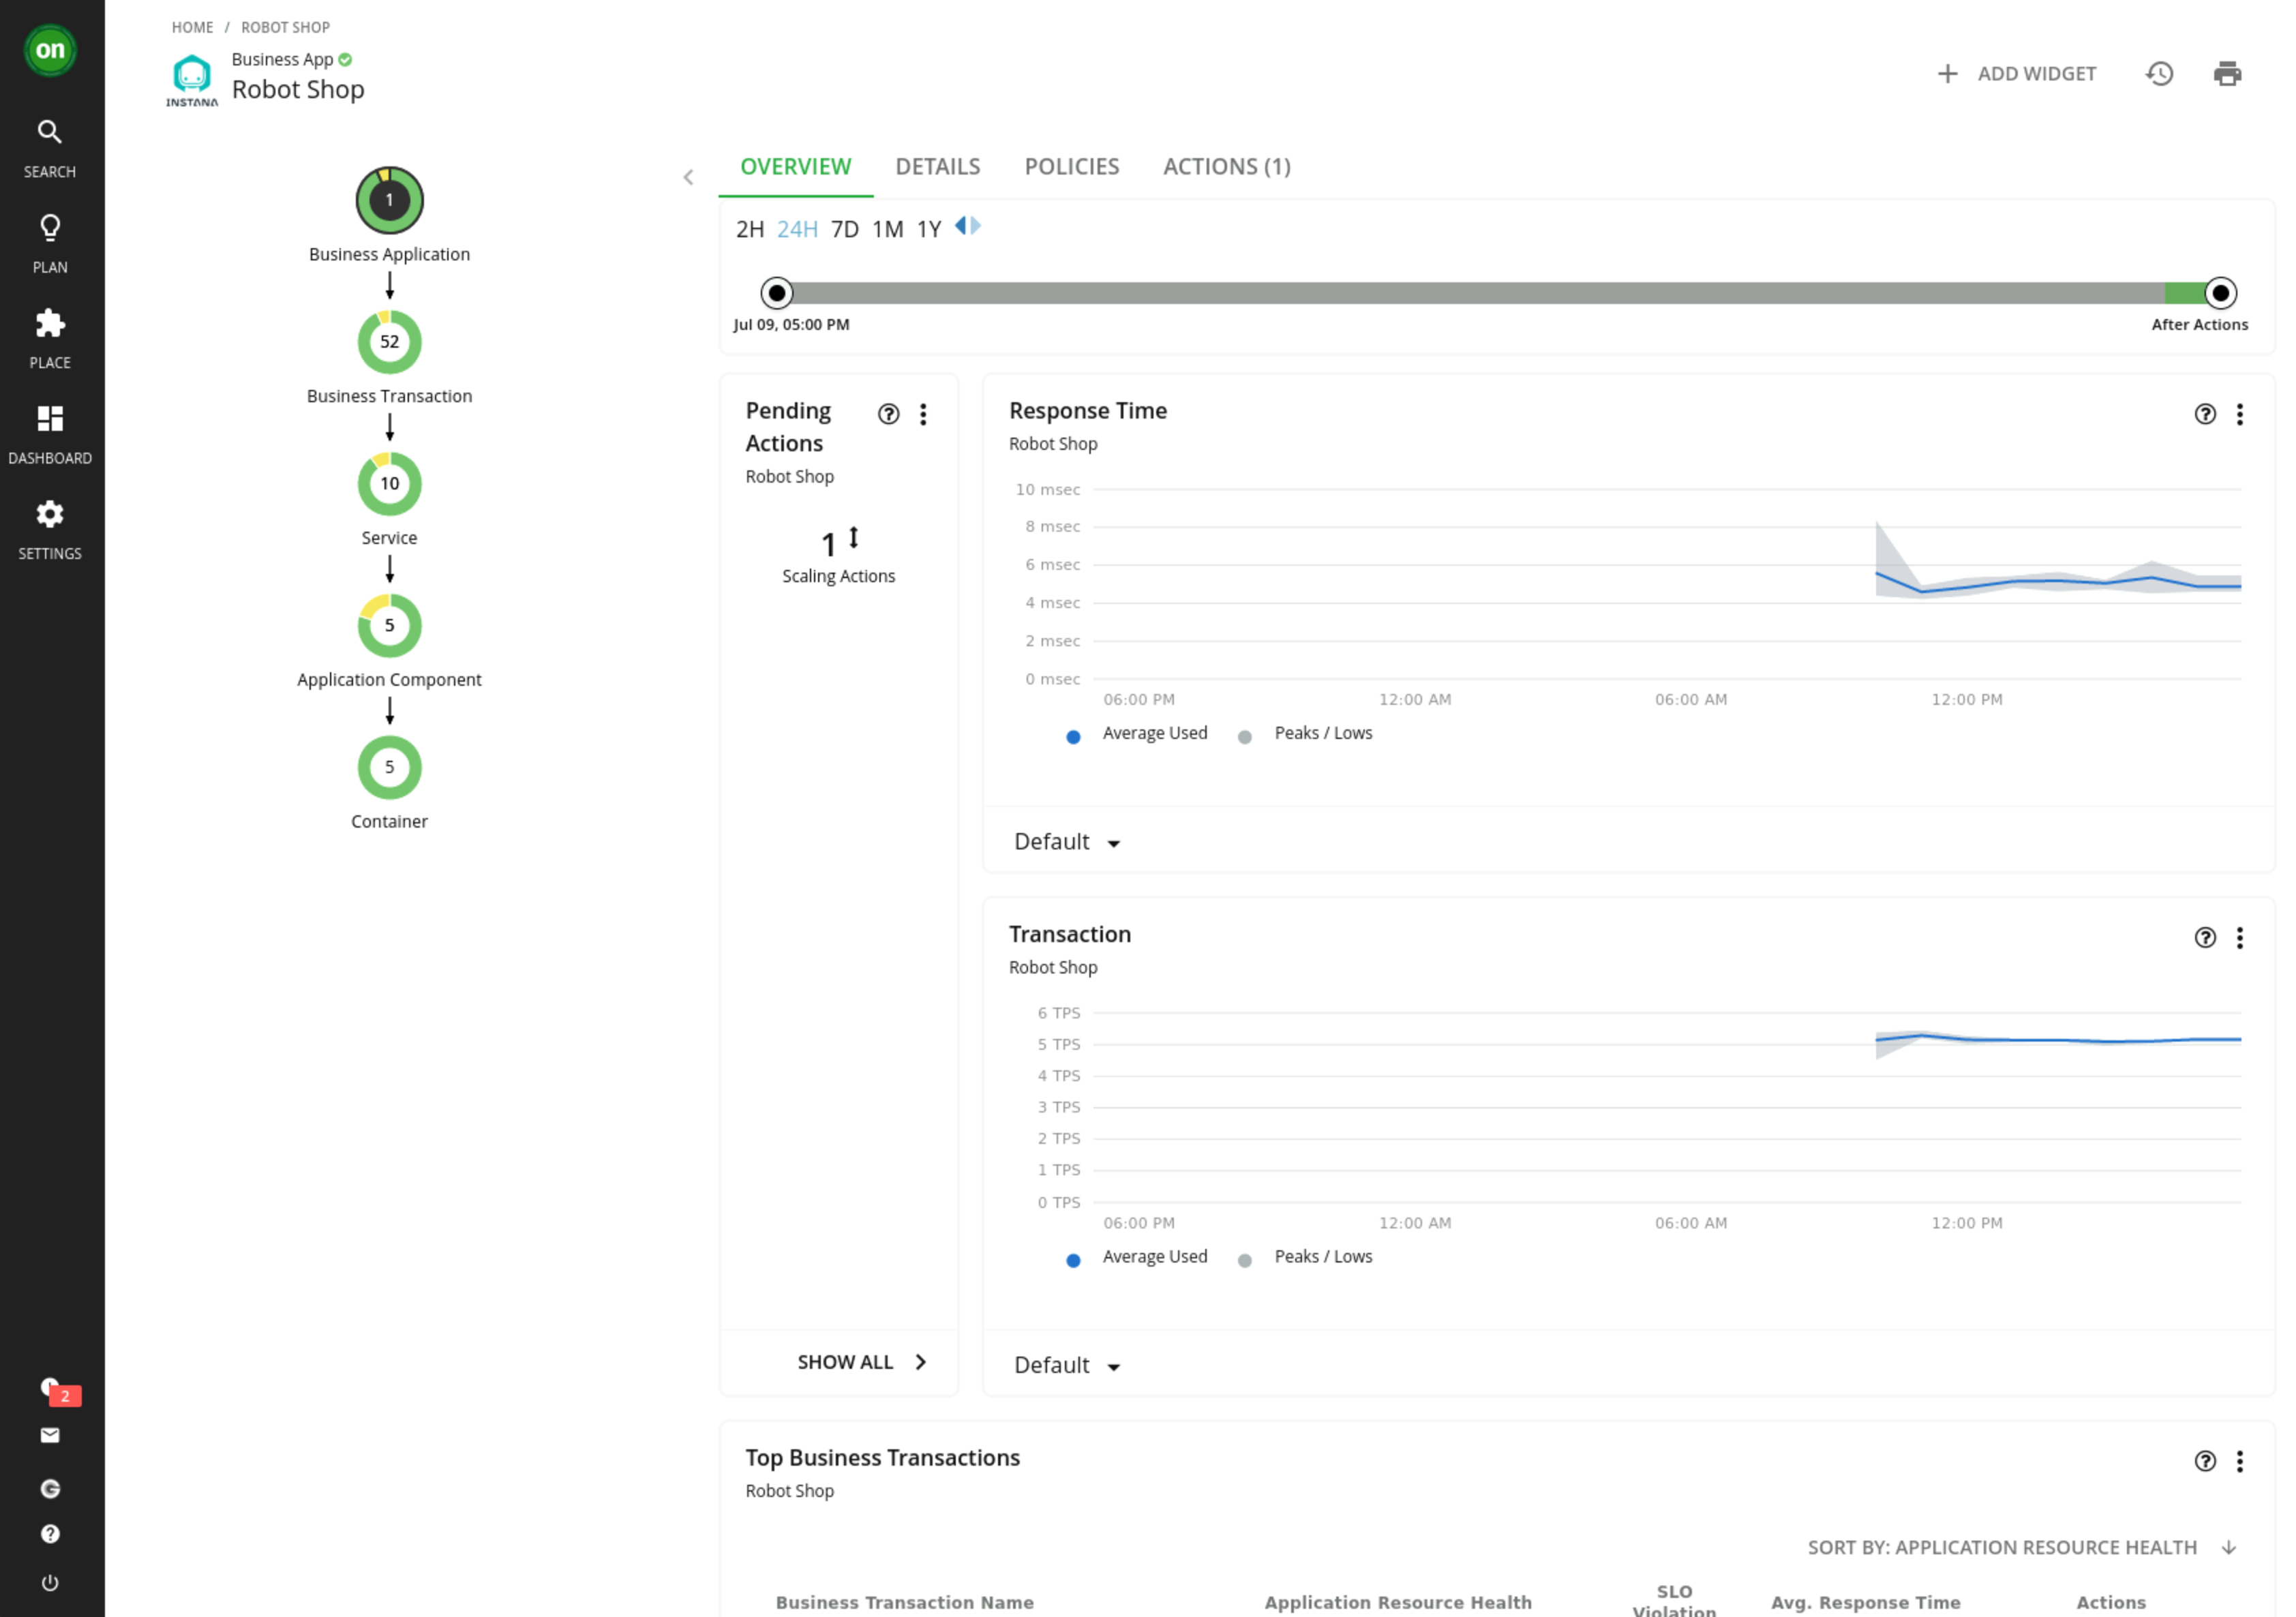
When you scope to this business application, note the supply chain has changed from showing all of the entities in the global environment to only the entities that are relevant to this specific application.
-
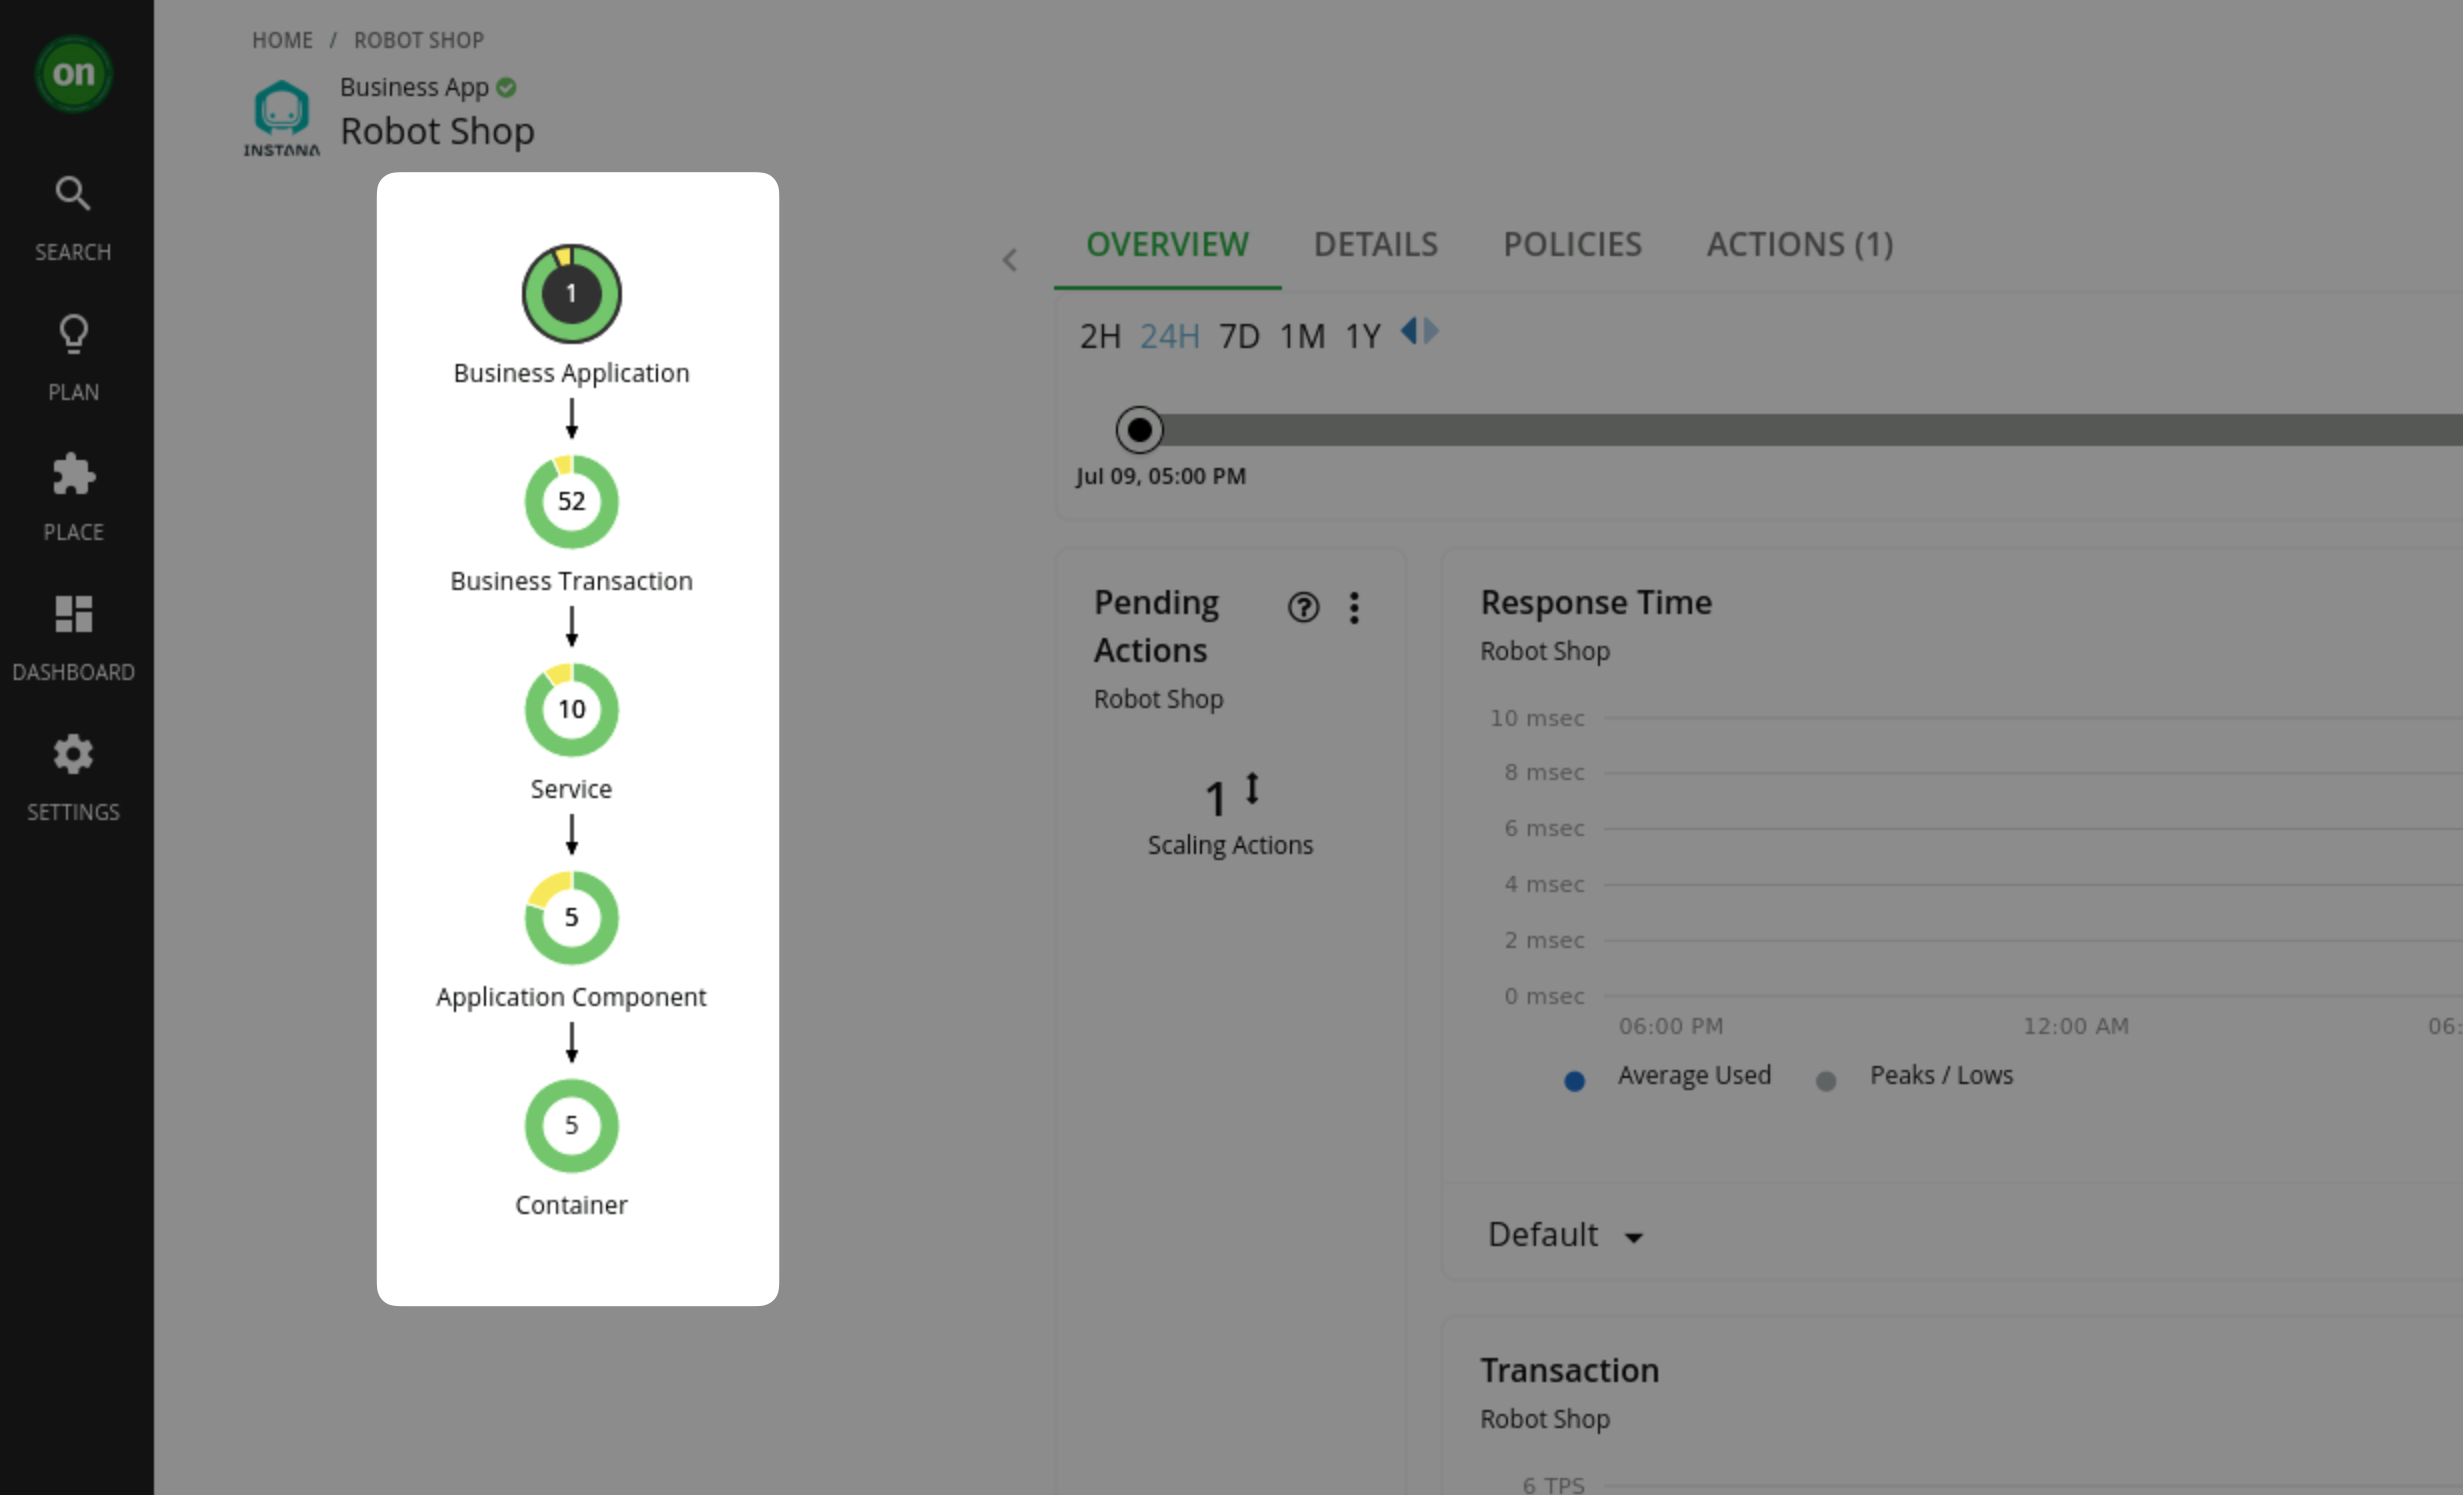
This business application consists of 52 business transactions, 10 services and 5 application components and 5 containers.
3.5: Summary
In this section, you have explored the Turbonomic UI at a high level.
Take some time and explore the UI further. When you are ready you can navigate to the next section where you will learn to install the Kubeturbo agent to be able to assure performance in a Kubernetes / OpenShift environment.