Detect patterns
With the detect patterns node, you can detect a sequence of events. As events are produced into the input streams, you can use the detect patterns node to identify a pattern from the events within a specific time window.
Scenario
A commercial website has to perform financial transactions with its bank. Each transaction allows to transfer money in several steps instead of a single huge transfer. Each step of the transaction generates an event containing the unique identifier of the transaction, the transmitted amount of money, a timestamp and the state of the transaction that can be one of STARTED, PROCESSING or COMPLETED.
You can use the detect patterns node to identify if there is a failed transaction. To do that, you can detect a pattern for a transaction where there is an event with STARTED state, followed by two events with PROCESSING state, but are not followed by an event with COMPLETED state within seven minutes.
Before you begin
The instructions in this tutorial use the Tutorial environment, which includes a selection of topics each with a live stream of events, created to allow you to explore features in IBM Event Automation. Following the setup instructions to deploy the demo environment gives you a complete instance of IBM Event Automation that you can use to follow this tutorial for yourself.
Versions
This tutorial uses the following versions of Event Automation capabilities. Screenshots can differ from the current interface if you are using a newer version.
- Event Endpoint Management 11.6.4
- Event Processing 1.4.6
Instructions
Step 1: Discover the topics to use
For this scenario, you need a source for the Transactions events.
-
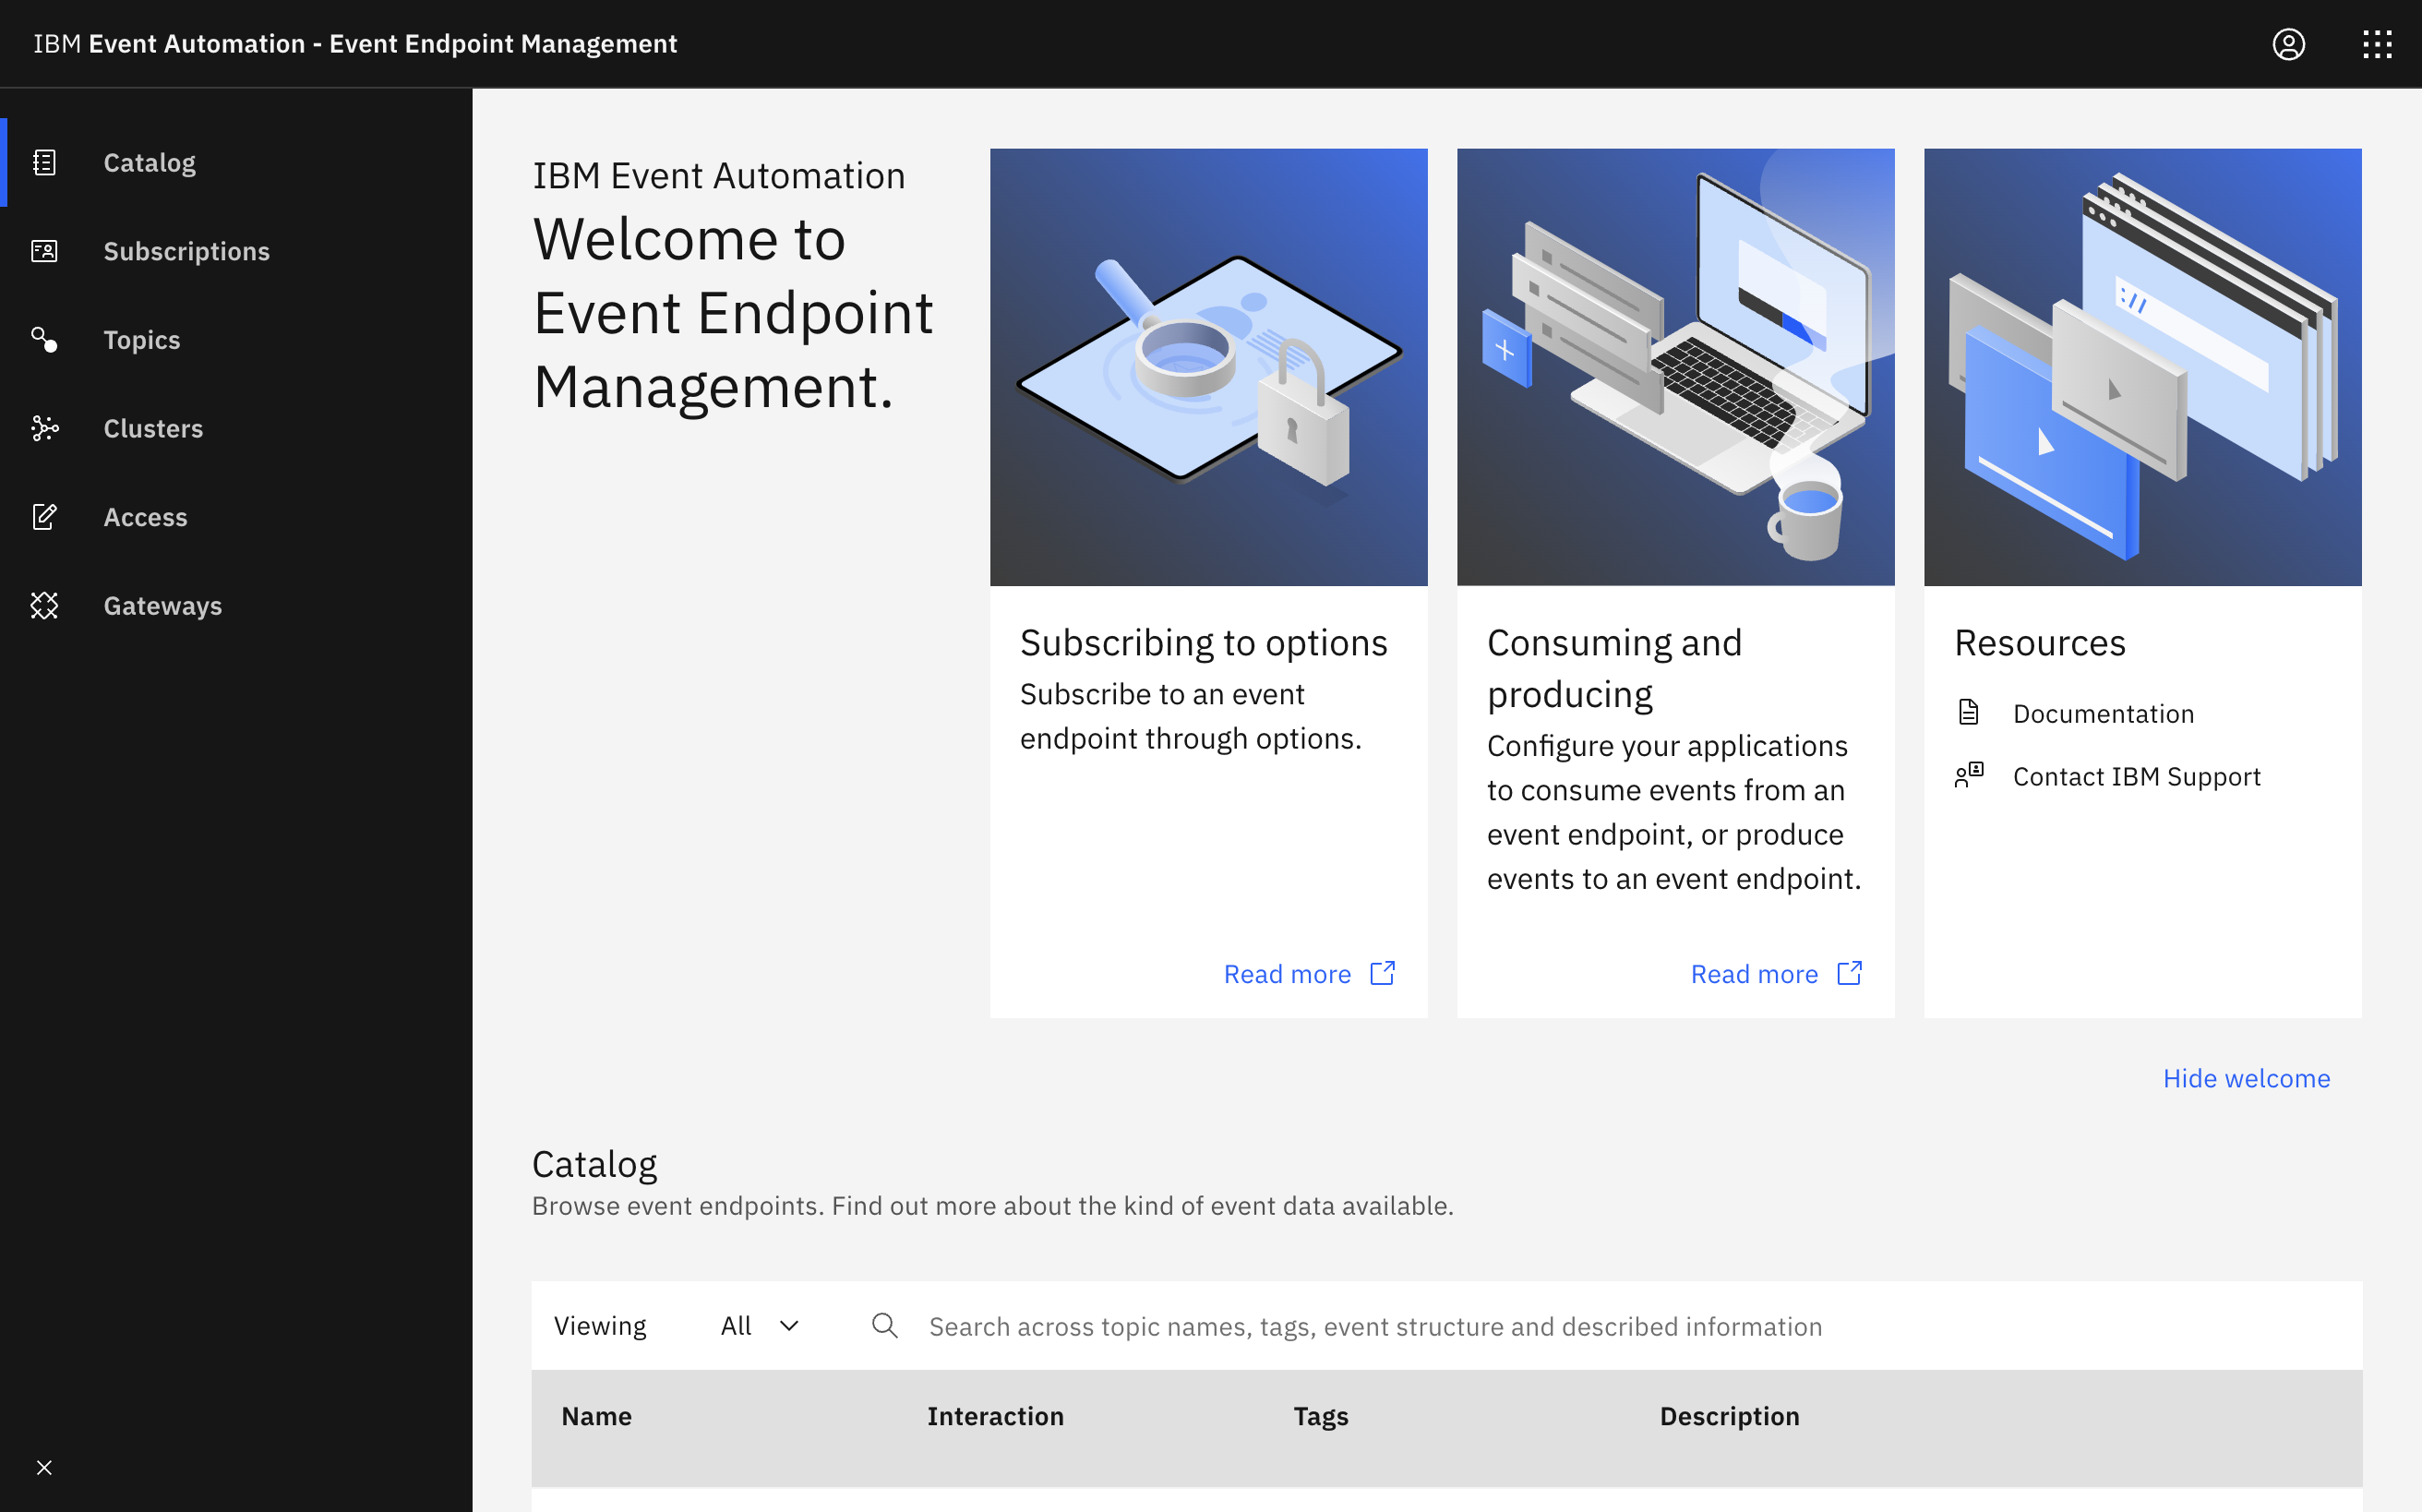
Go to the Event Endpoint Management catalog.
If you need a reminder about how to access the Event Endpoint Management catalog, you can review Accessing the tutorial environment.
If there are no topics in the catalog, you might need to complete the tutorial setup step to populate the catalog.
-
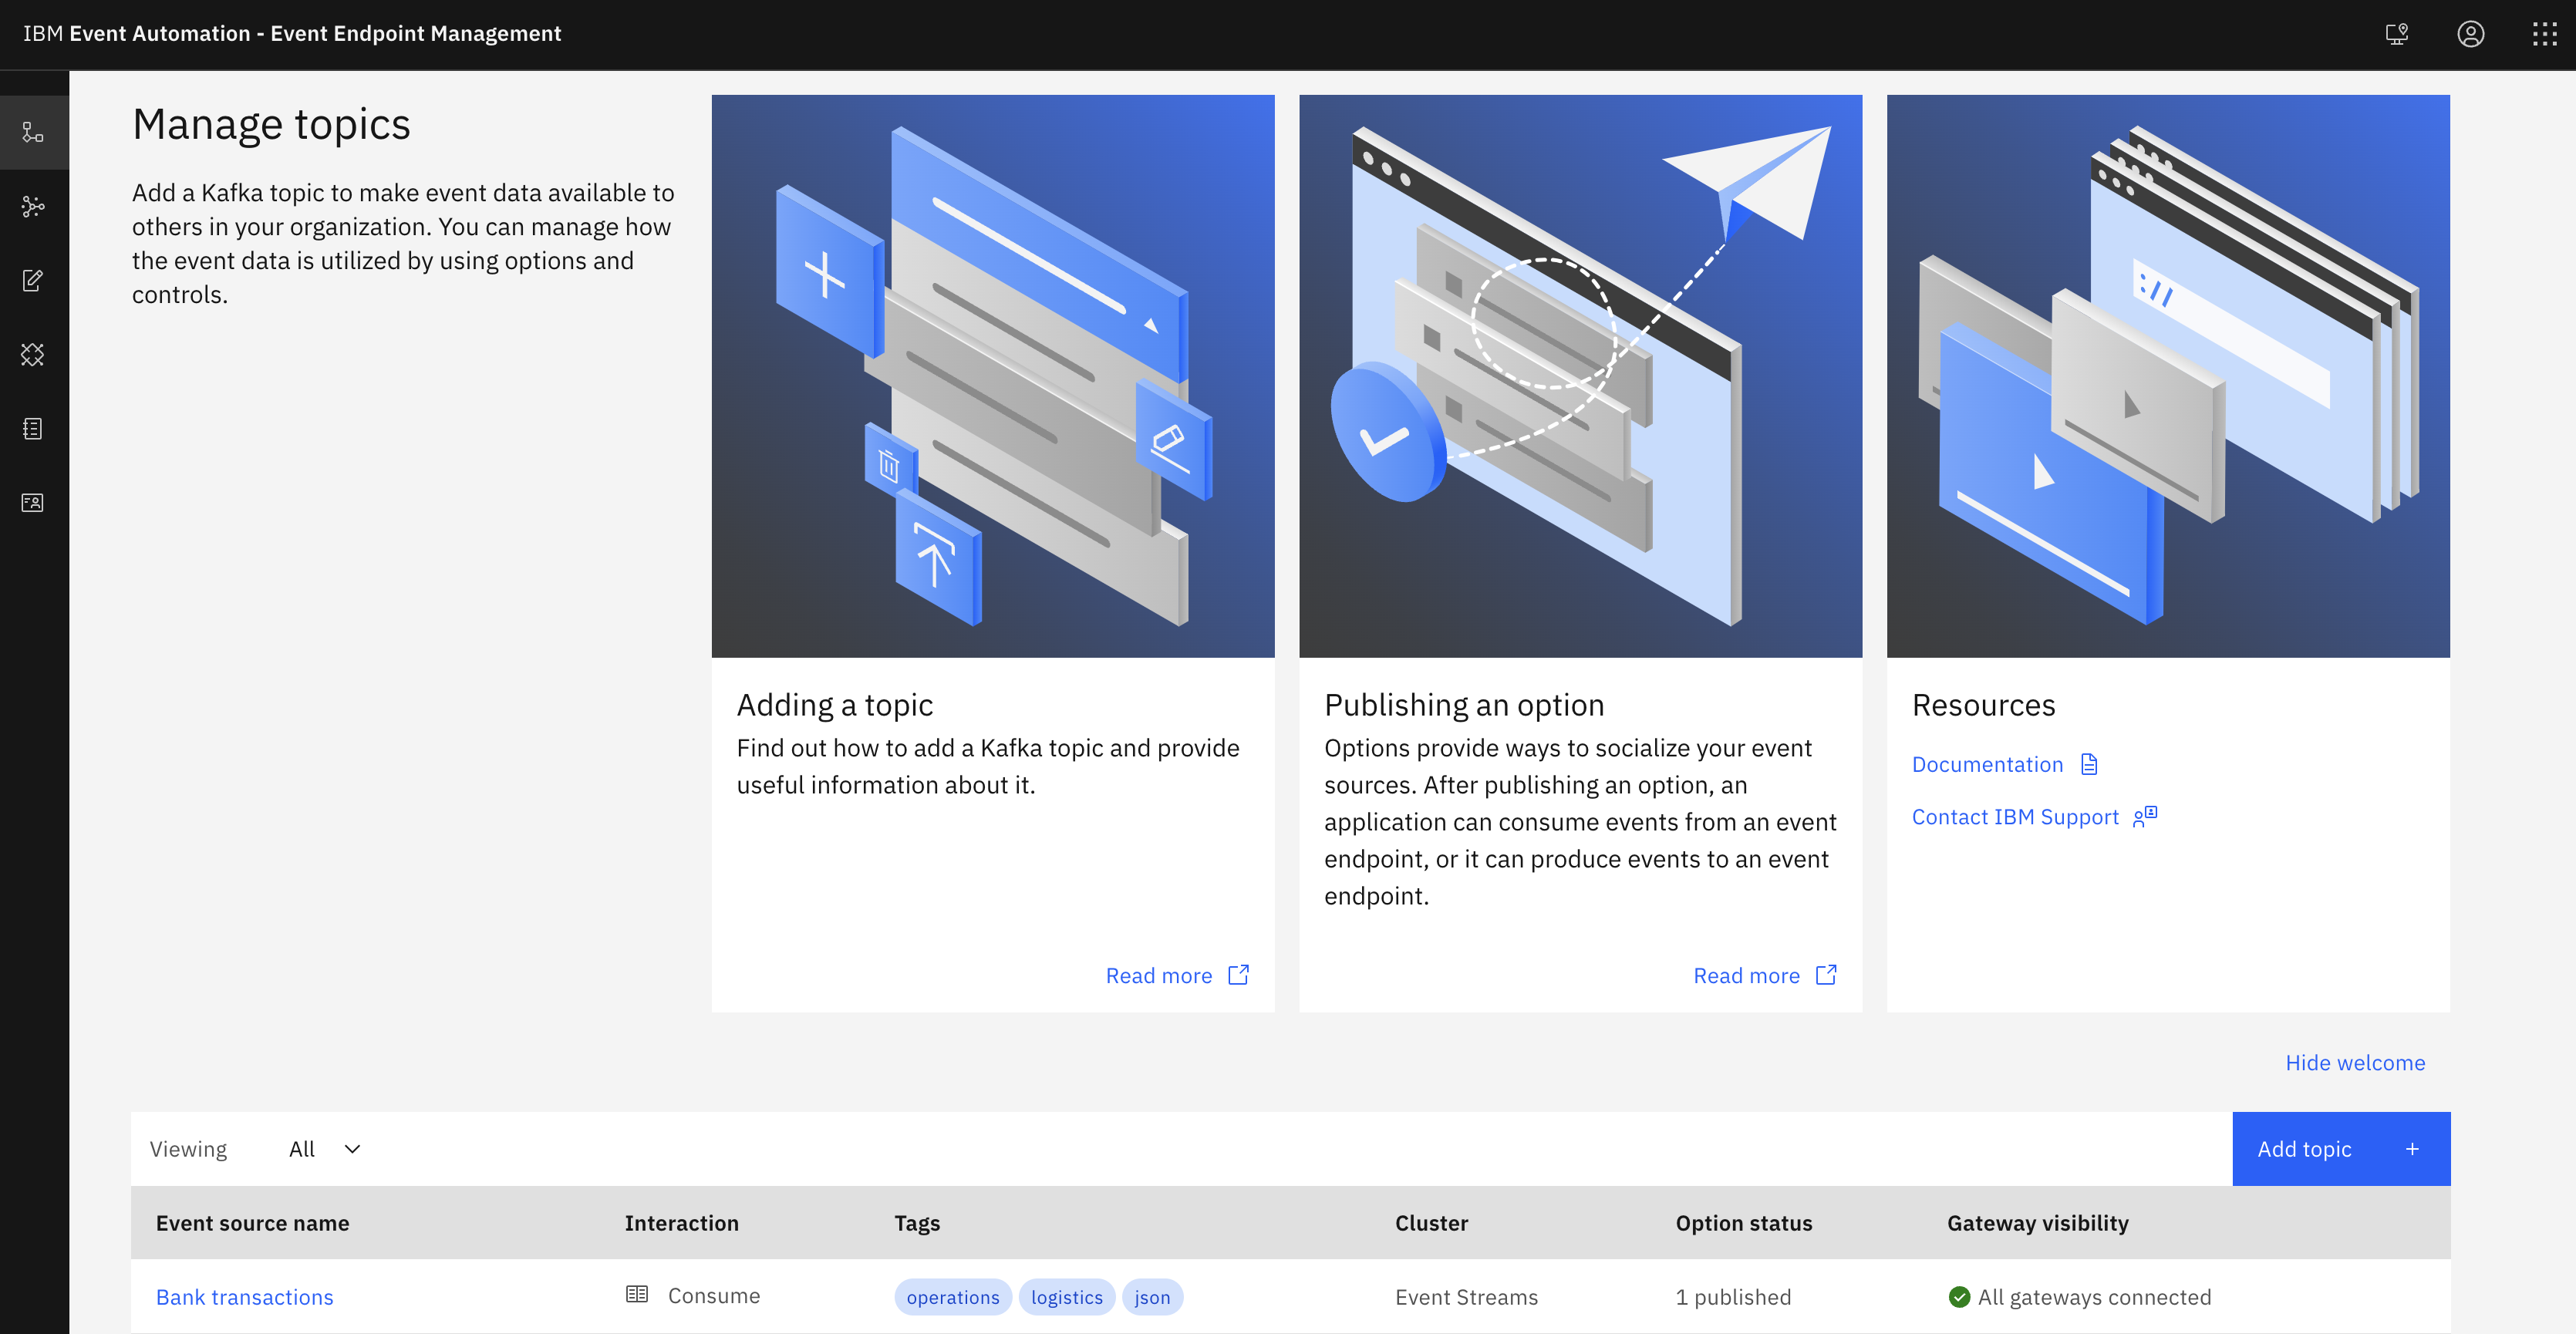
Find the
Transactionstopics. -
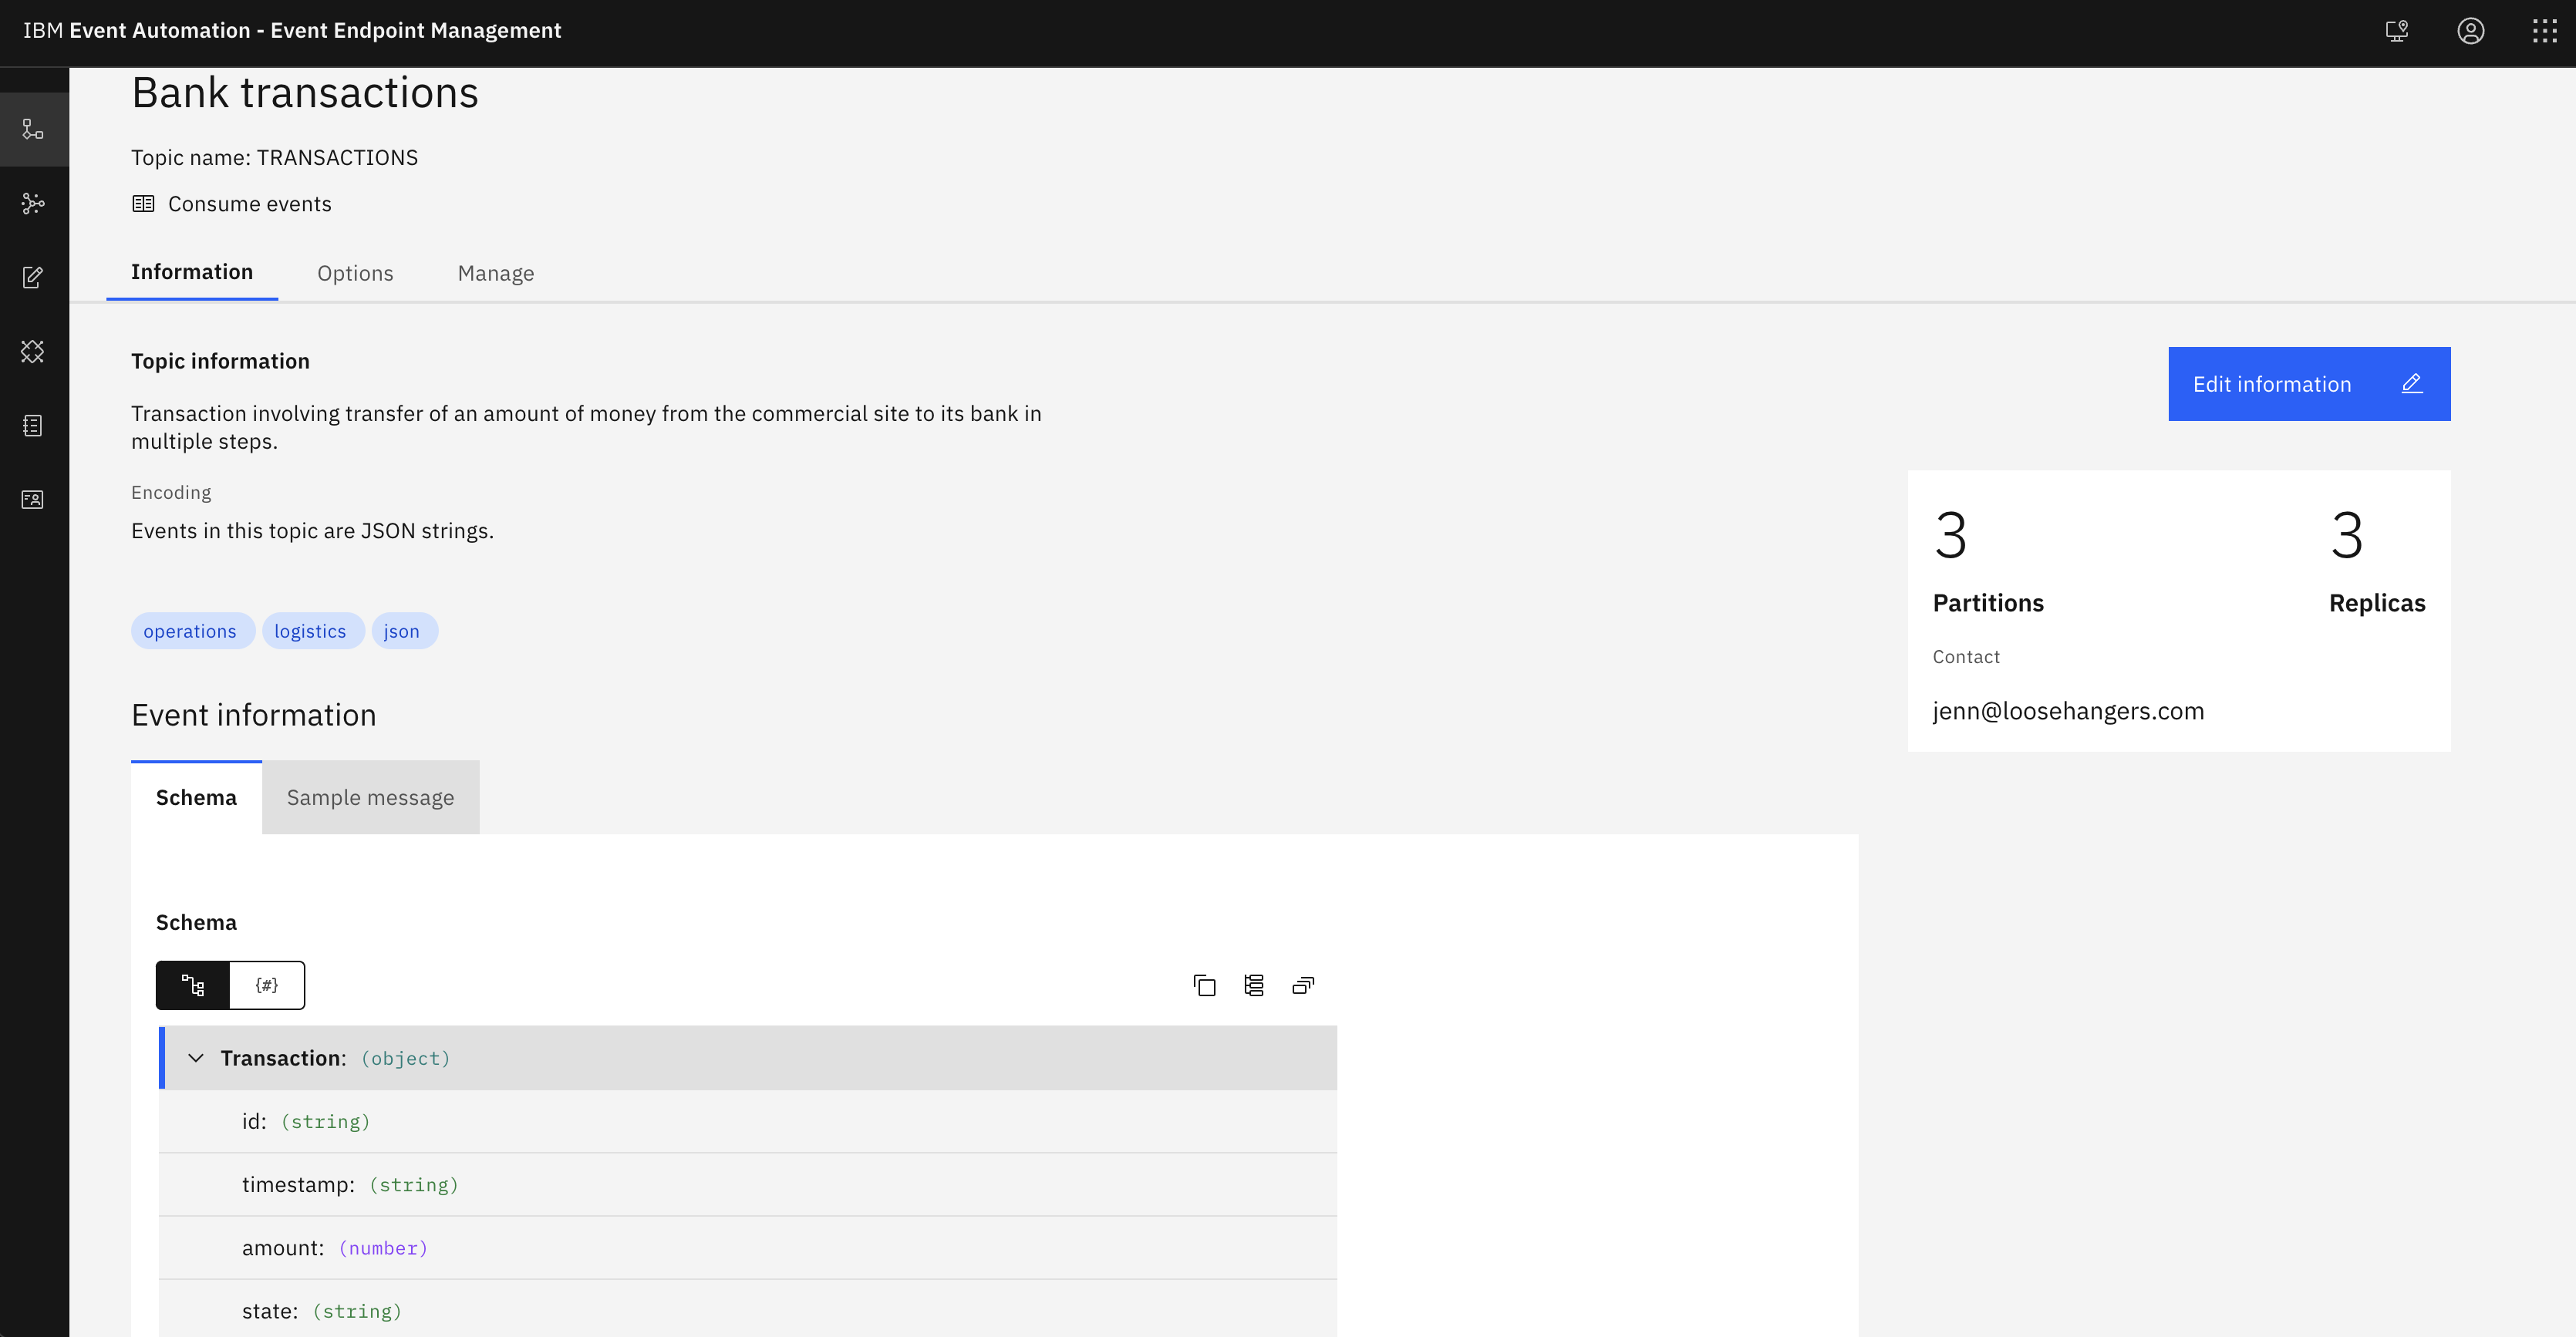
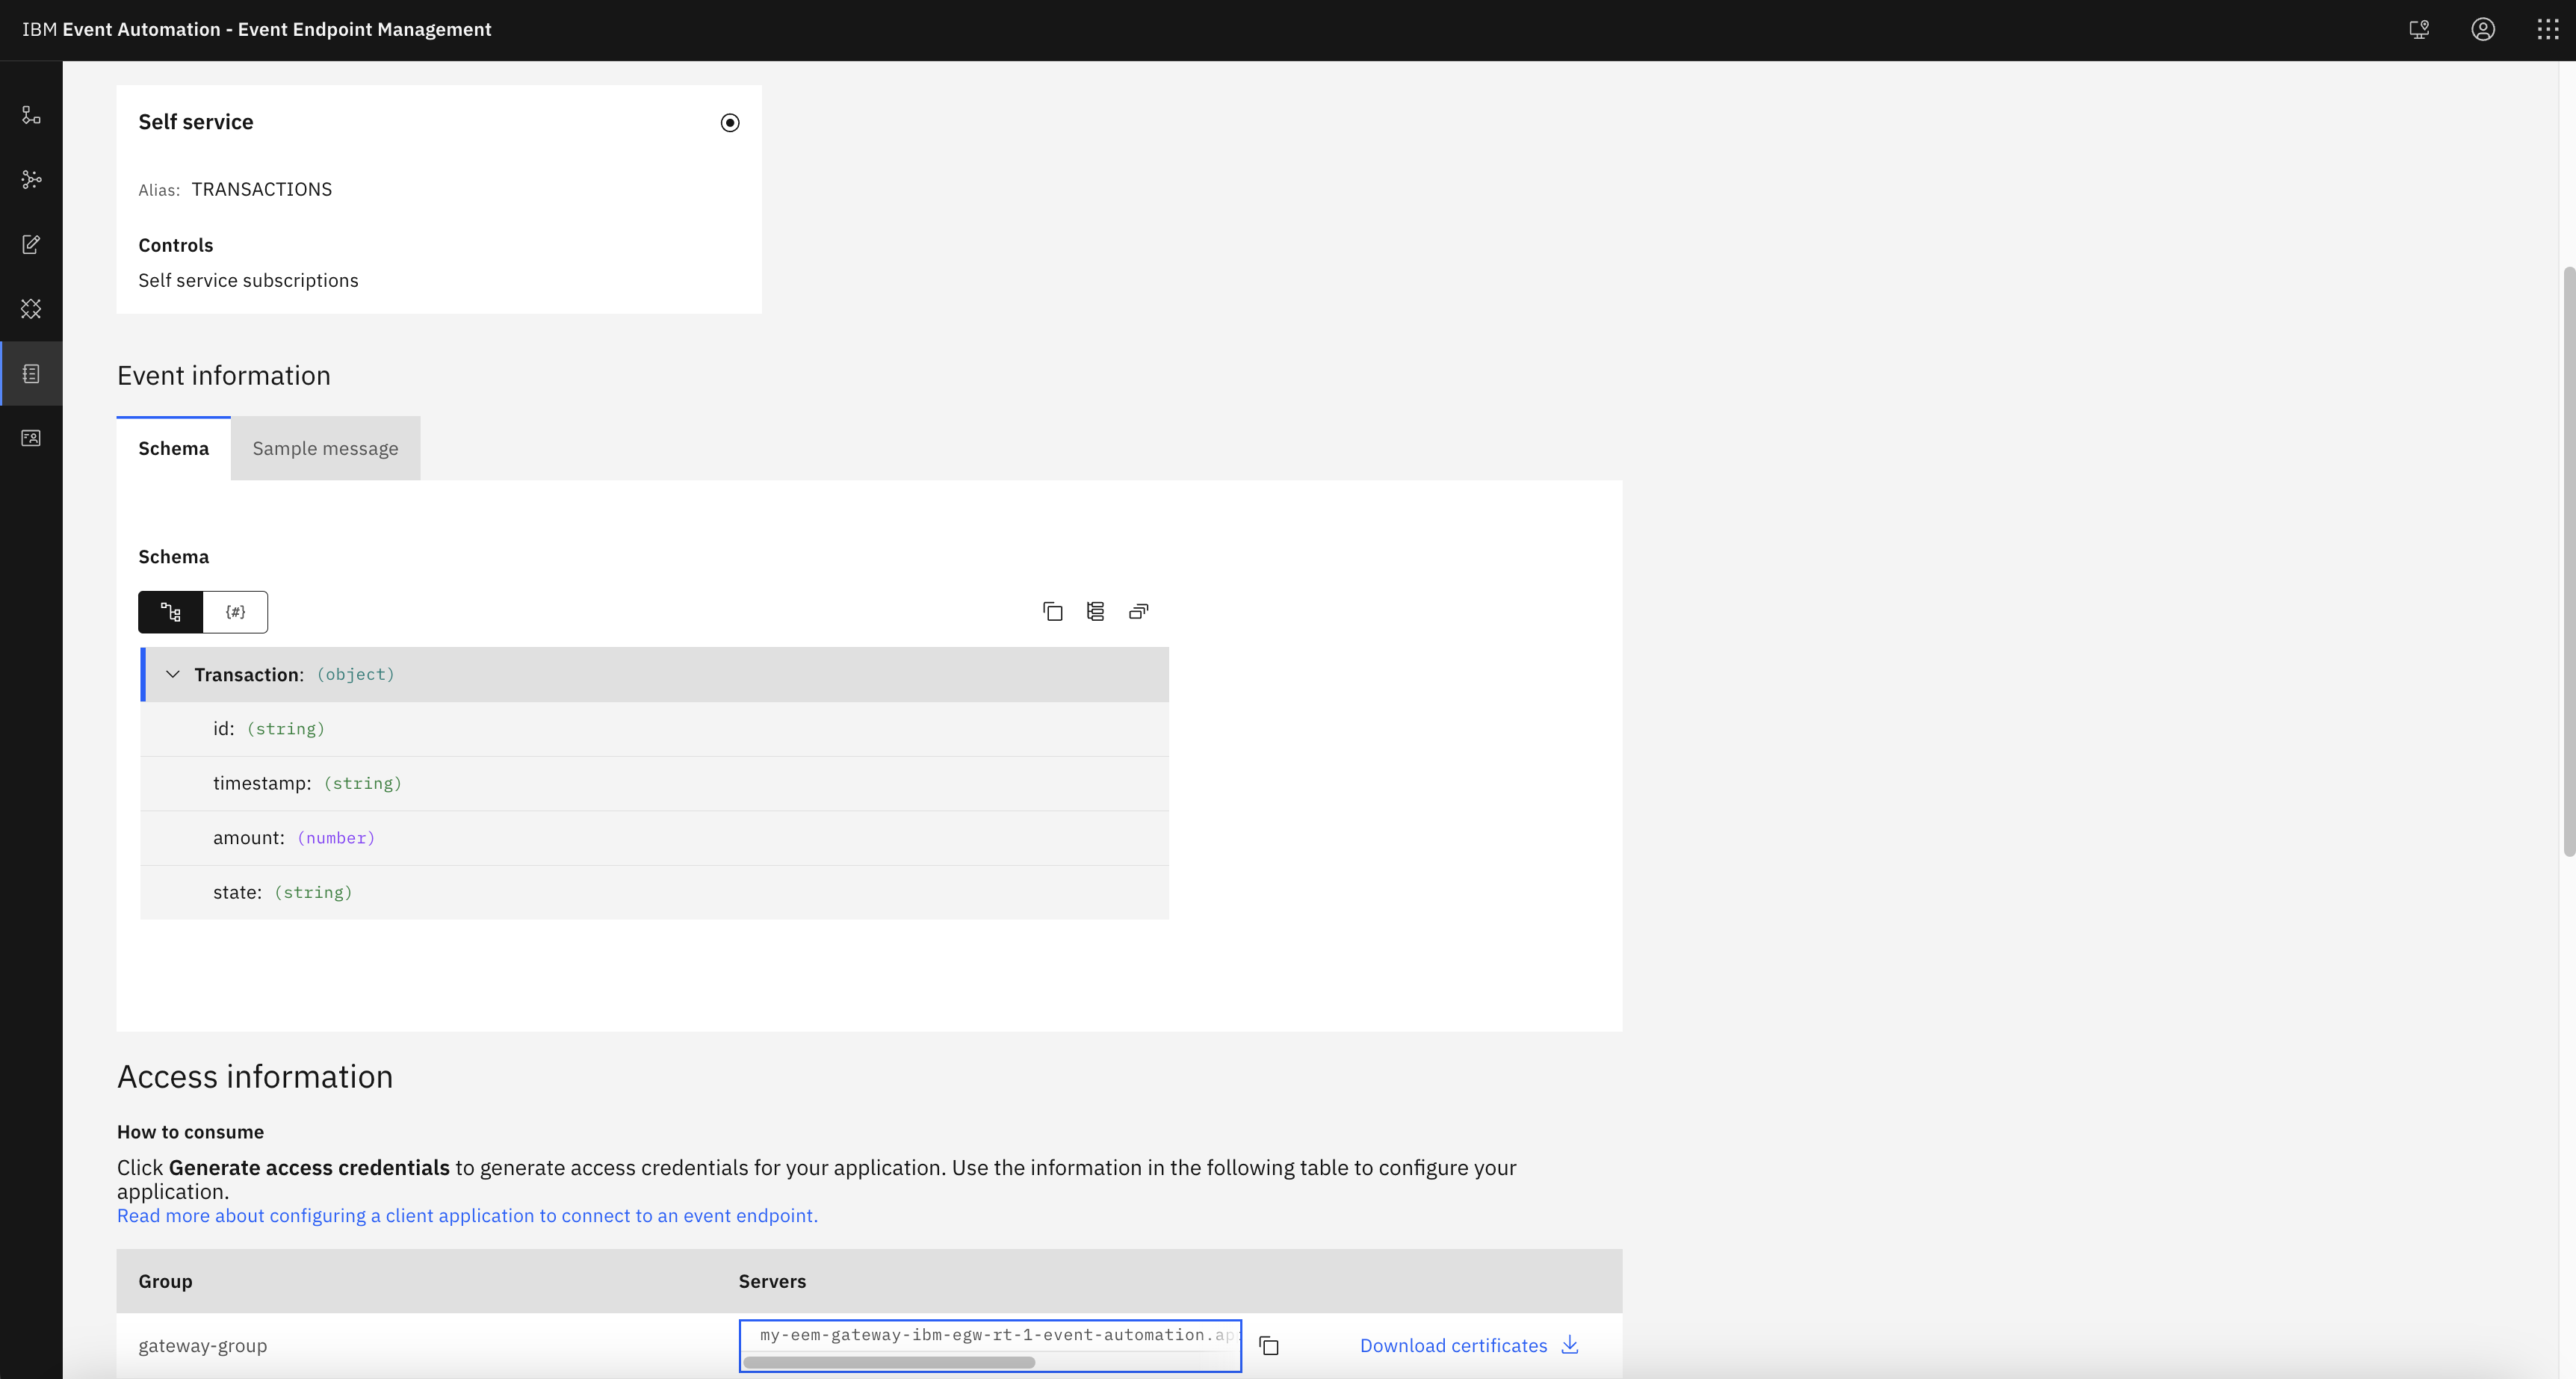
Click into the topics to review the information about the events that are available here. Look at the schema to see the properties in the events, and get an idea of what to expect from events on these topics.
Step 2: Create a flow
To create a flow, complete the following steps:
-
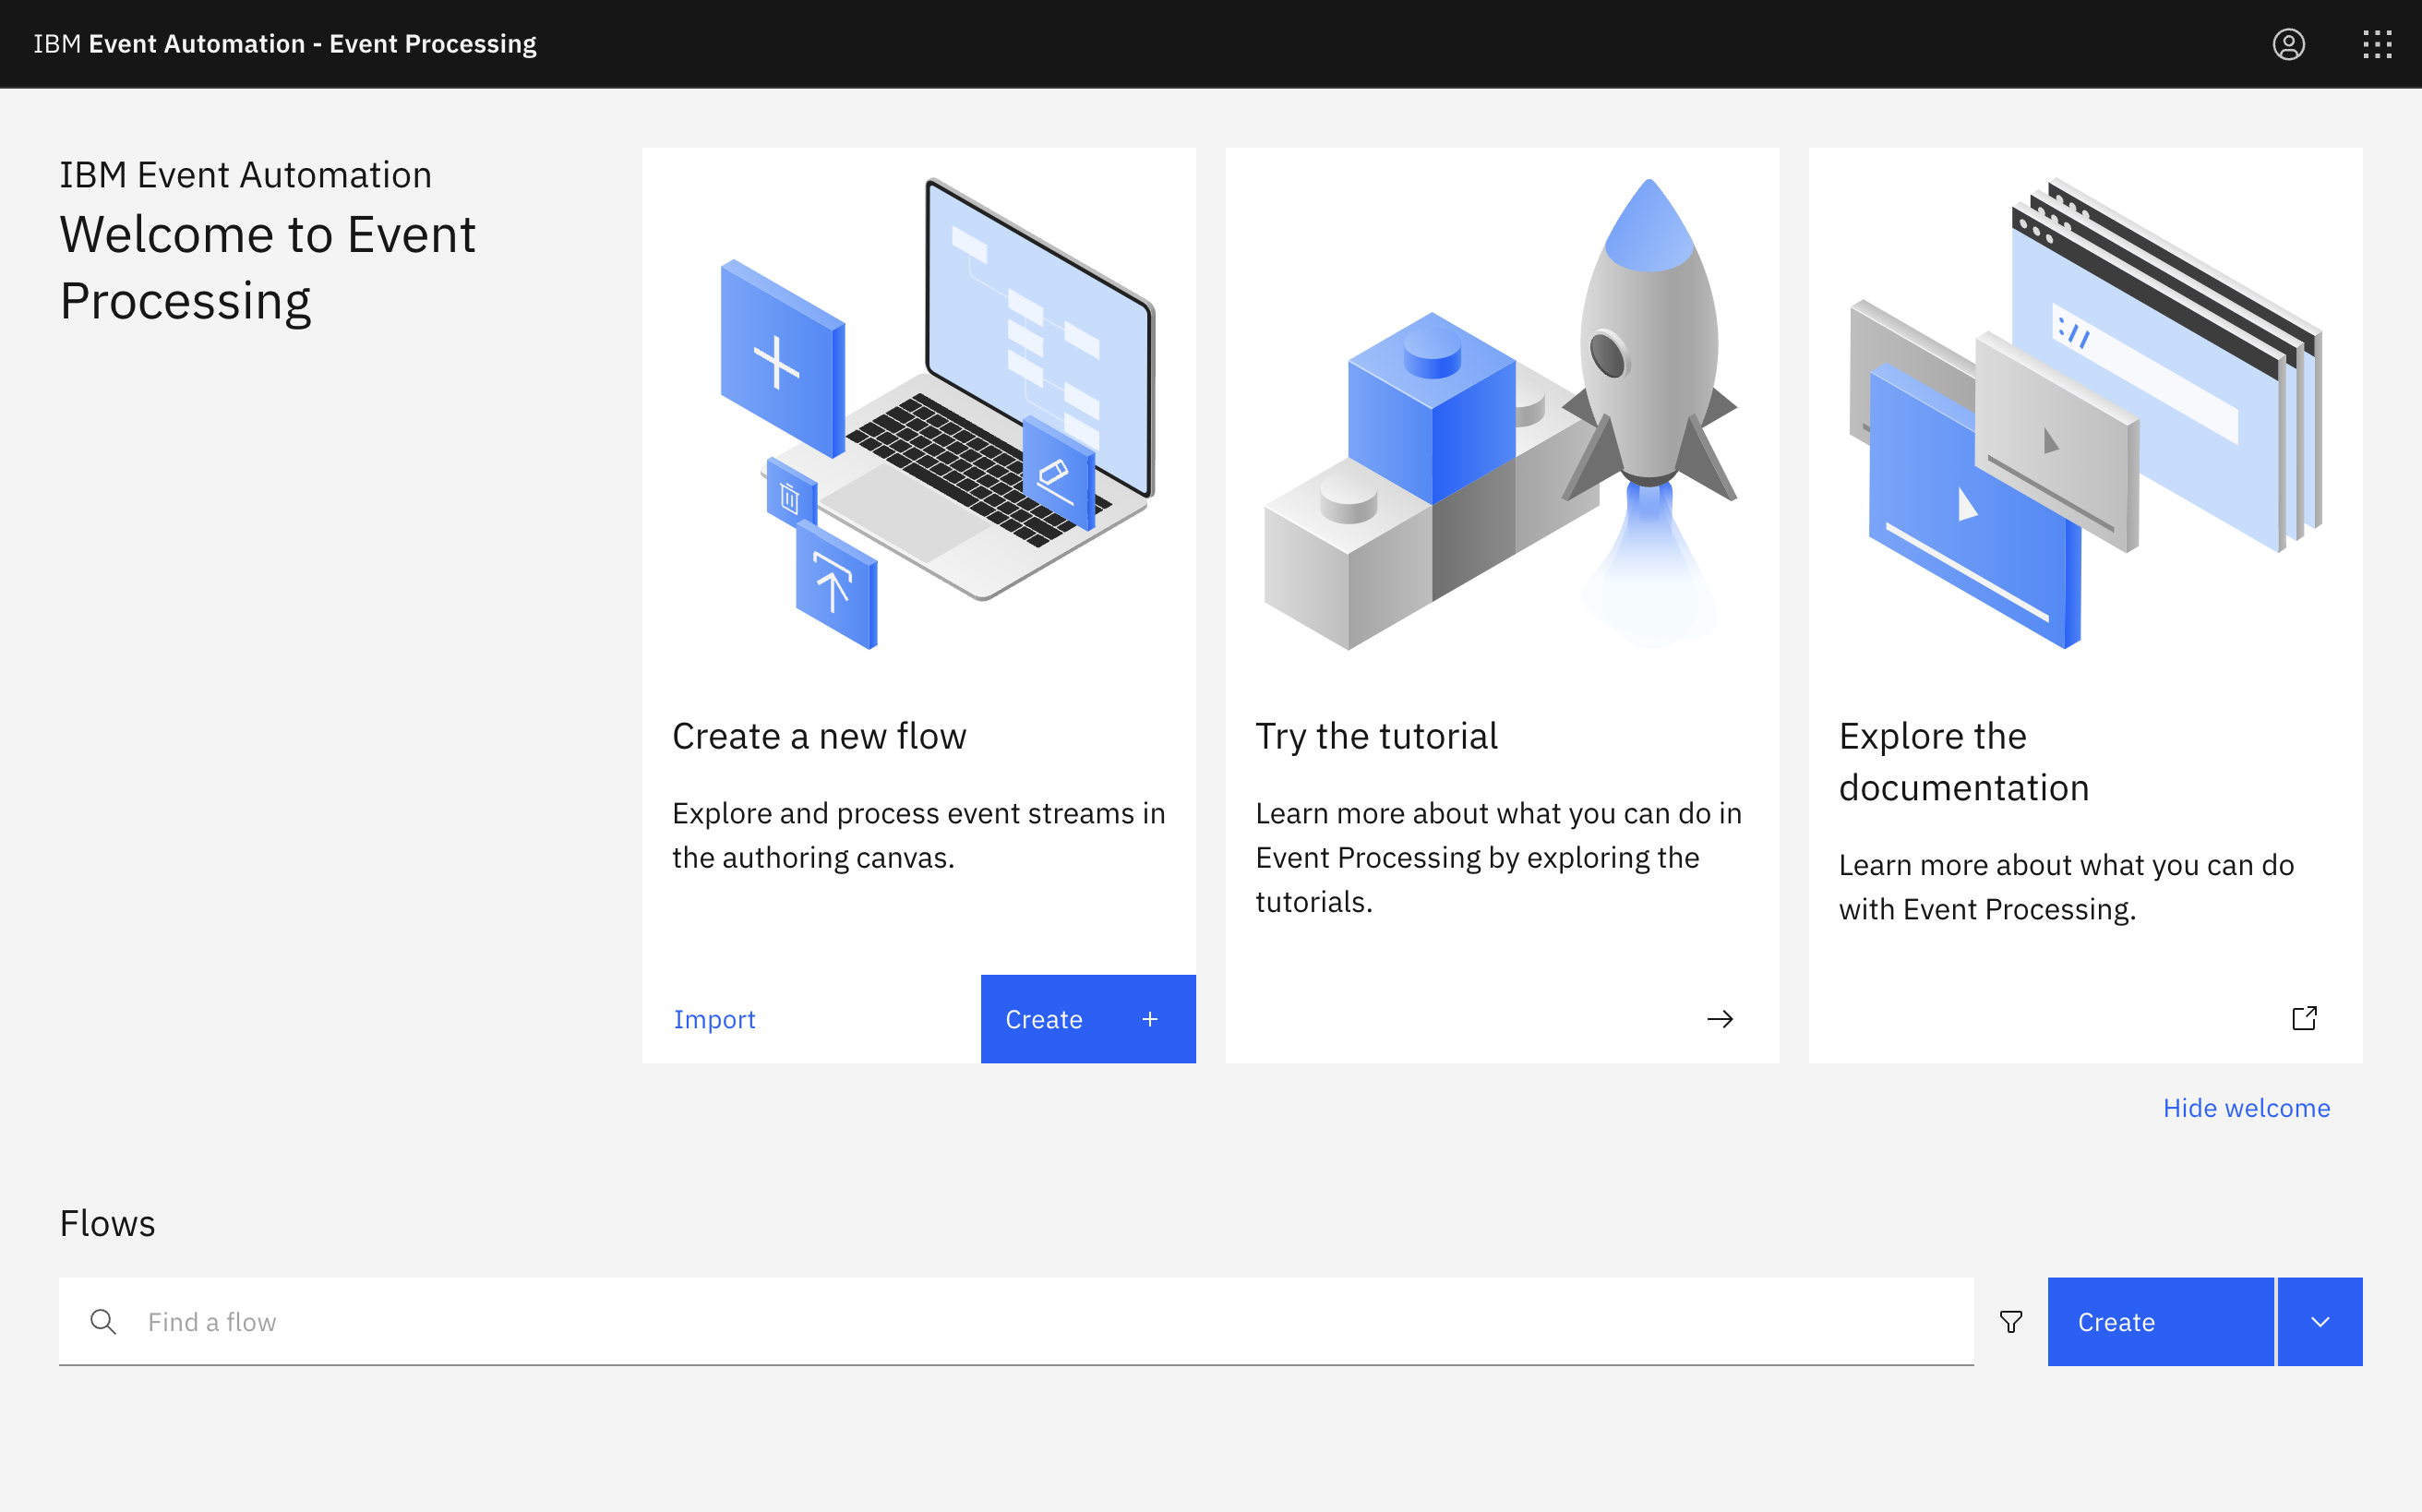
Go to the Event Processing home page.
If you need a reminder about how to access the Event Processing home page, you can review Accessing the tutorial environment.
-
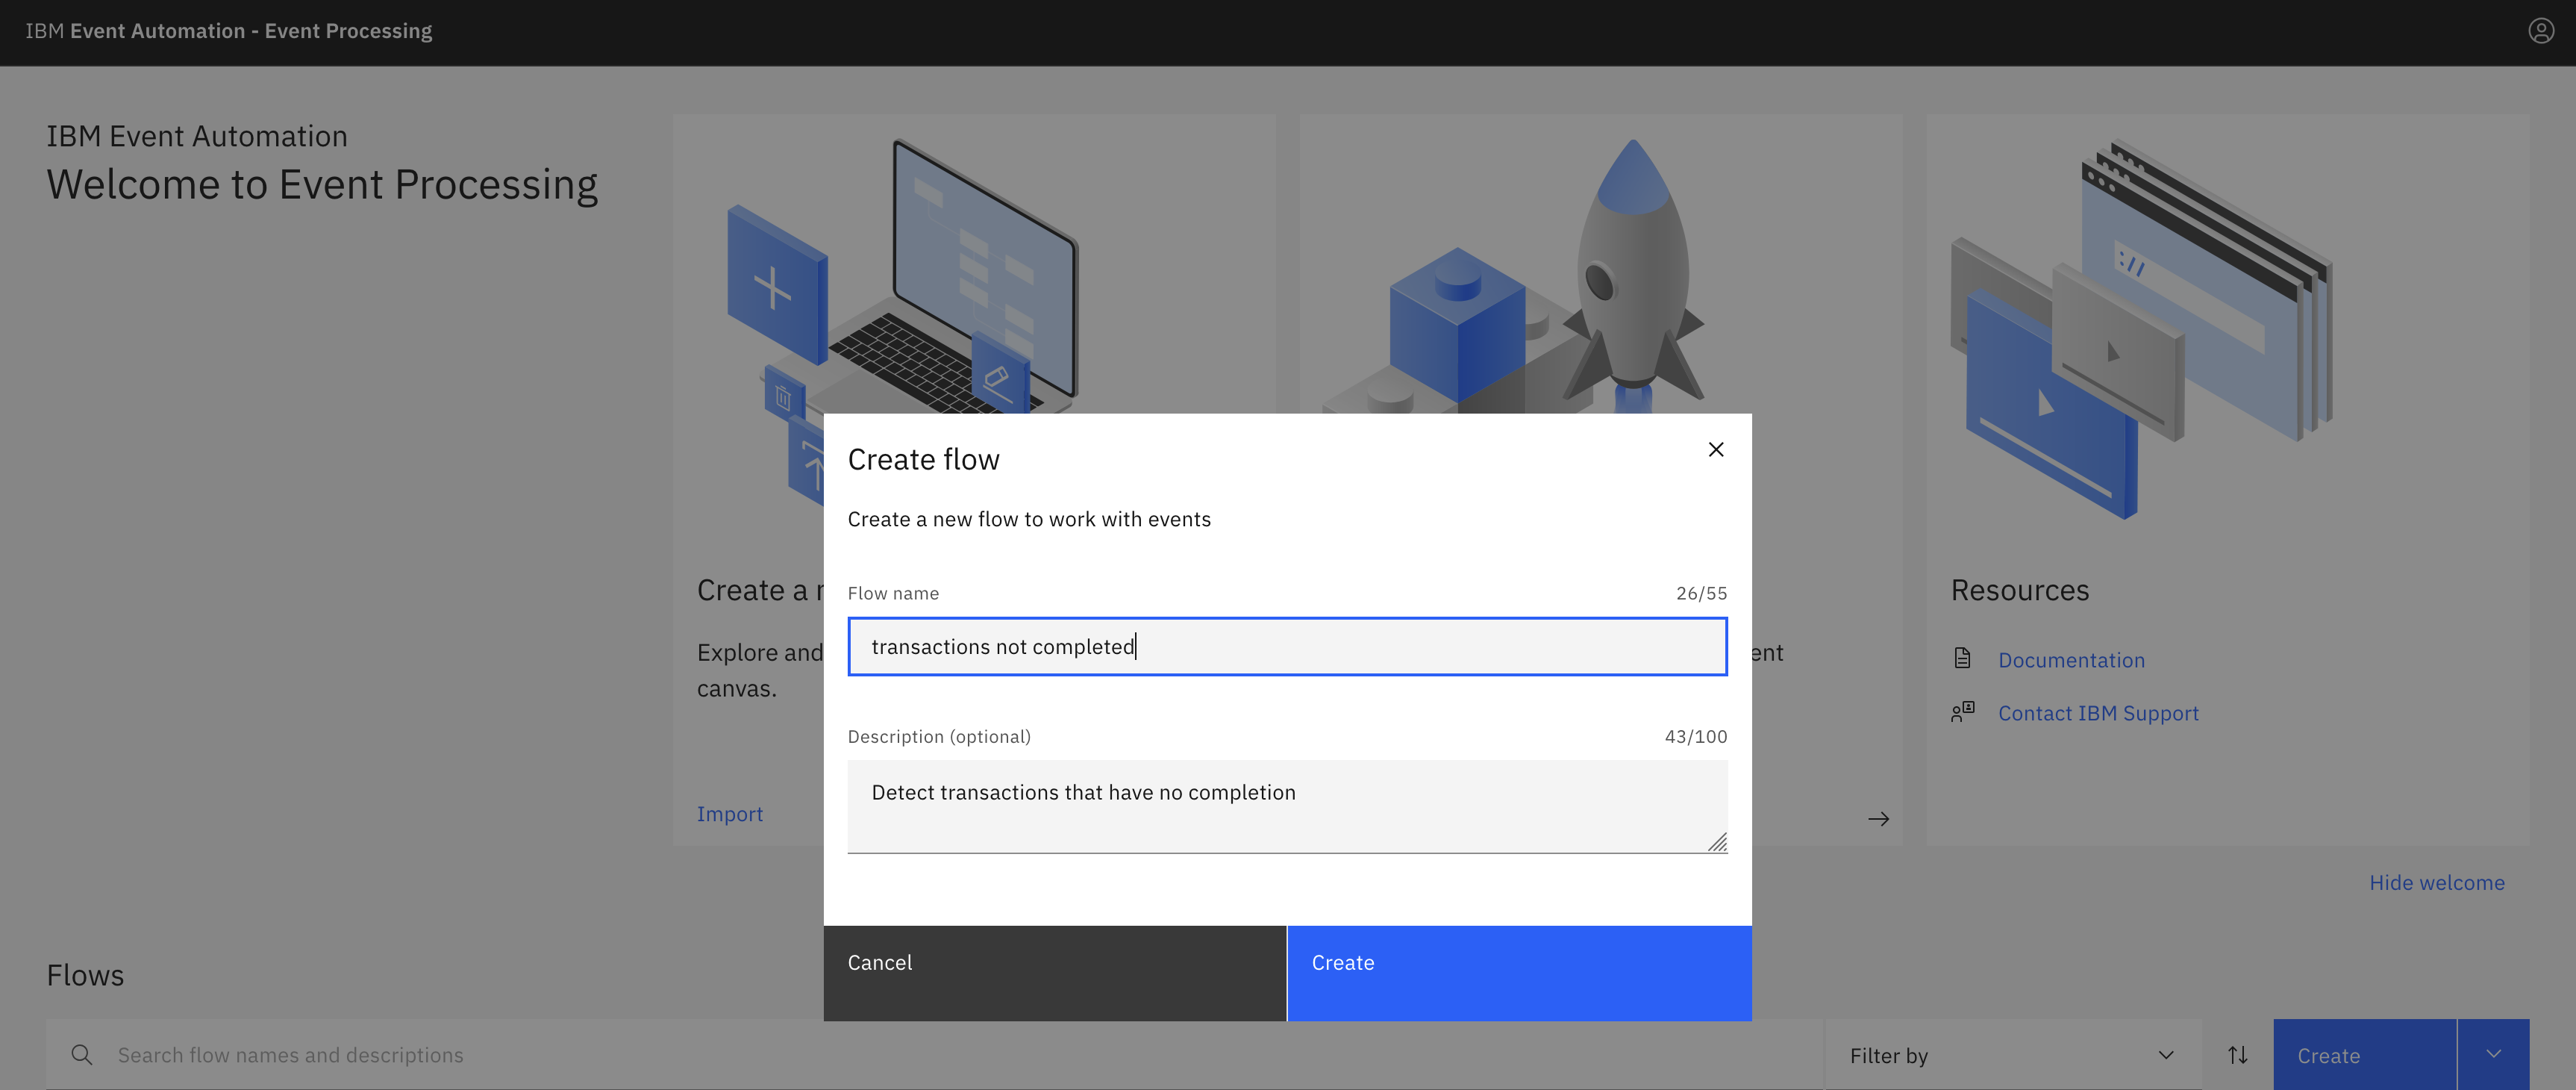
Create a flow, and give it a name and description to explain that you will use it to have more insight into the state of your transactions.
Step 3: Add an event source node for the Transactions topic
The next step is to bring the stream of events you discovered in the catalog into Event Processing.
To create an event source, complete the following steps:
-
Add an Event source node.
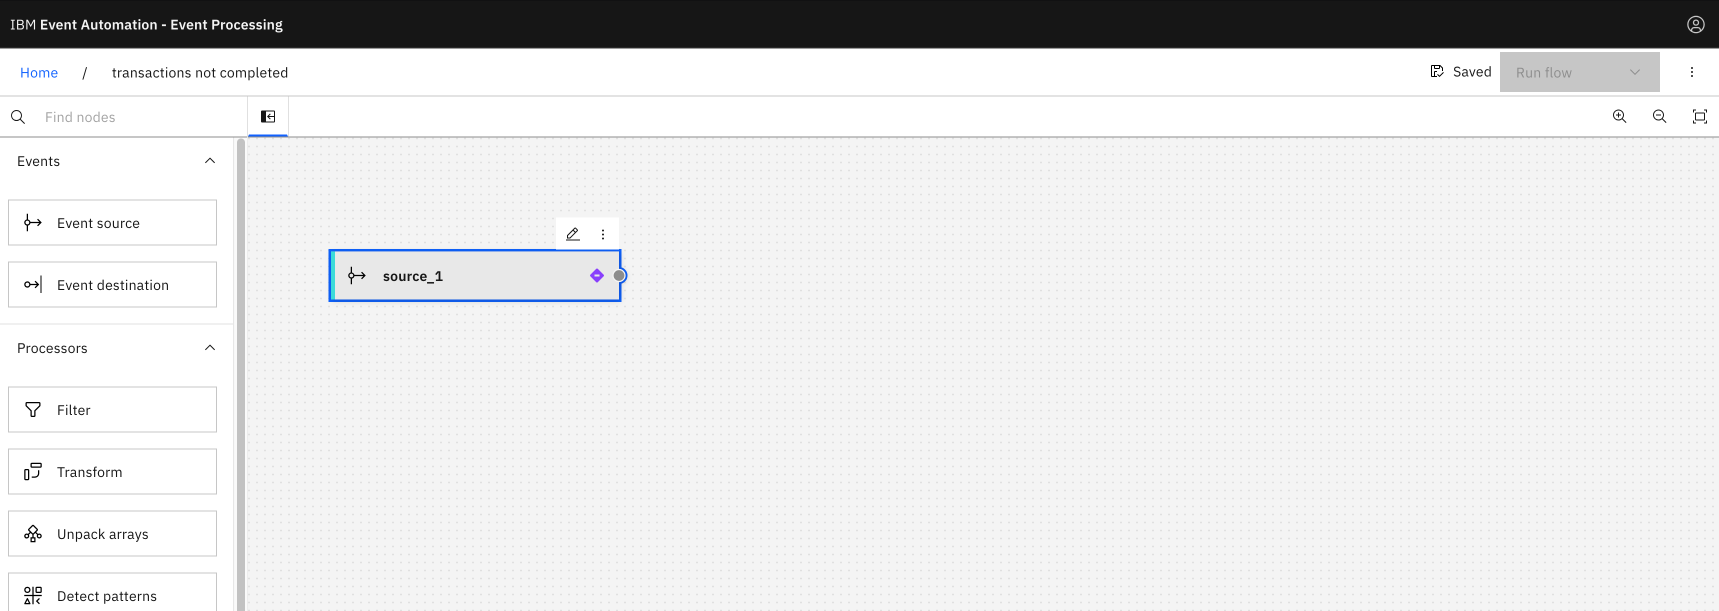
When you create a flow, an event source node is automatically added to your canvas. A purple checkbox
is displayed on the event source node indicating that the node is yet to be configured.
Hover over the node, and click
Edit to configure the node.
-
Ensure that the Add event source tile is selected, and then click Next.
-
Get the server address for the event source from the Event Endpoint Management topic page.
Click the Copy icon next to the Servers address to copy the address to the clipboard.
-
Go to Event Processing, and configure the new event source.
In the Server field, paste the server address that you copied from Event Endpoint Management in the previous step.
Click Next.
-
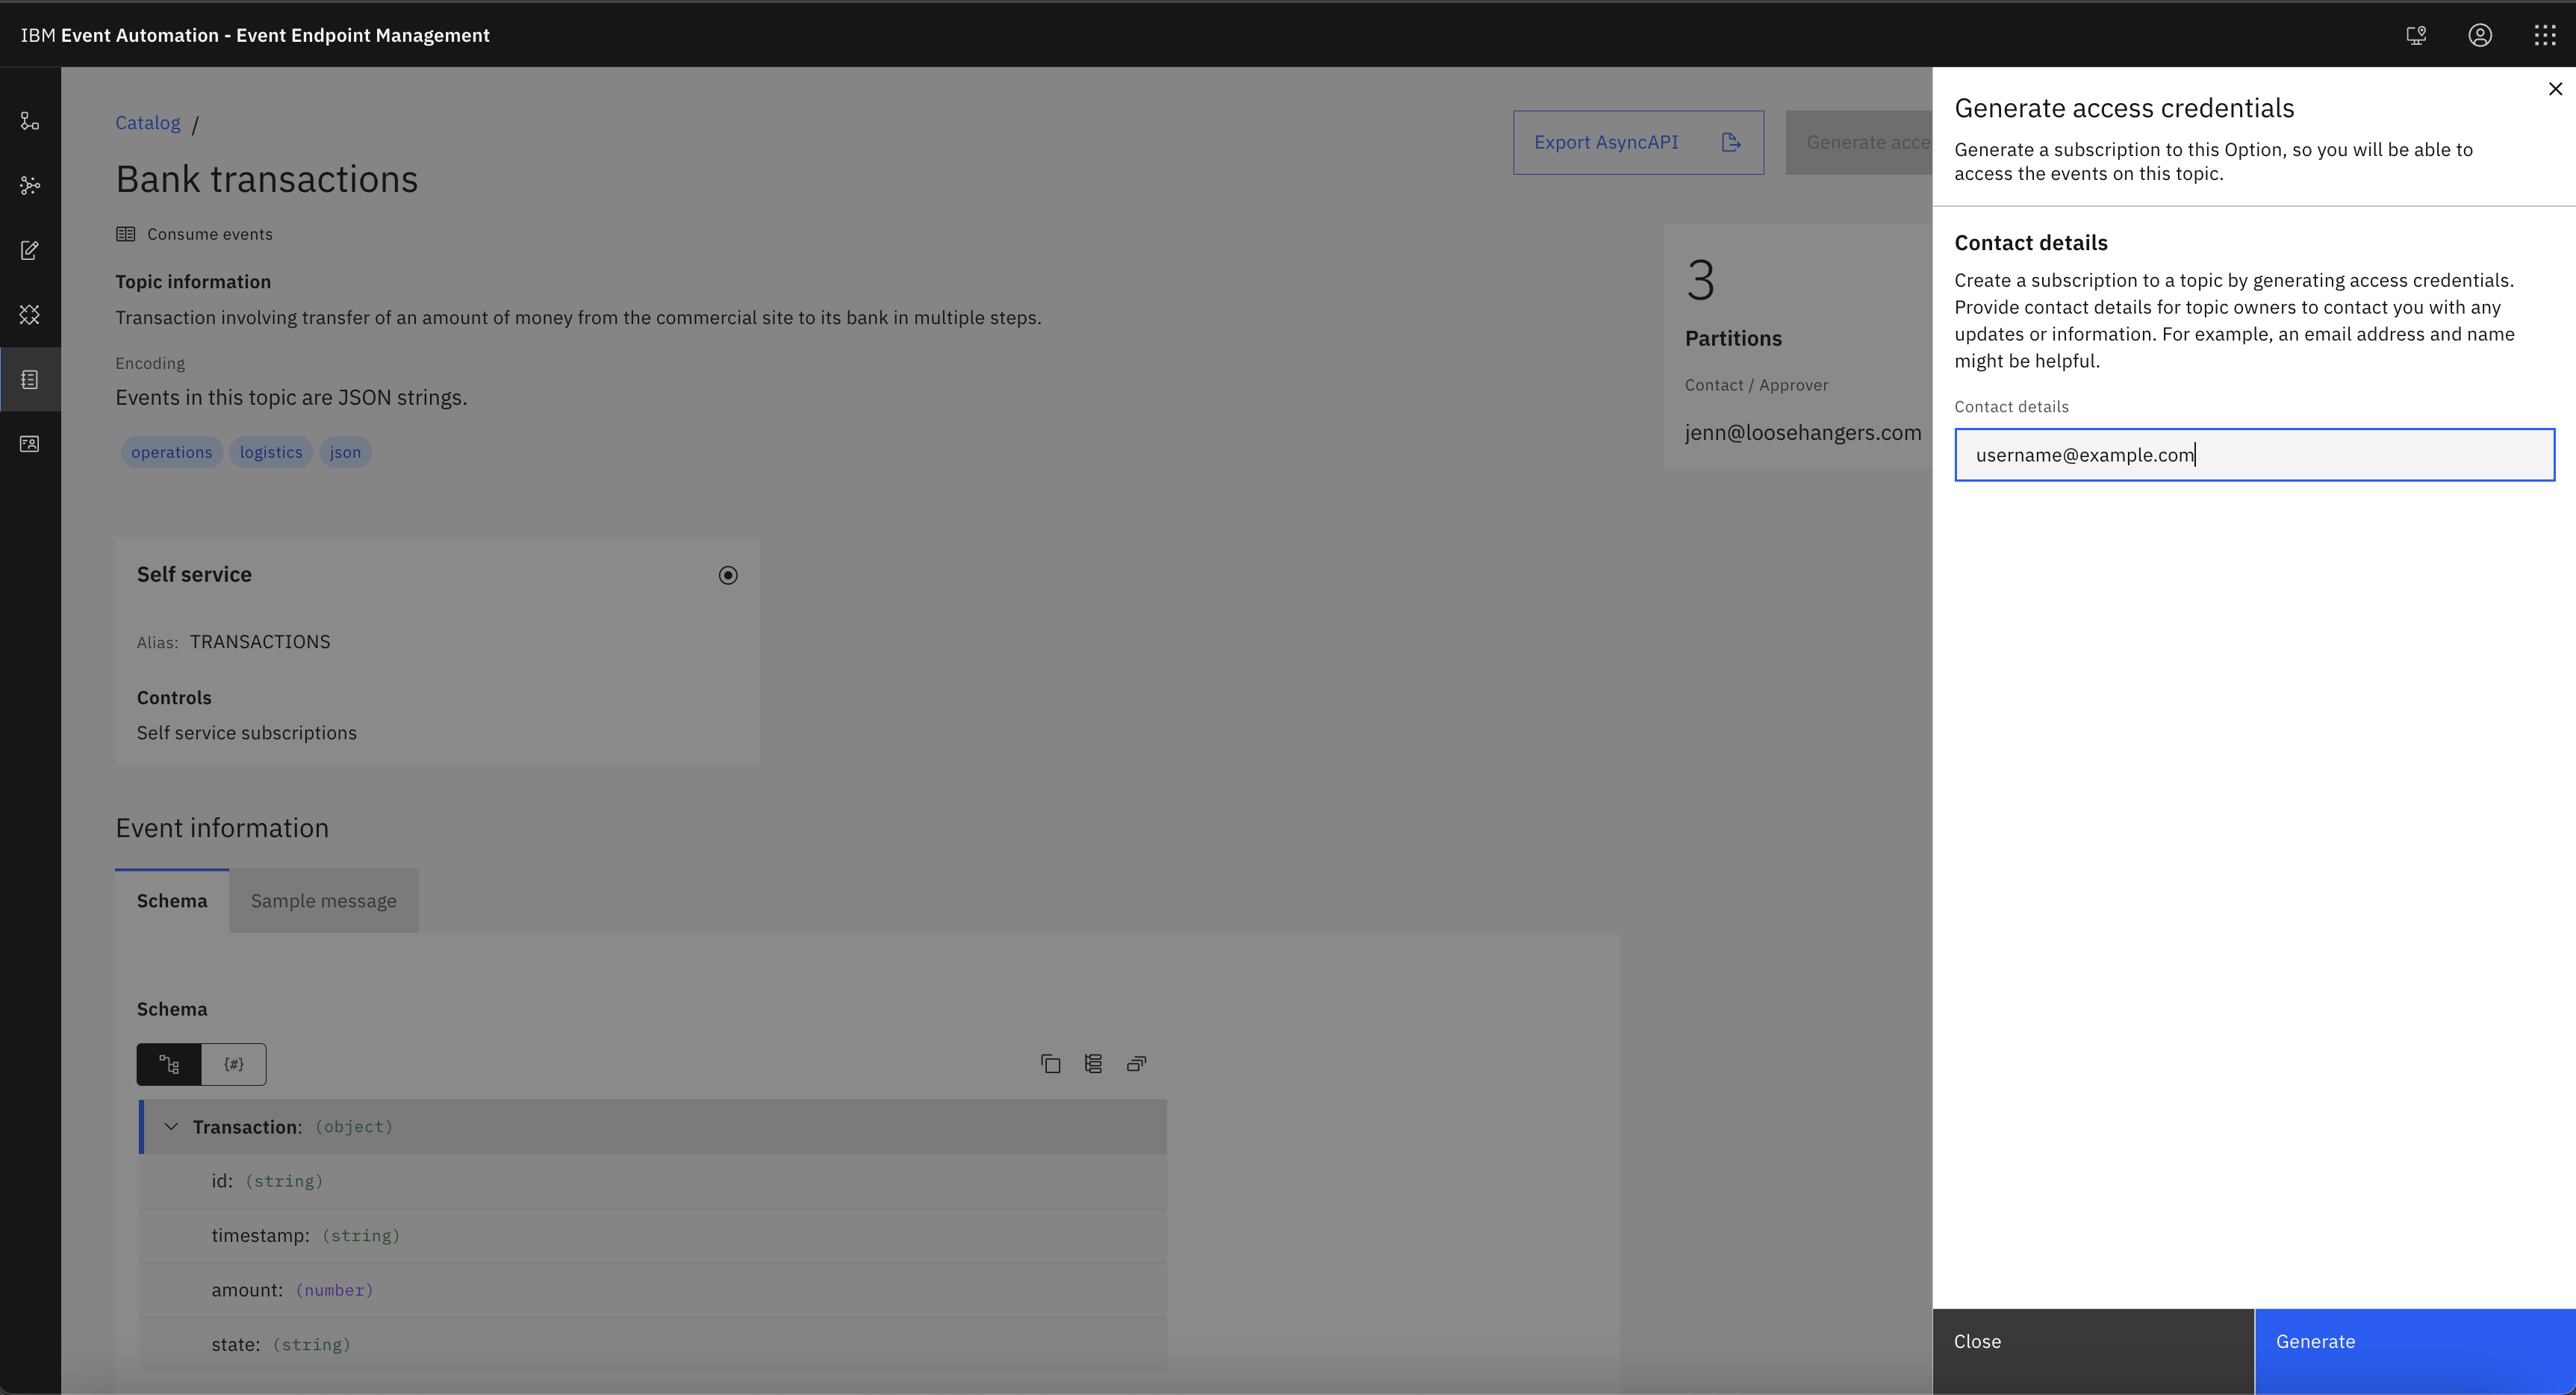
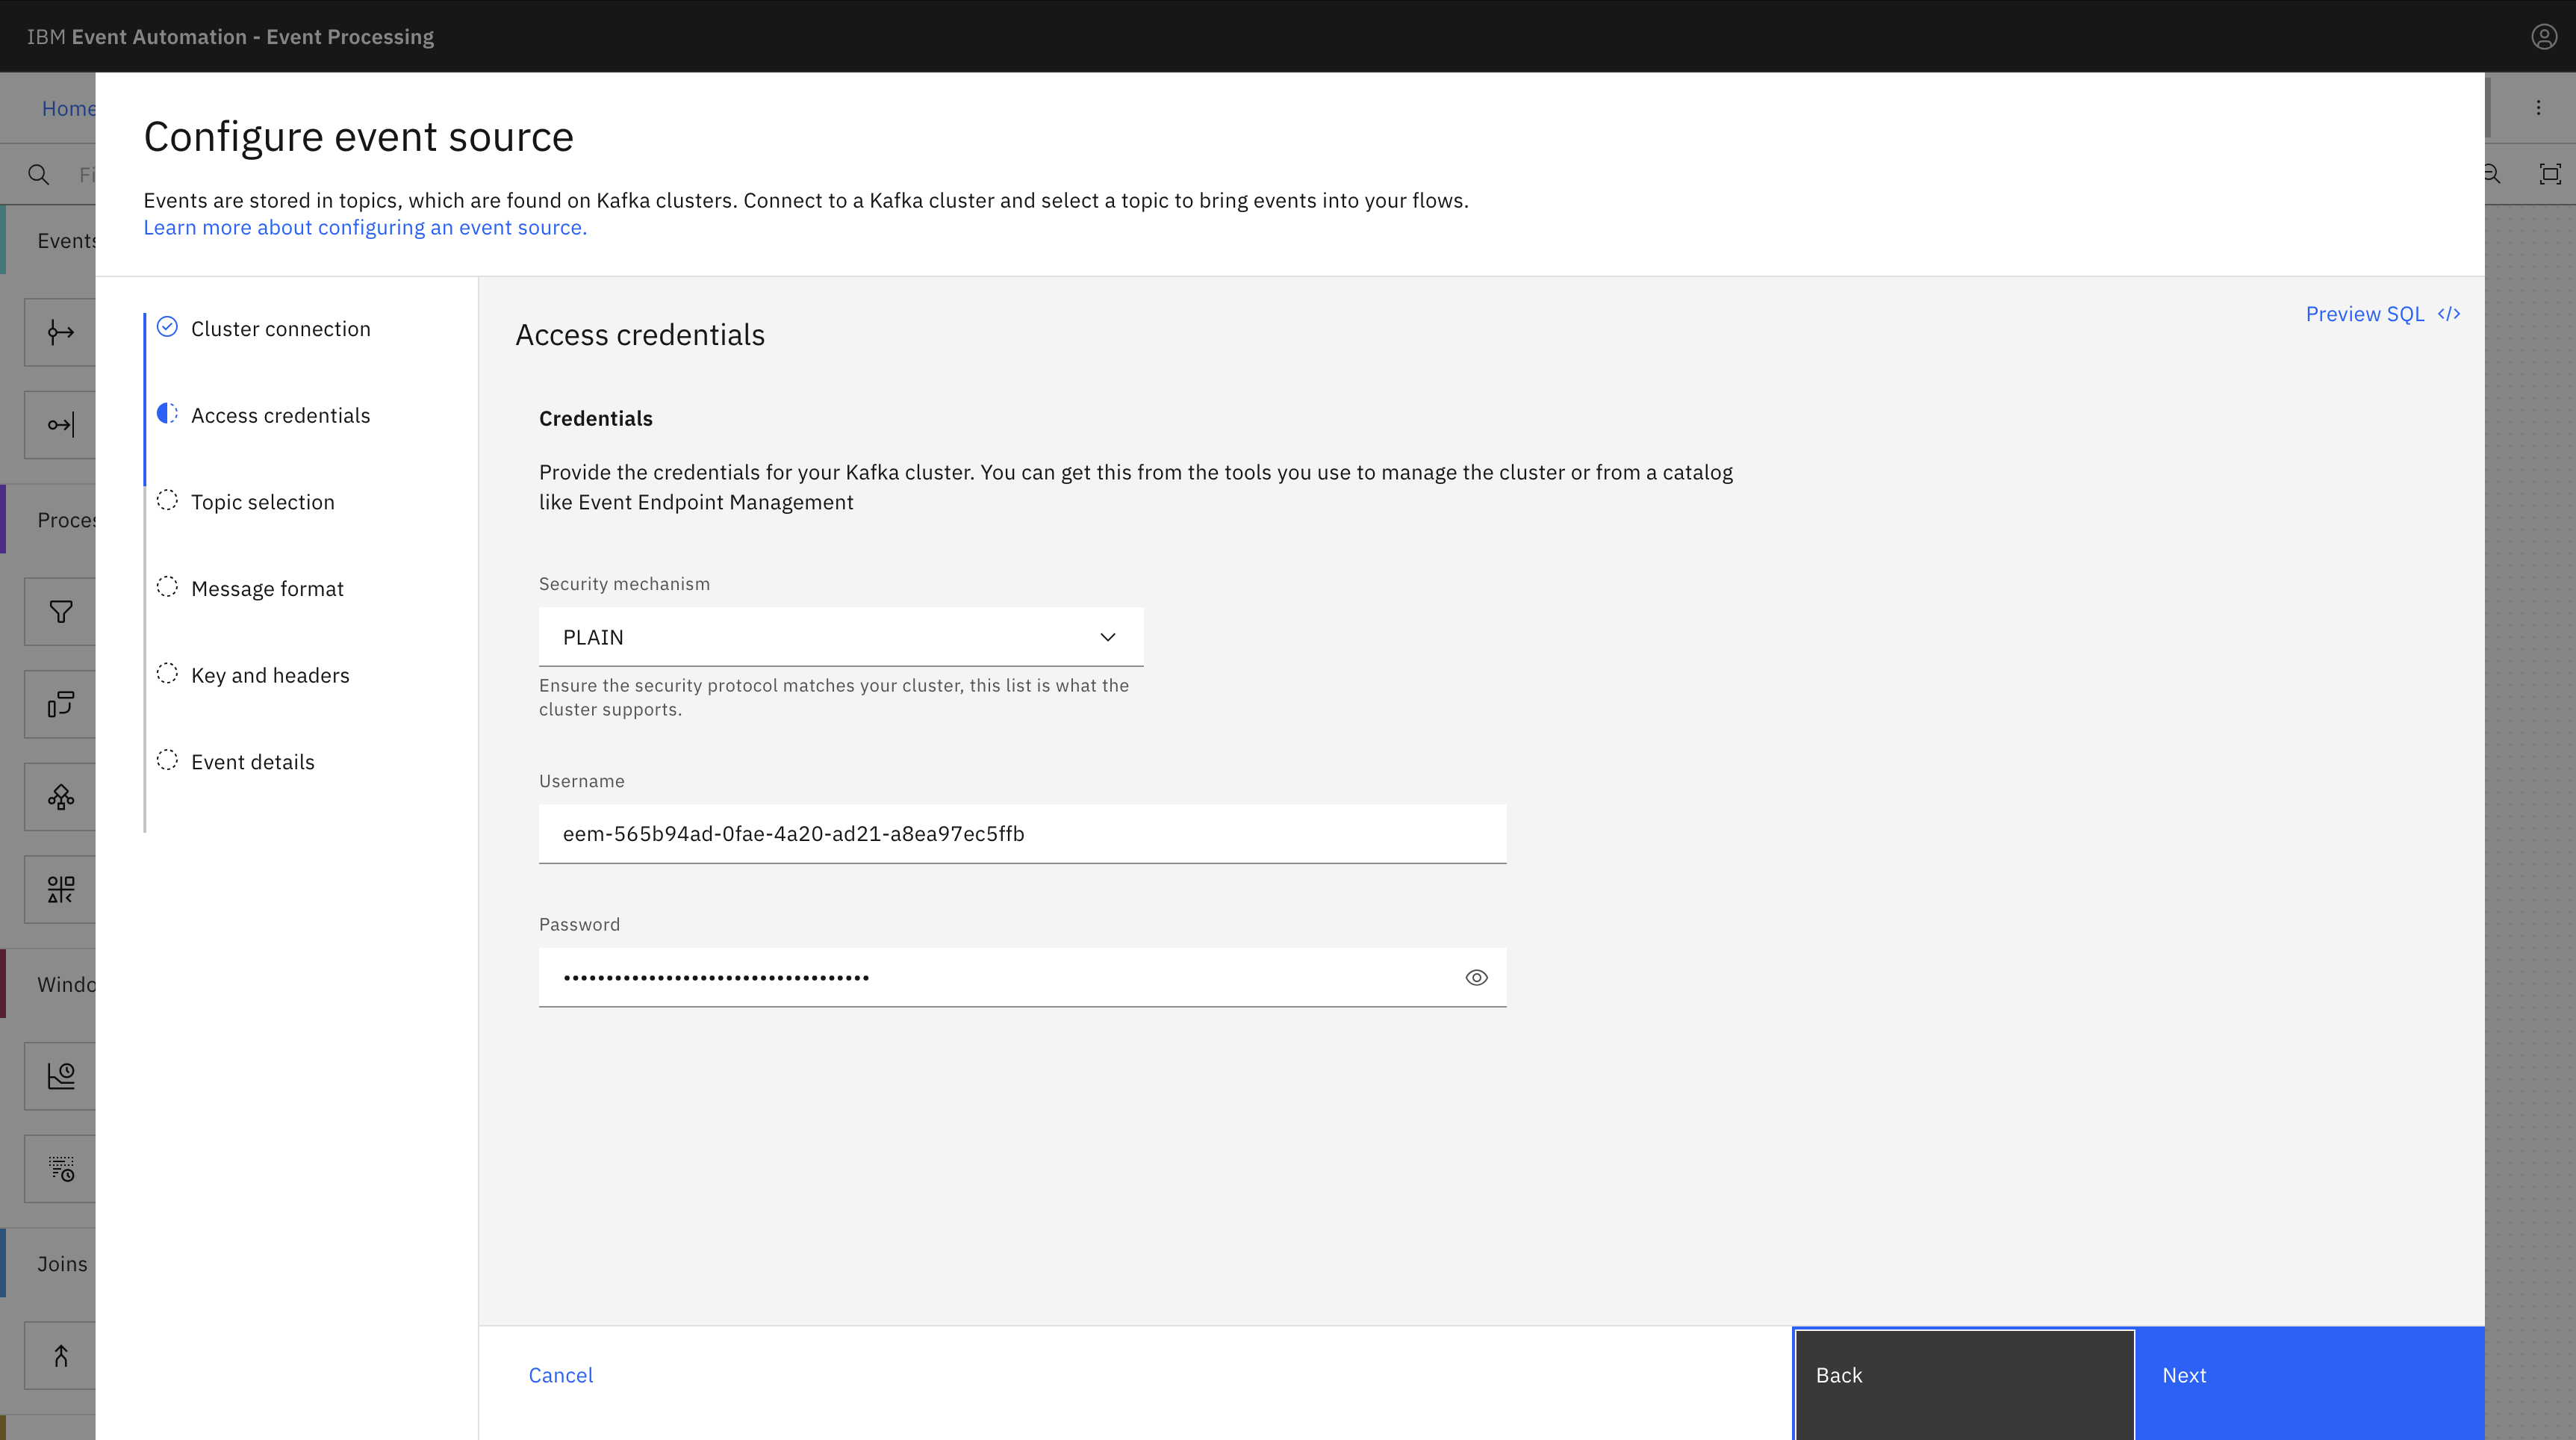
Generate access credentials for accessing this stream of events from the Event Endpoint Management page.
Click Generate access credentials at the top of the page, and provide your contact details.
-
Copy the username and password from Event Endpoint Management and paste into Event Processing to access the topic.
The username starts with
eem-.Click Next to go to the Topic selection pane.
-
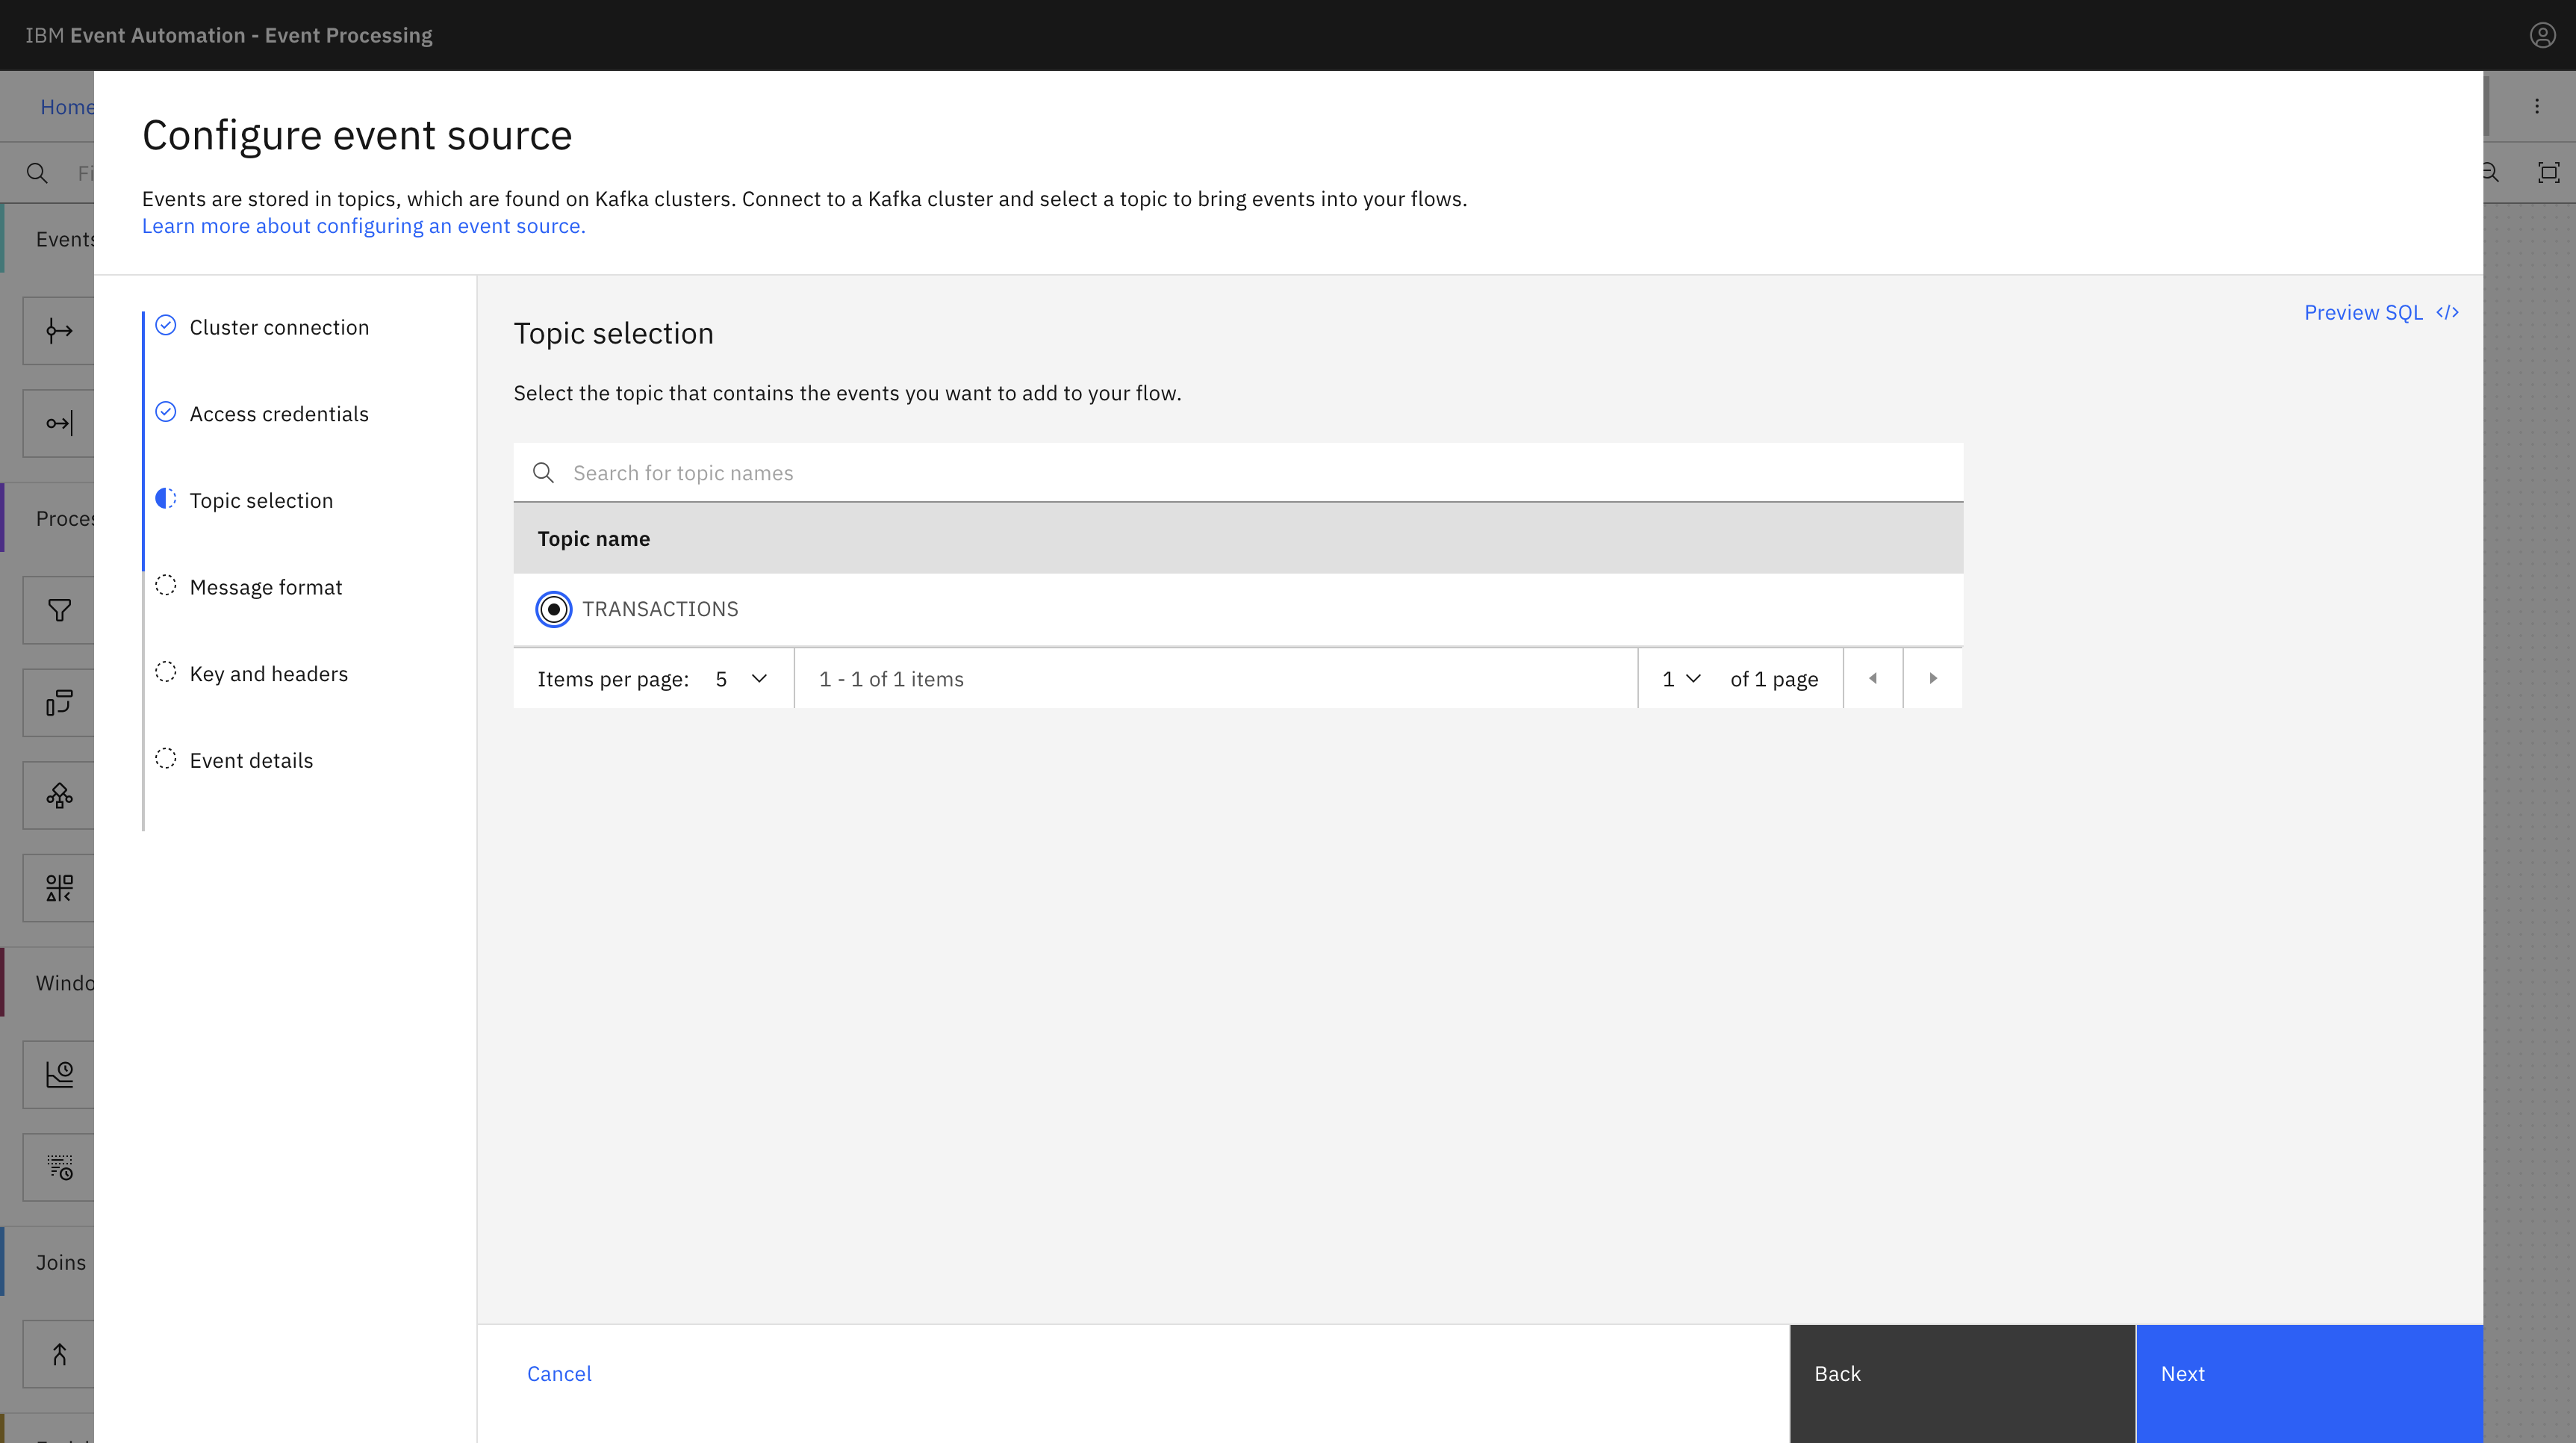
Select the
TRANSACTIONStopic to process events from, and click Next. -
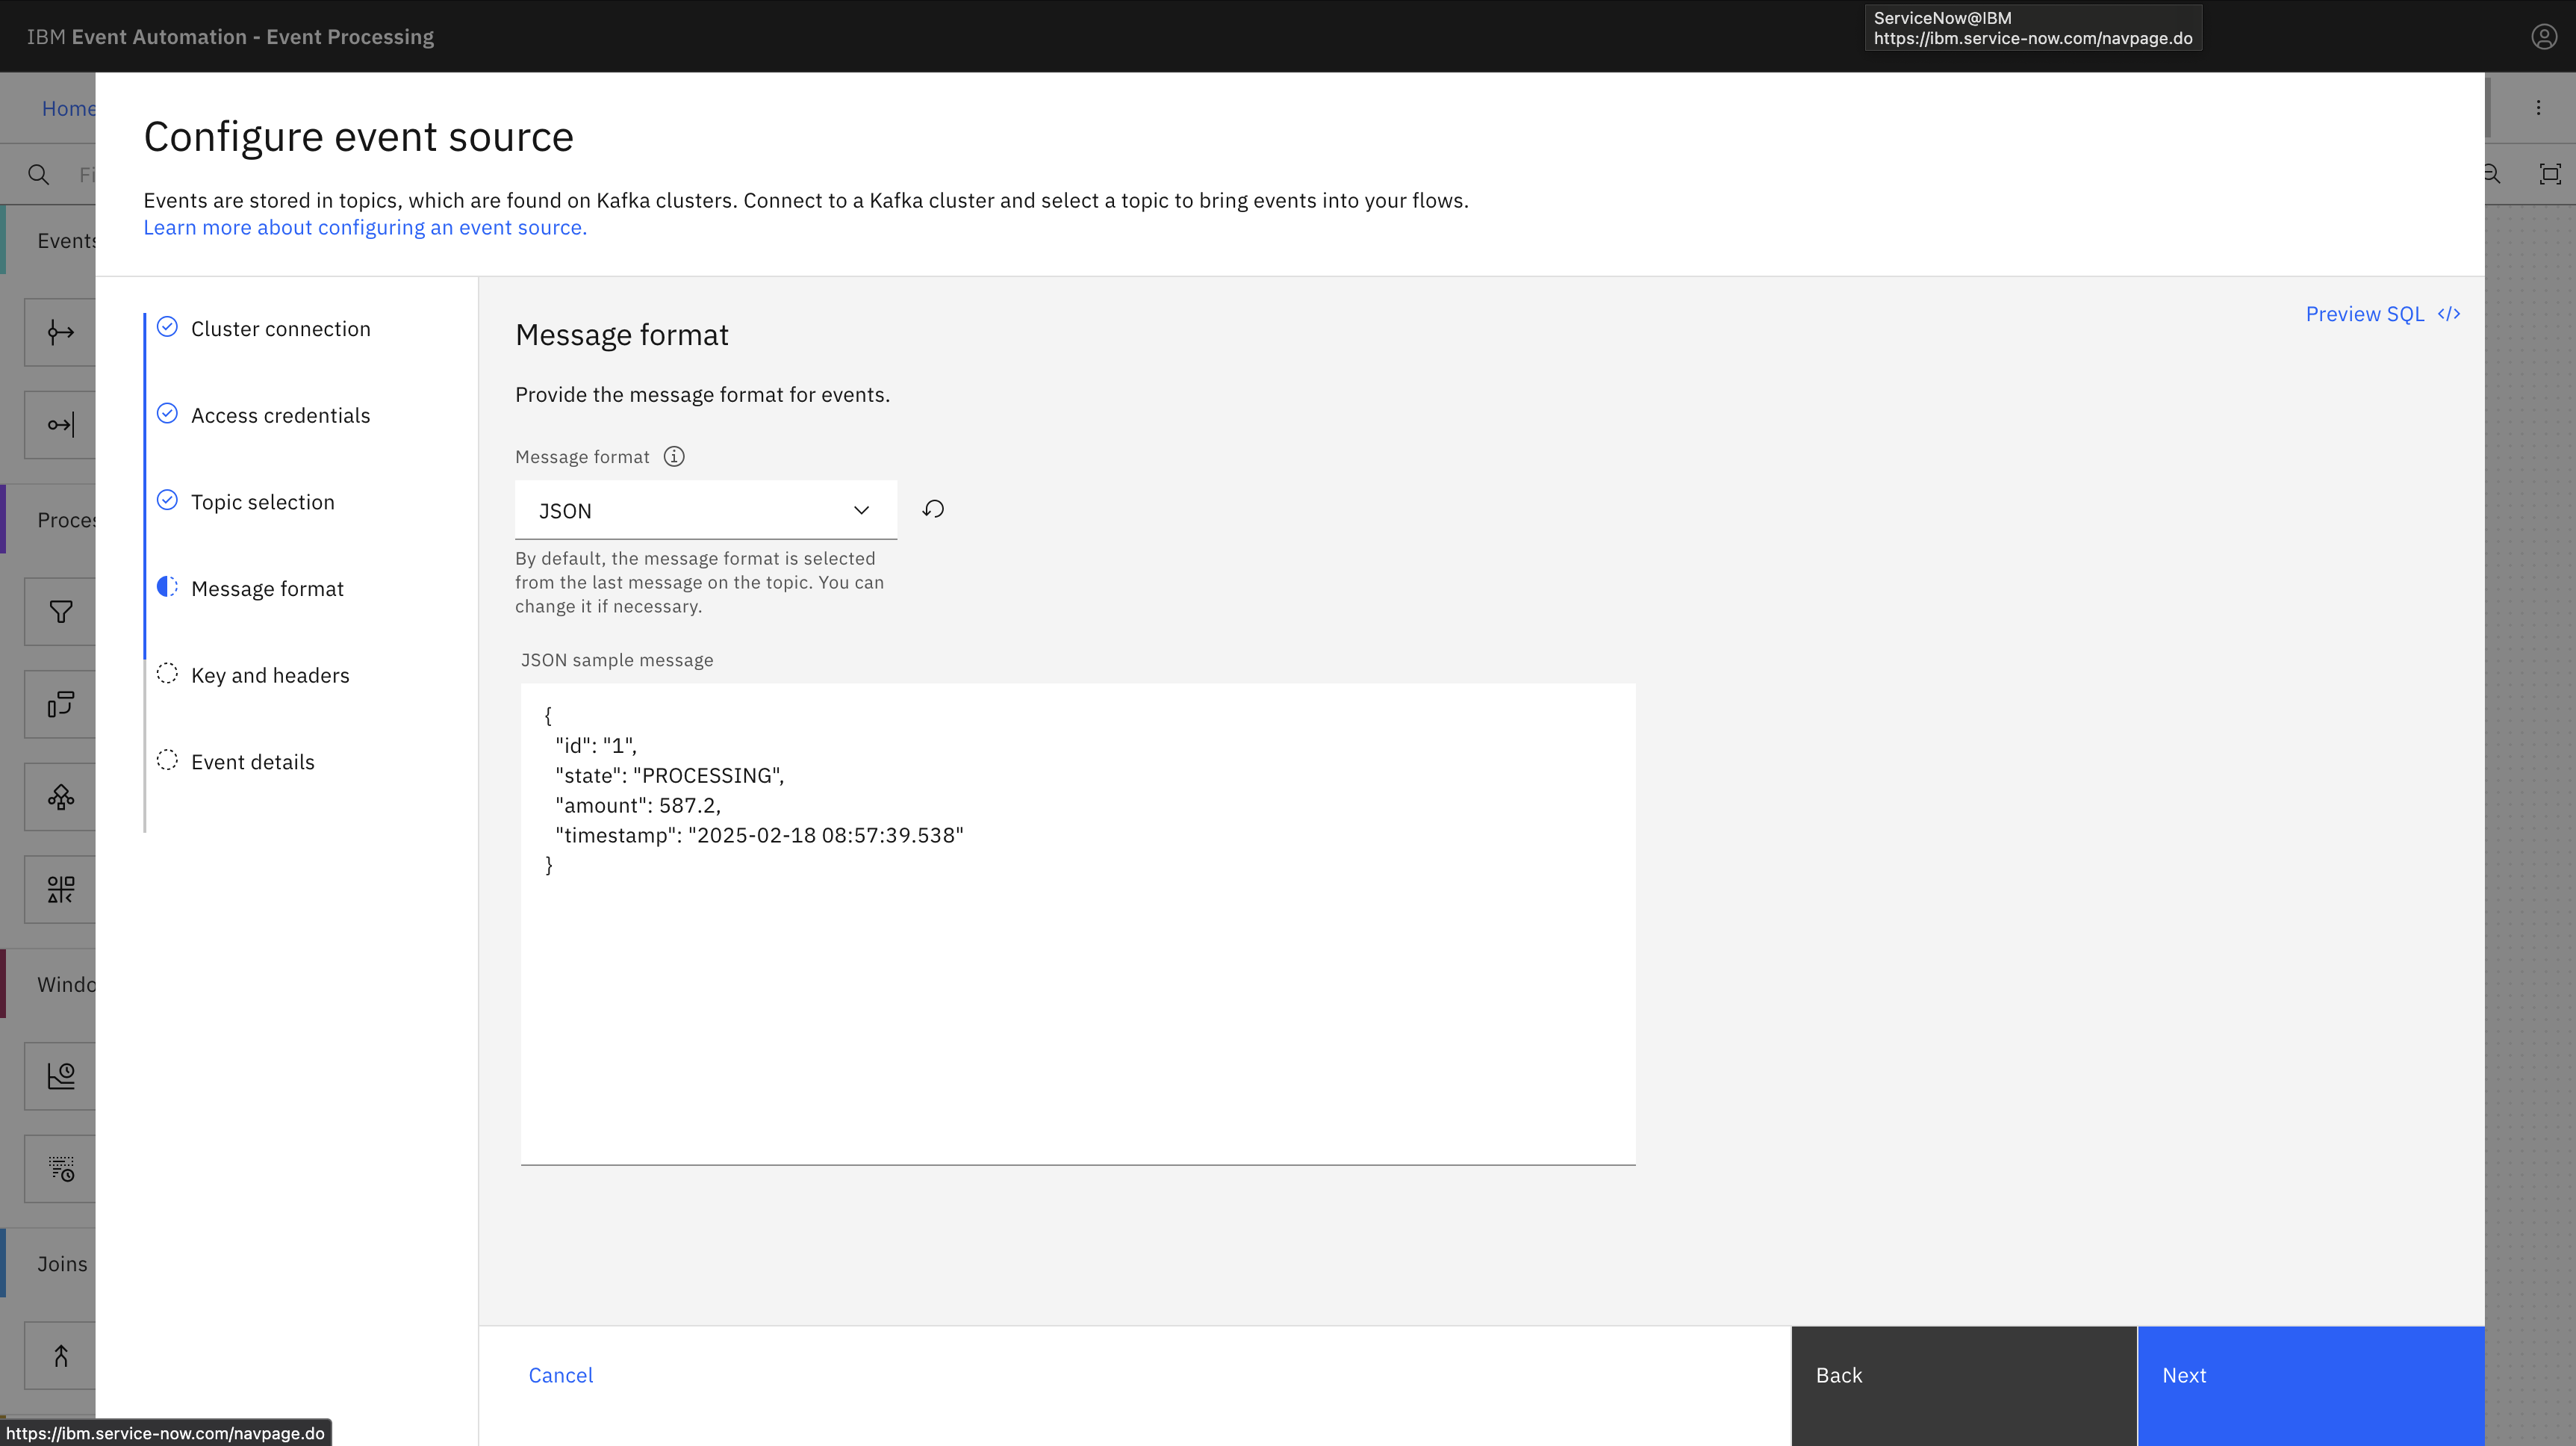
The
JSONmessage format is auto-selected in the Message format drop-down. Click Next. -
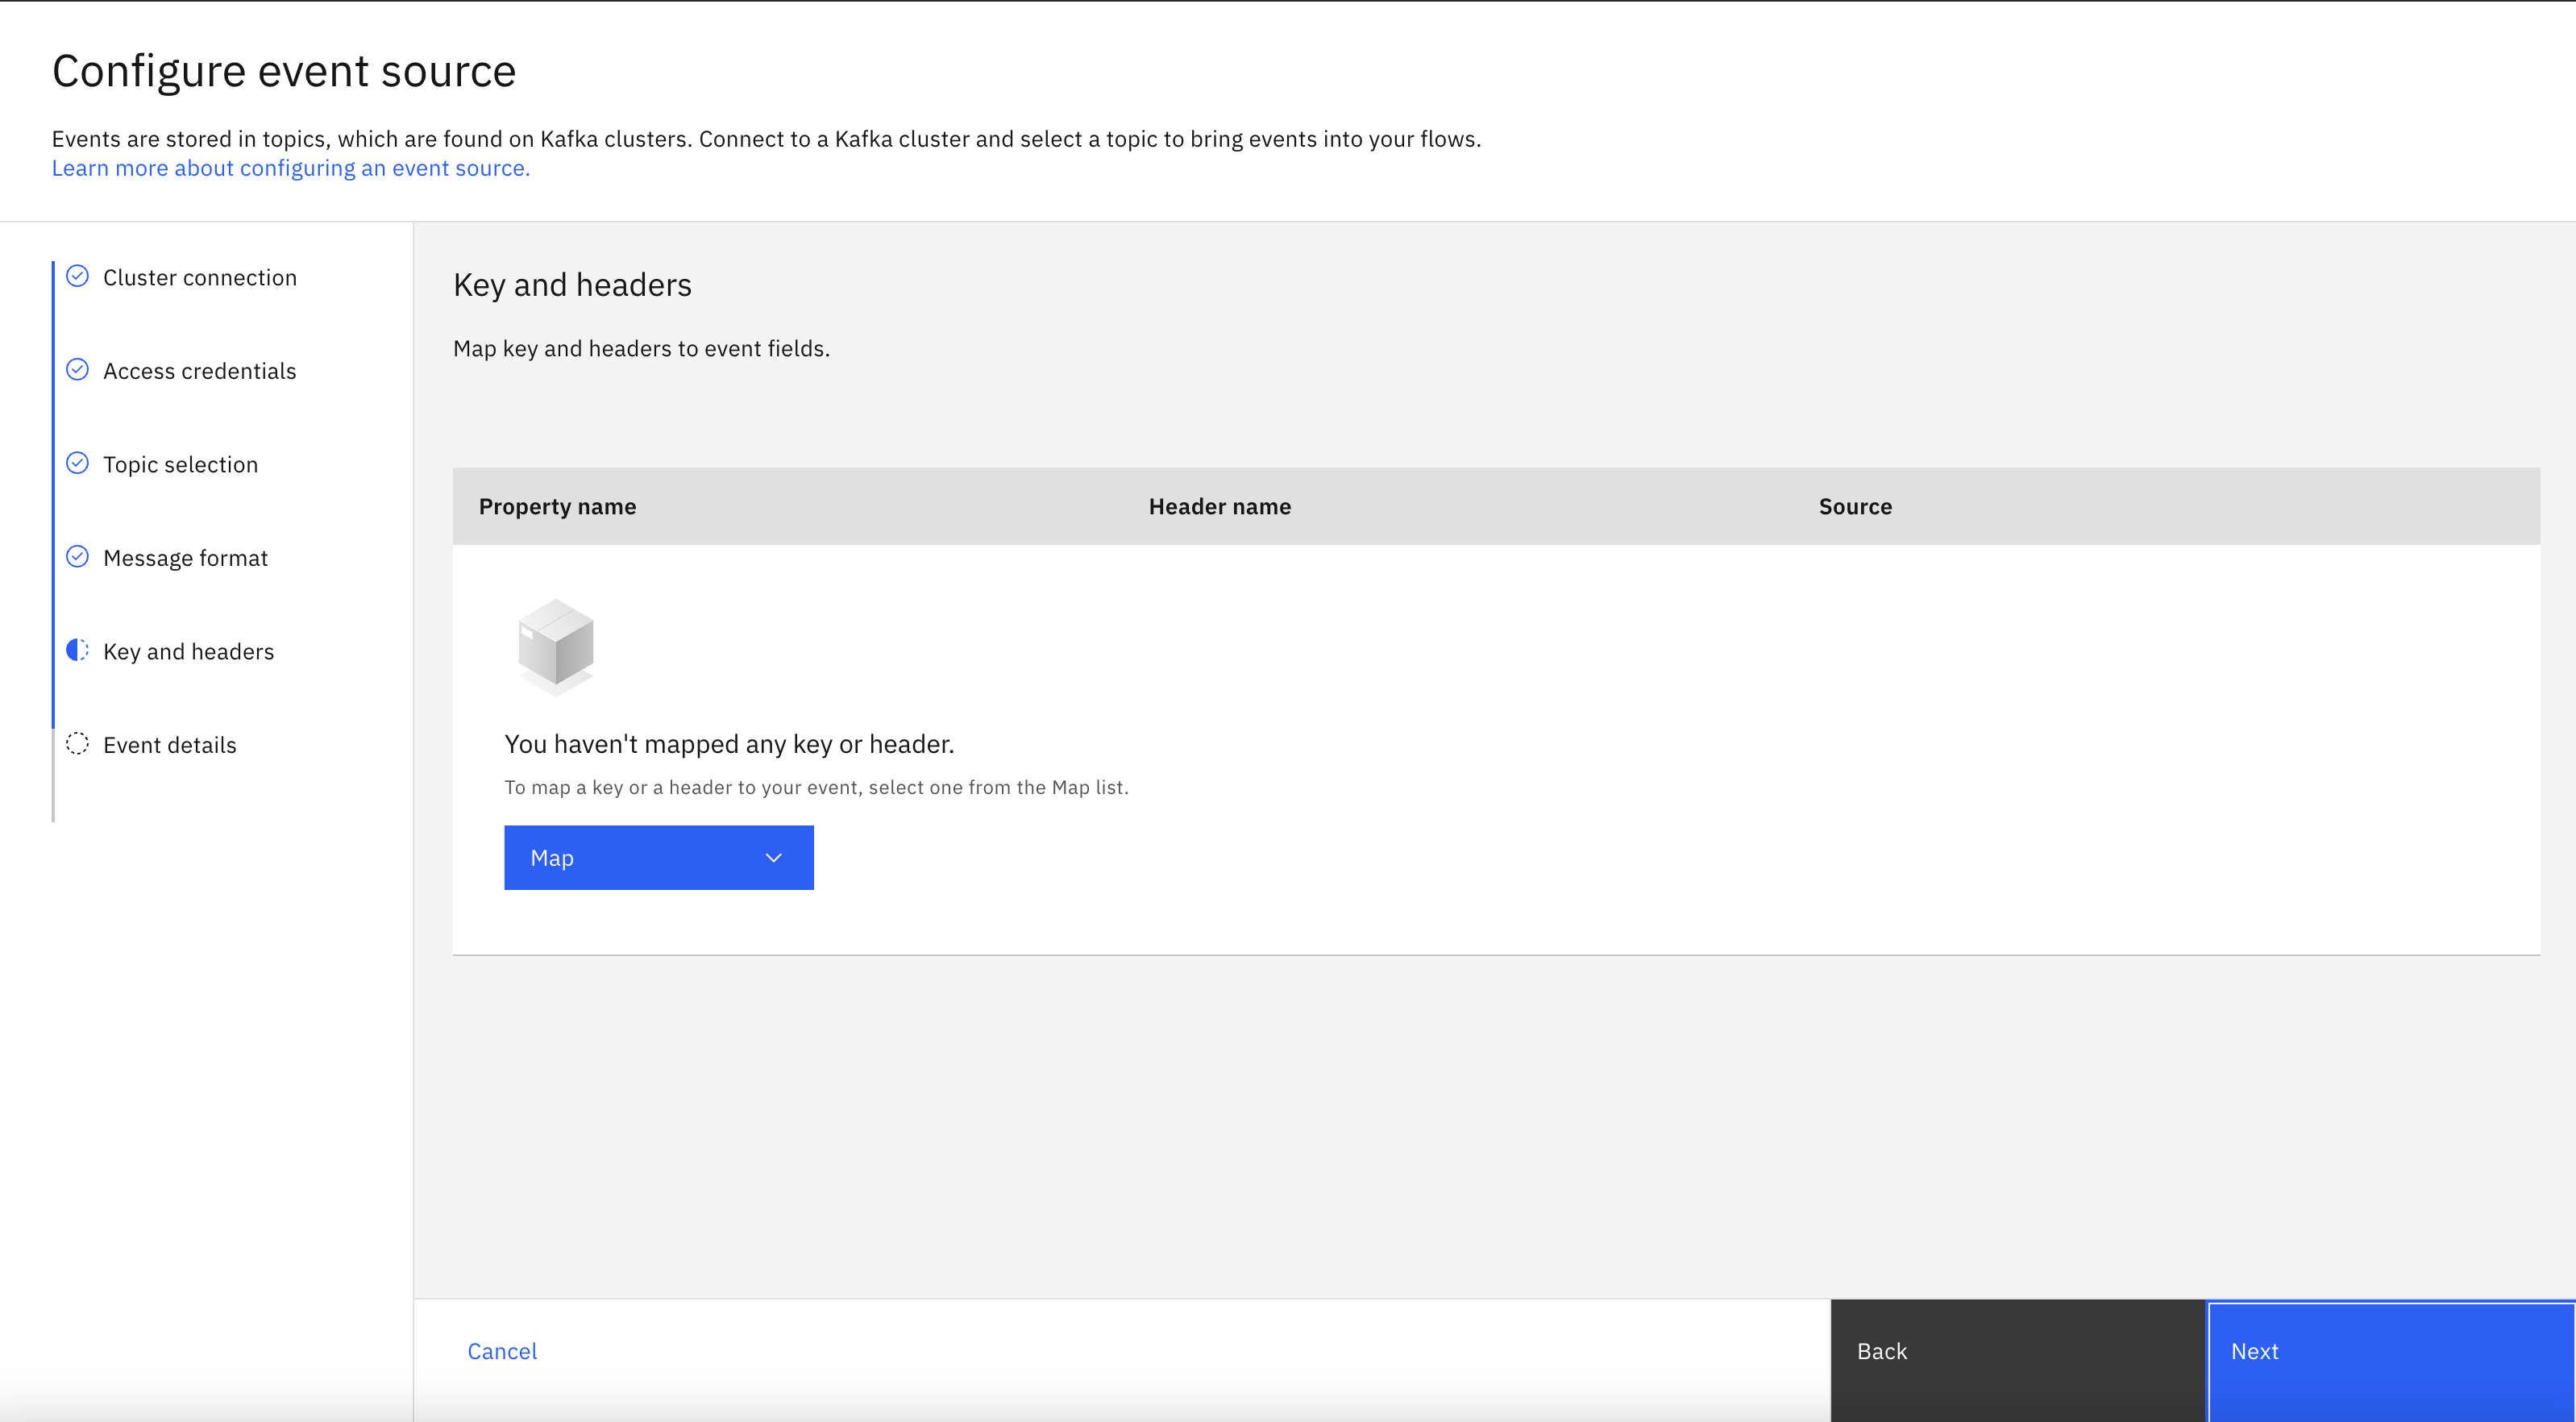
In the Key and headers pane, click Next.
Note: The key and headers are displayed automatically if they are available in the selected topic message.
-
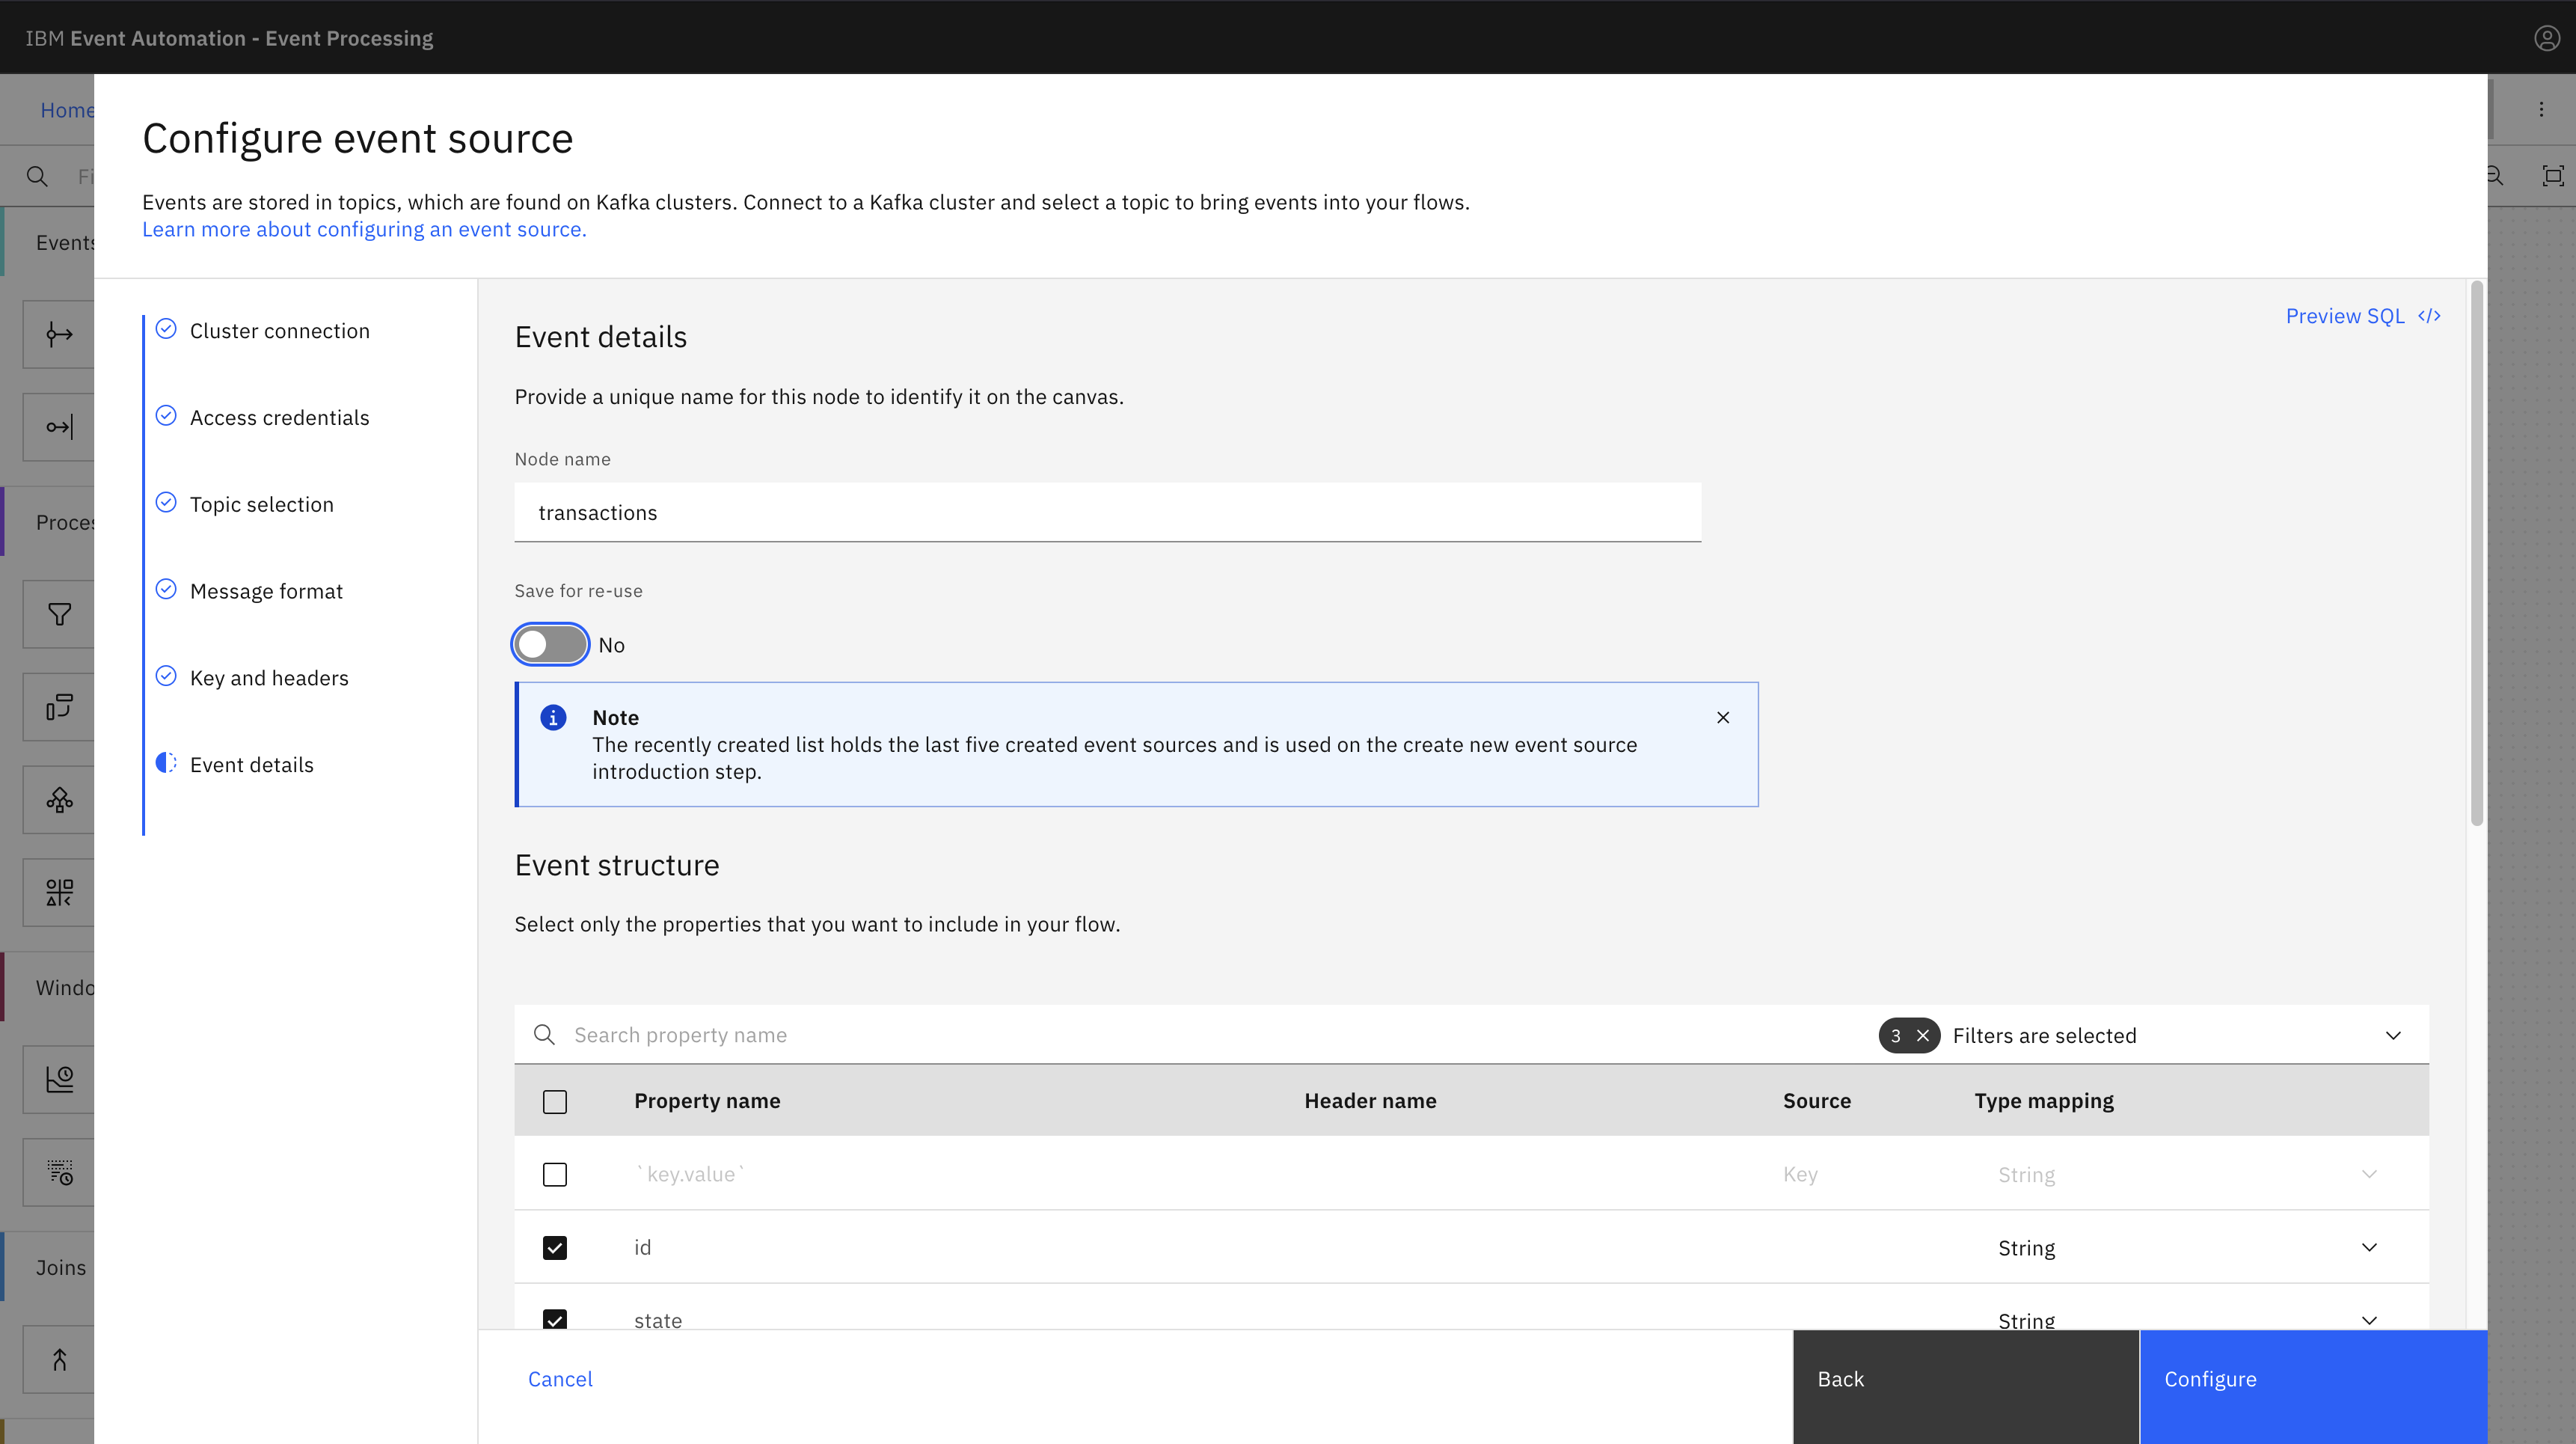
In the Event details pane, enter the node a name that describes this stream of events:
transactions -
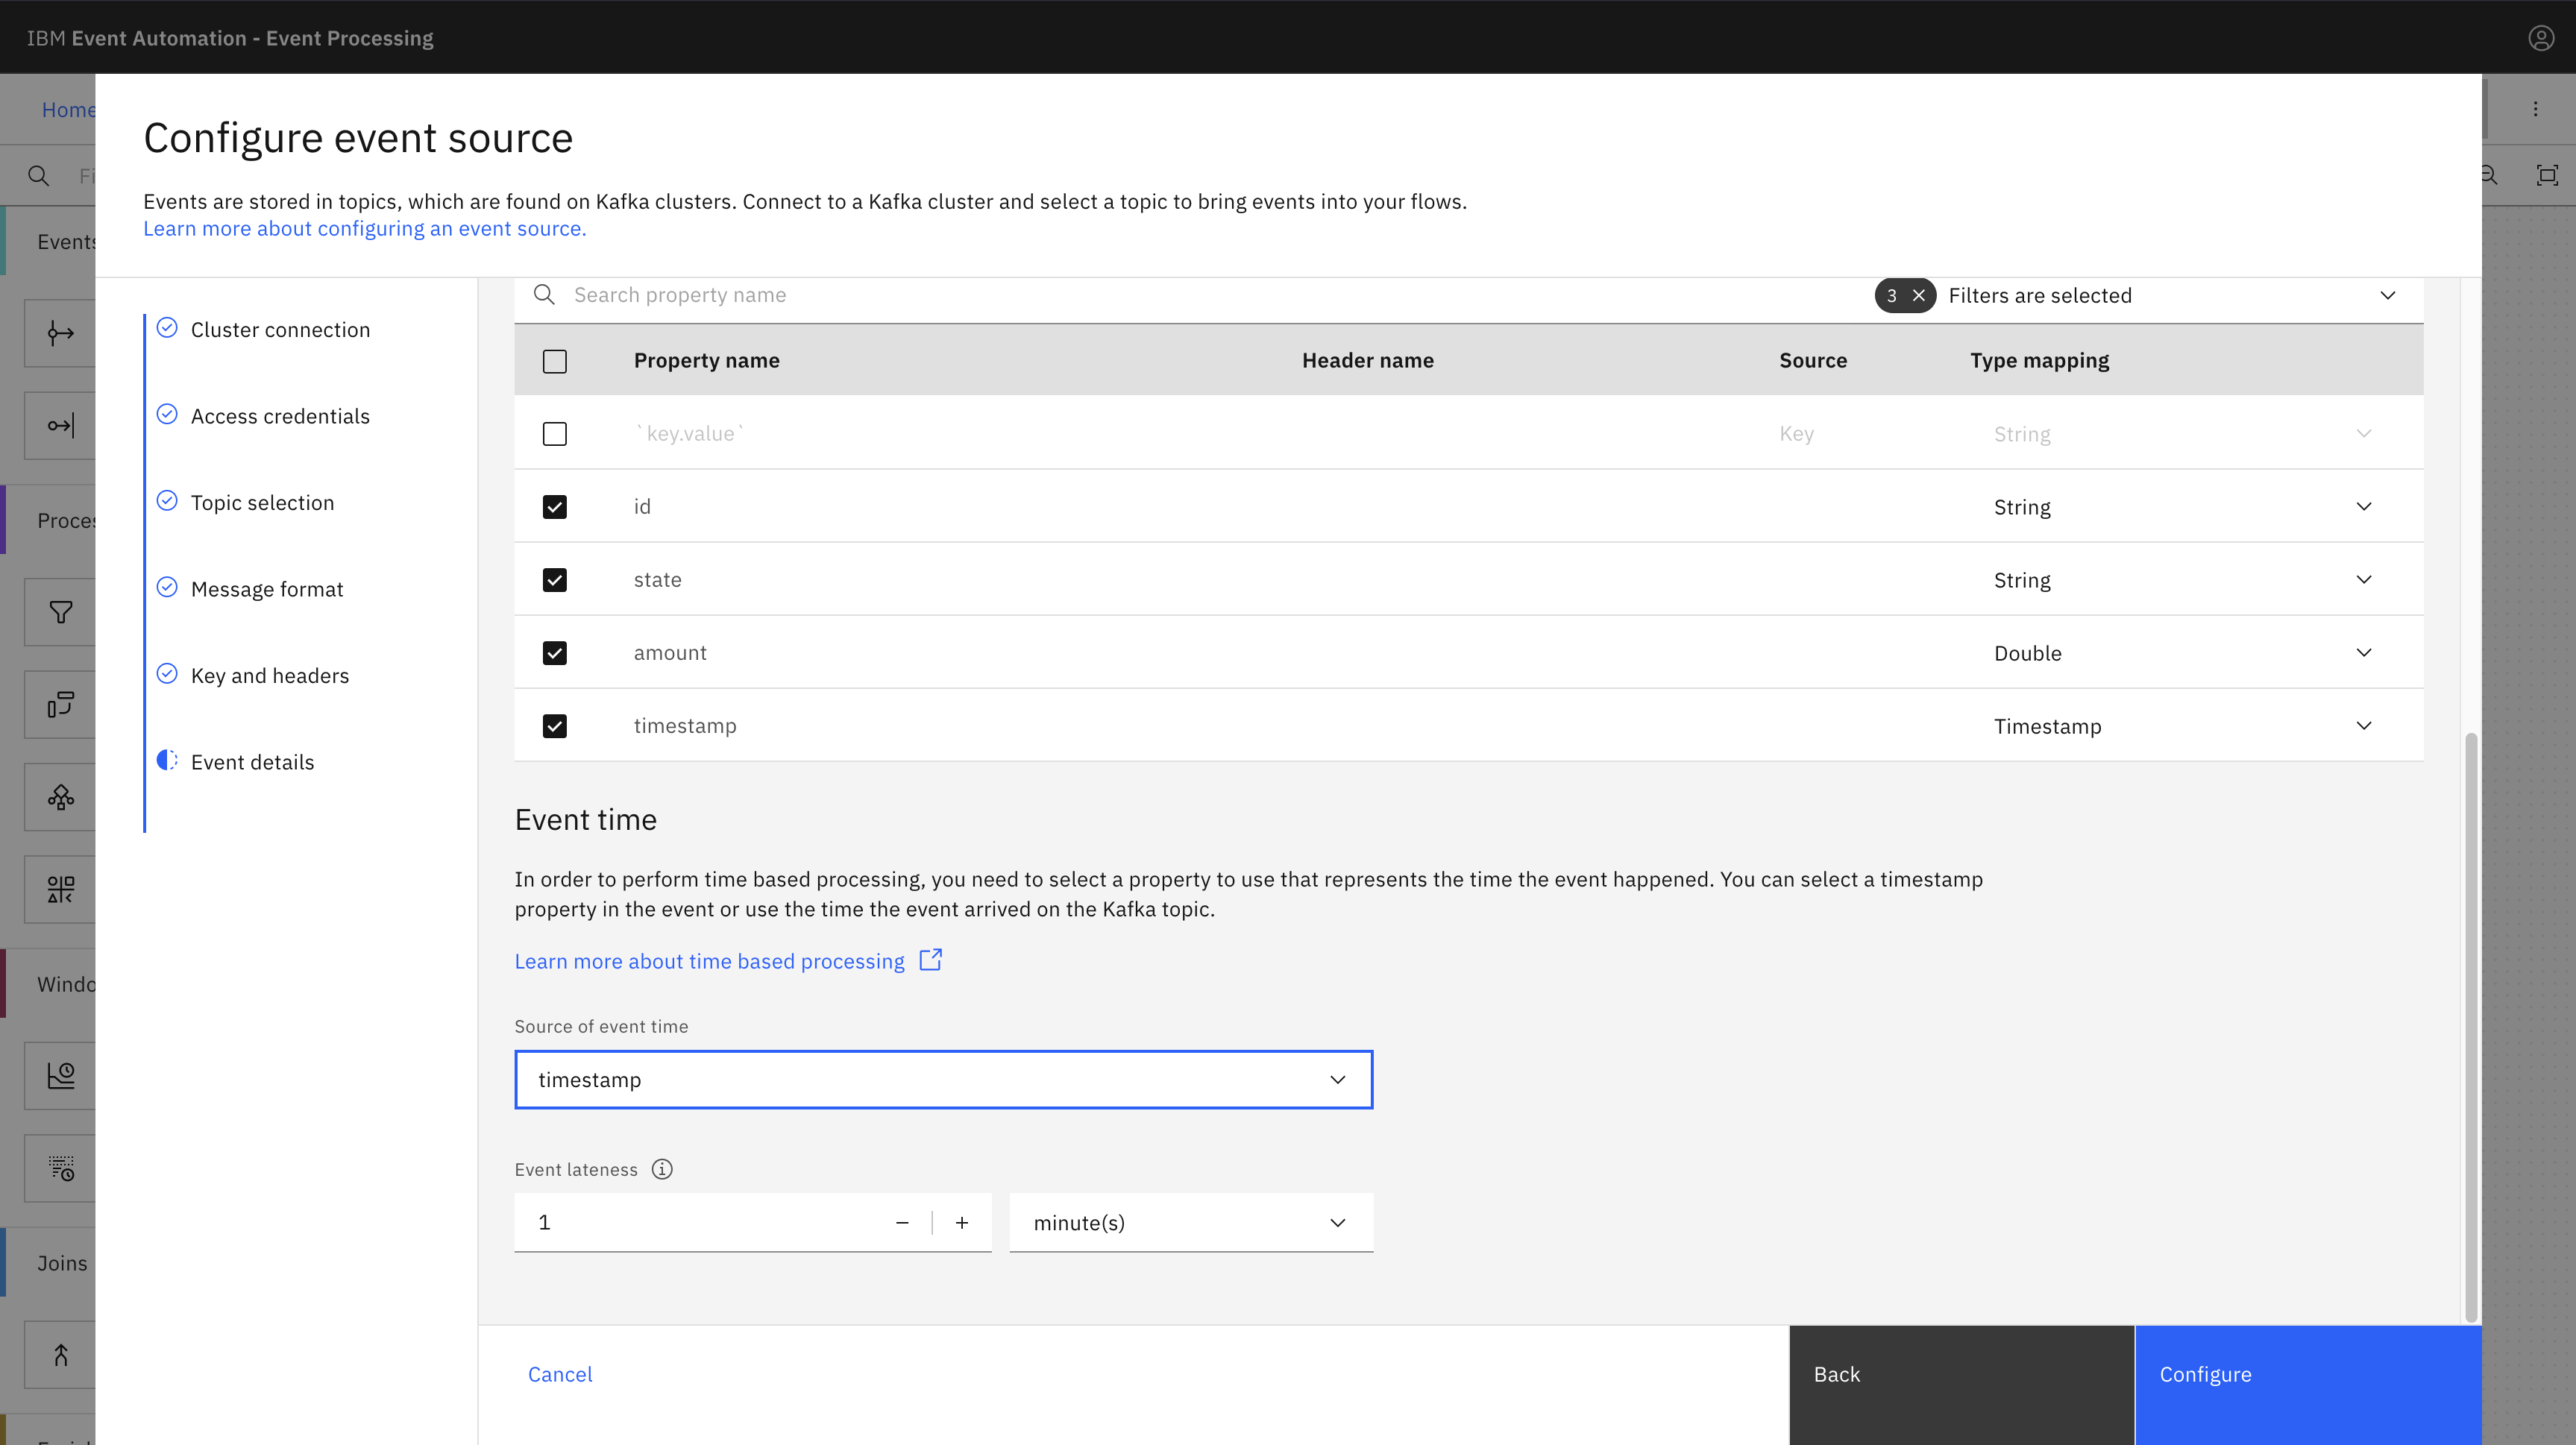
Configure the event source to use the
timestampproperty as the source of the event time, and to tolerate lateness of up to 1 minute. -
Click Configure to finalize the event source configuration.
Step 4: Filter transaction states into separate events
Currently, all transaction states are consolidated into a single transactions event. You must filter them into distinct events for each of the STARTED, PROCESSING, and COMPLETED states. You can use the filter node to achieve this.
-
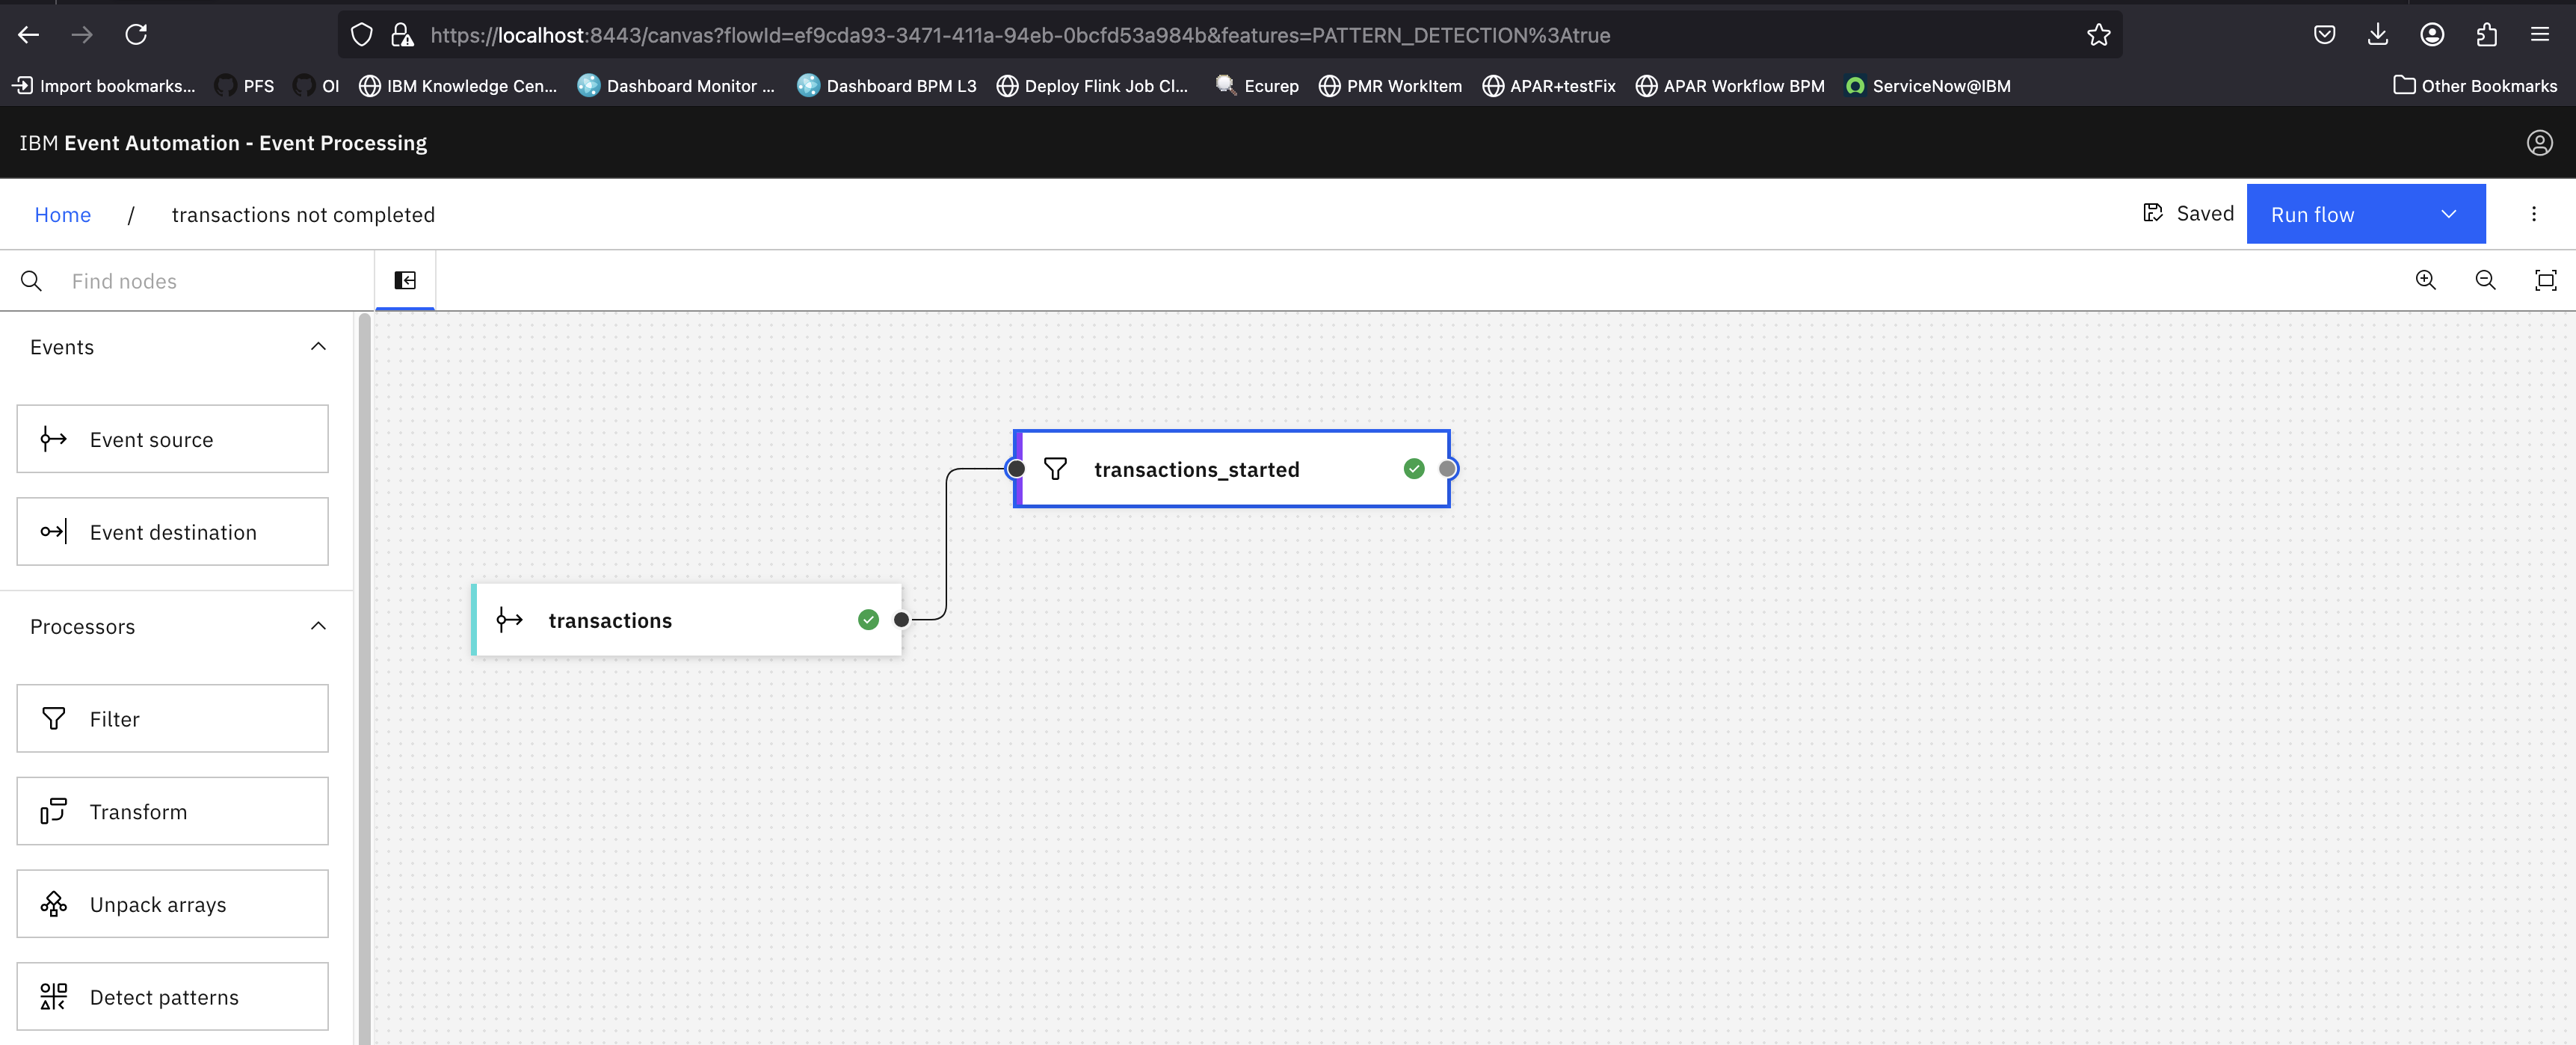
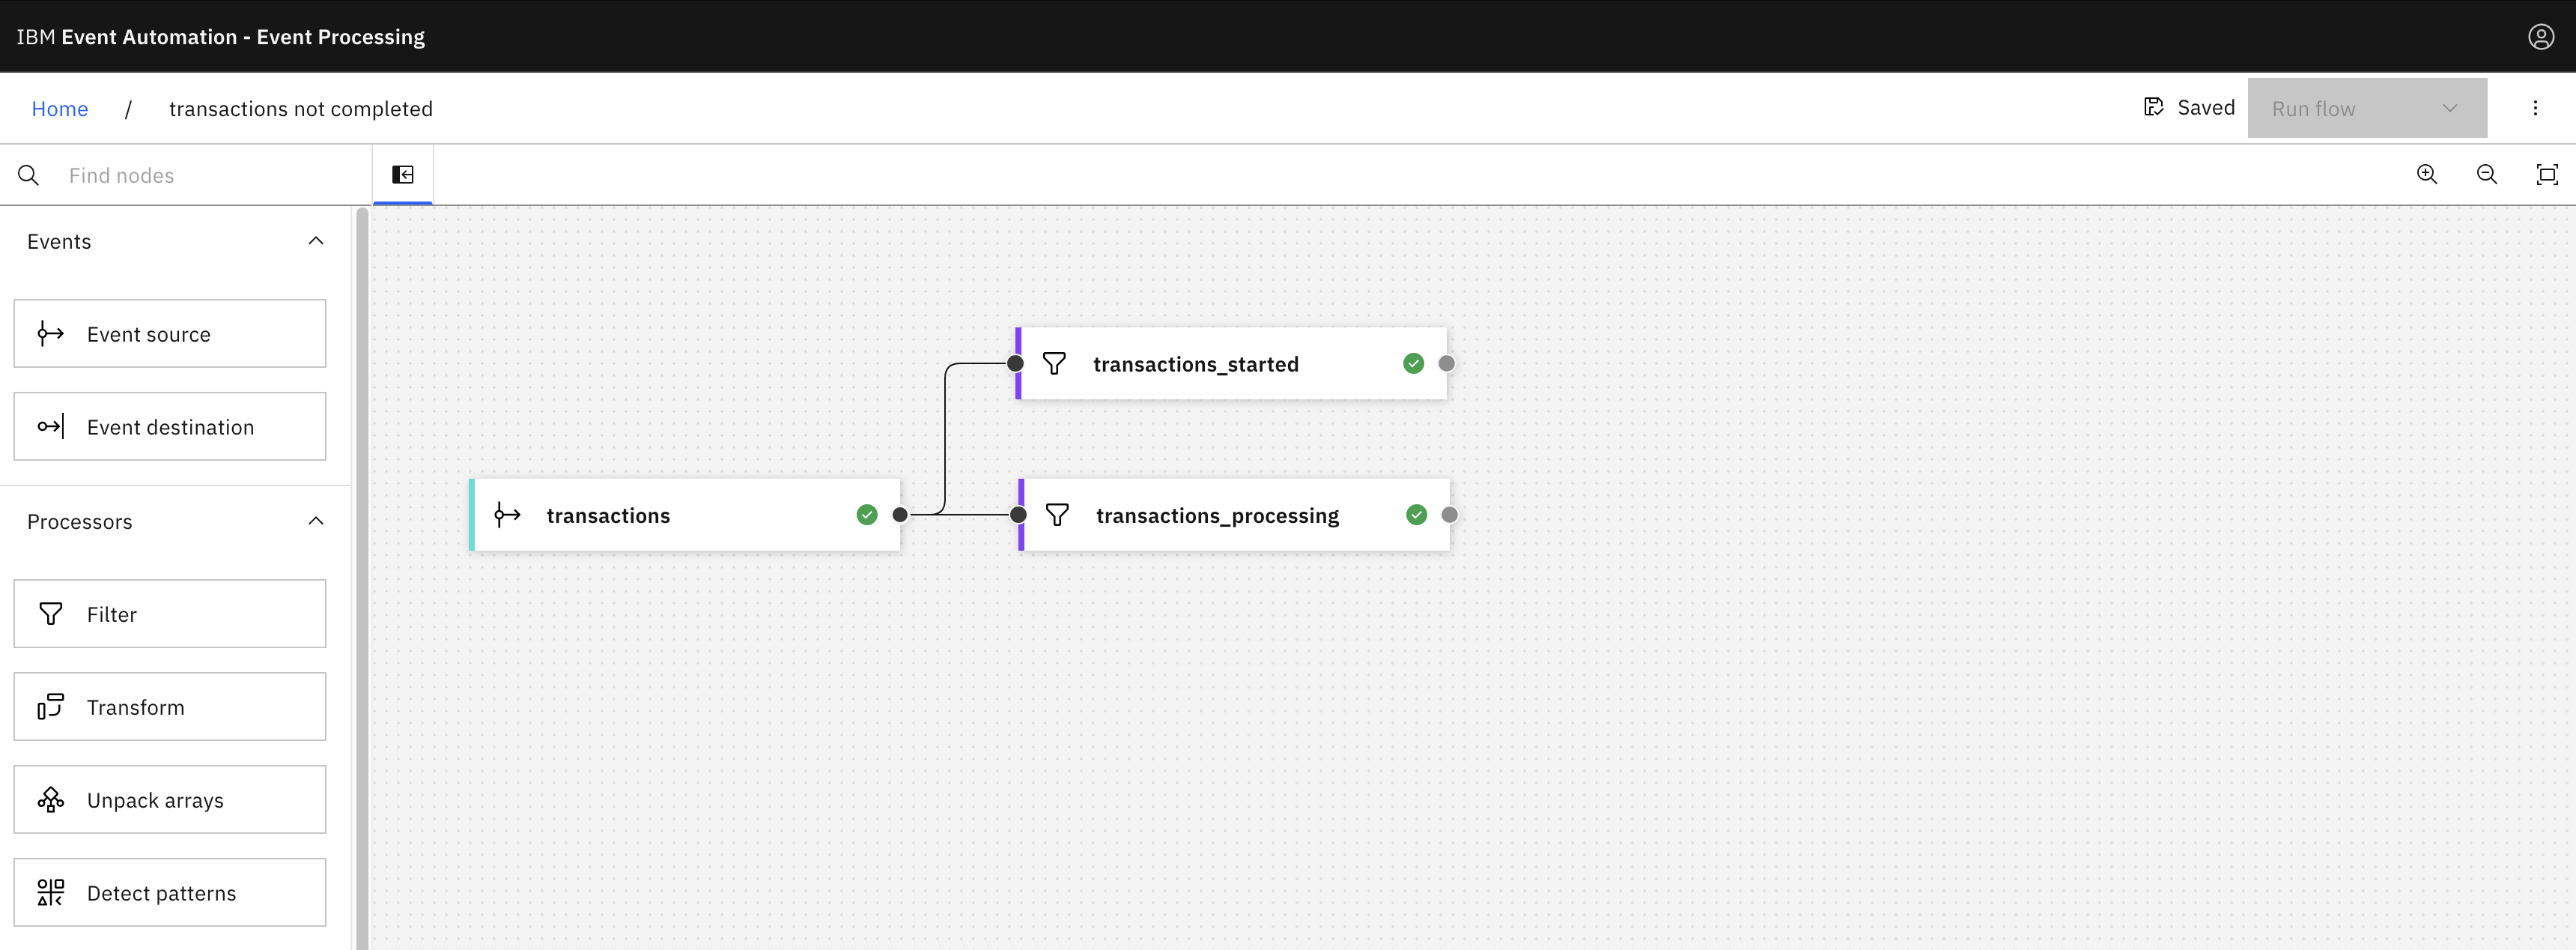
Add a Filter node for the
STARTEDstate and link it to thetransactionsevent.Hover over the filter node, and click
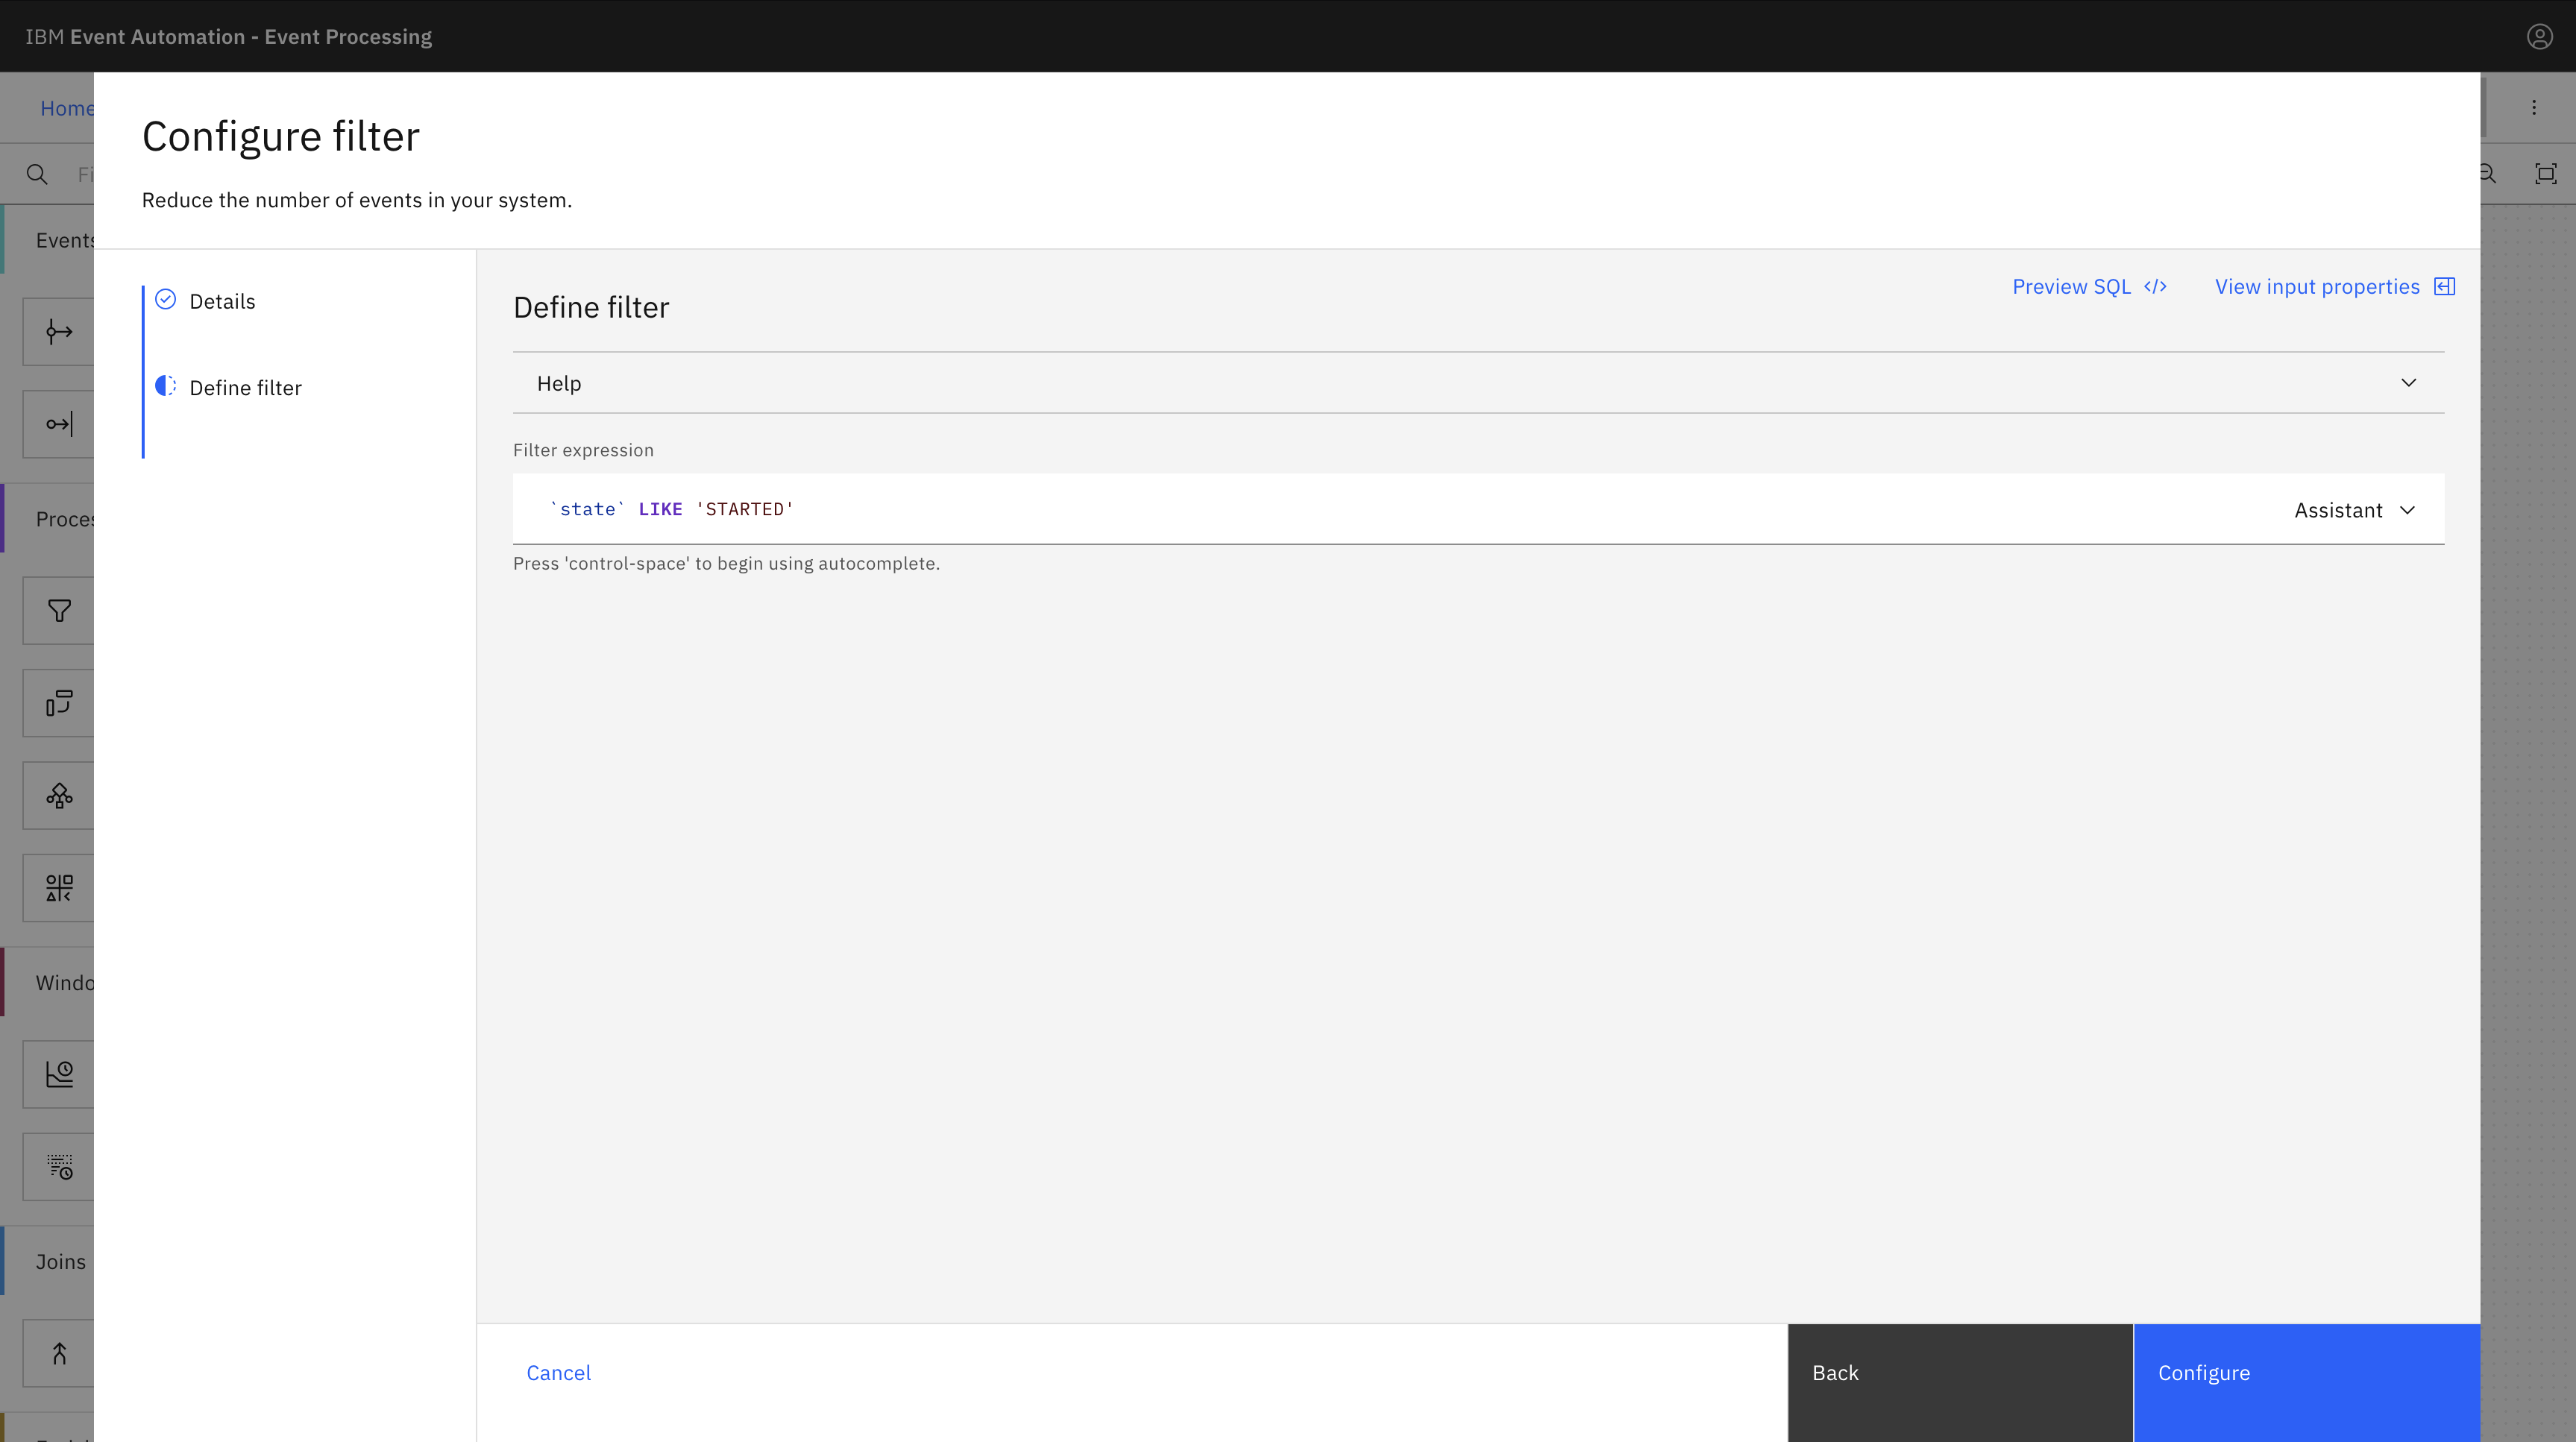
Edit to configure the node. In the Node name field, enter the name of the filter node as
transactions_started, and then click Next.Enter the filter expression `state` LIKE ‘STARTED’, click Next to open the Output properties pane, and then click Configure.
-
Add another Filter node for the
PROCESSINGstate and link it to thetransactionsevent.Hover over the filter node, and click
Edit to configure the node. In the Node name field, enter the name of the filter node as
transactions_processing, and then click Next.Enter the filter expression `state` LIKE ‘PROCESSING’, click Next to open the Output properties pane, and then click Configure.
-
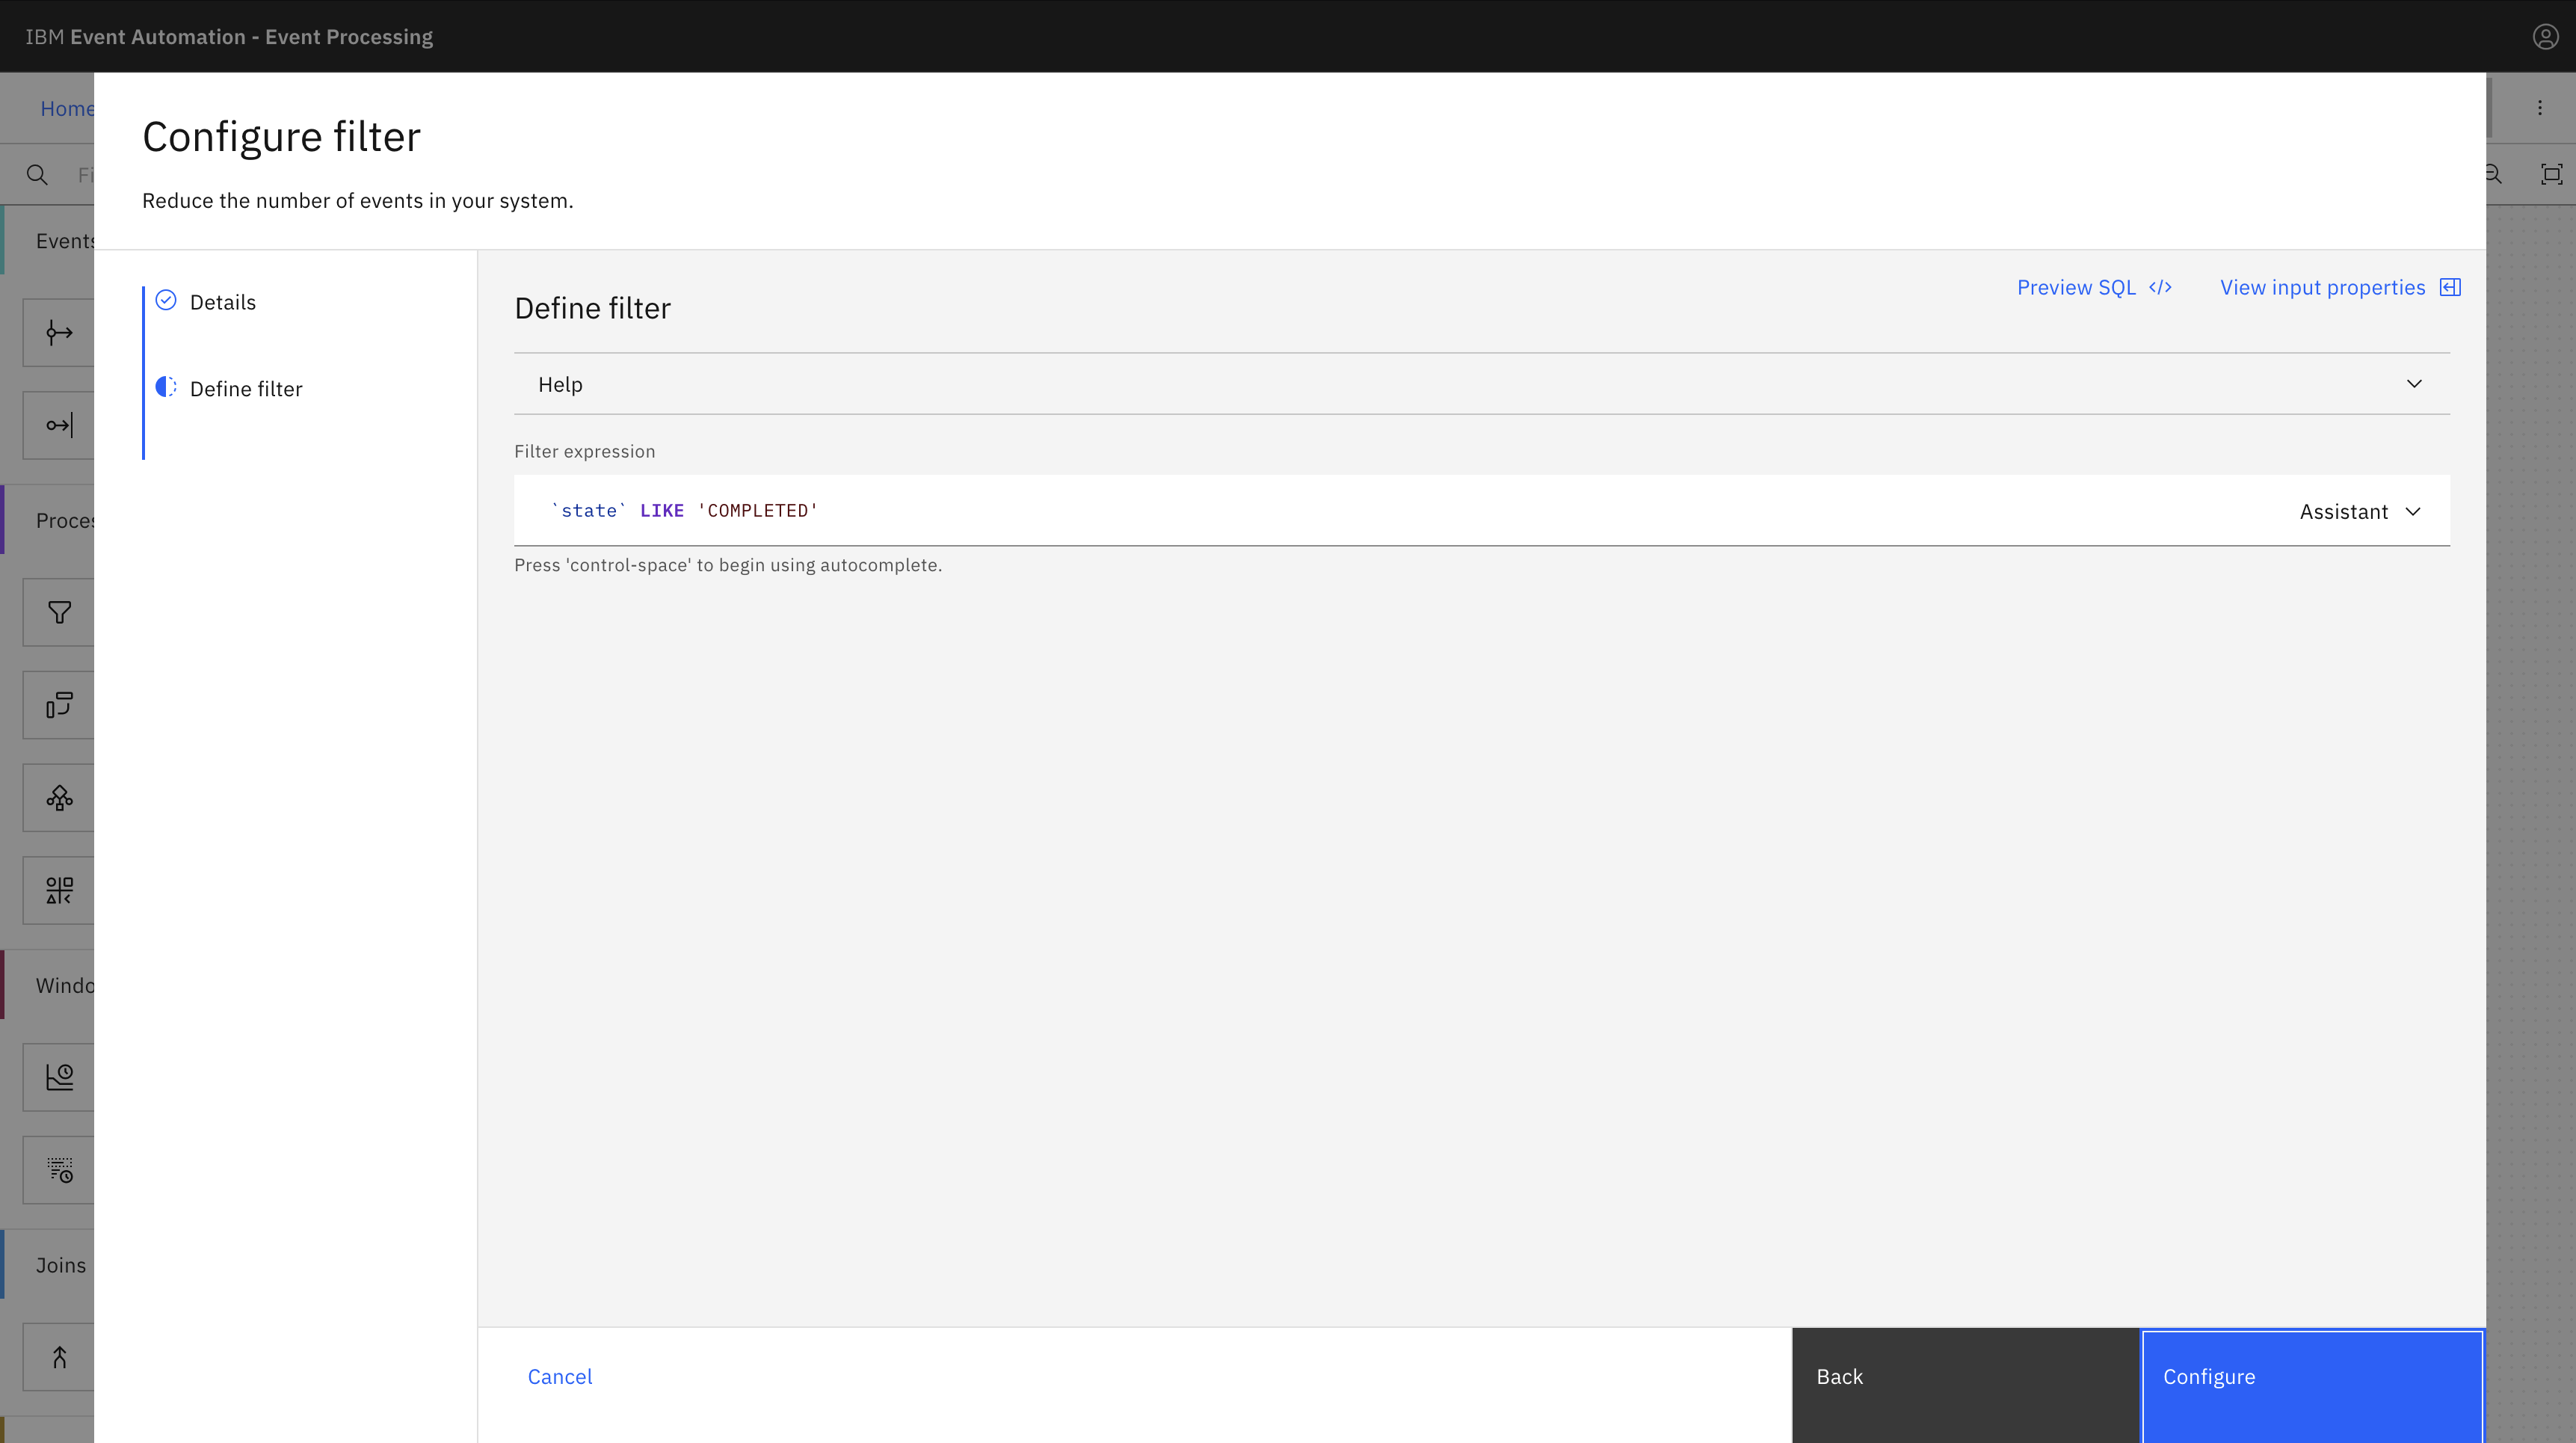
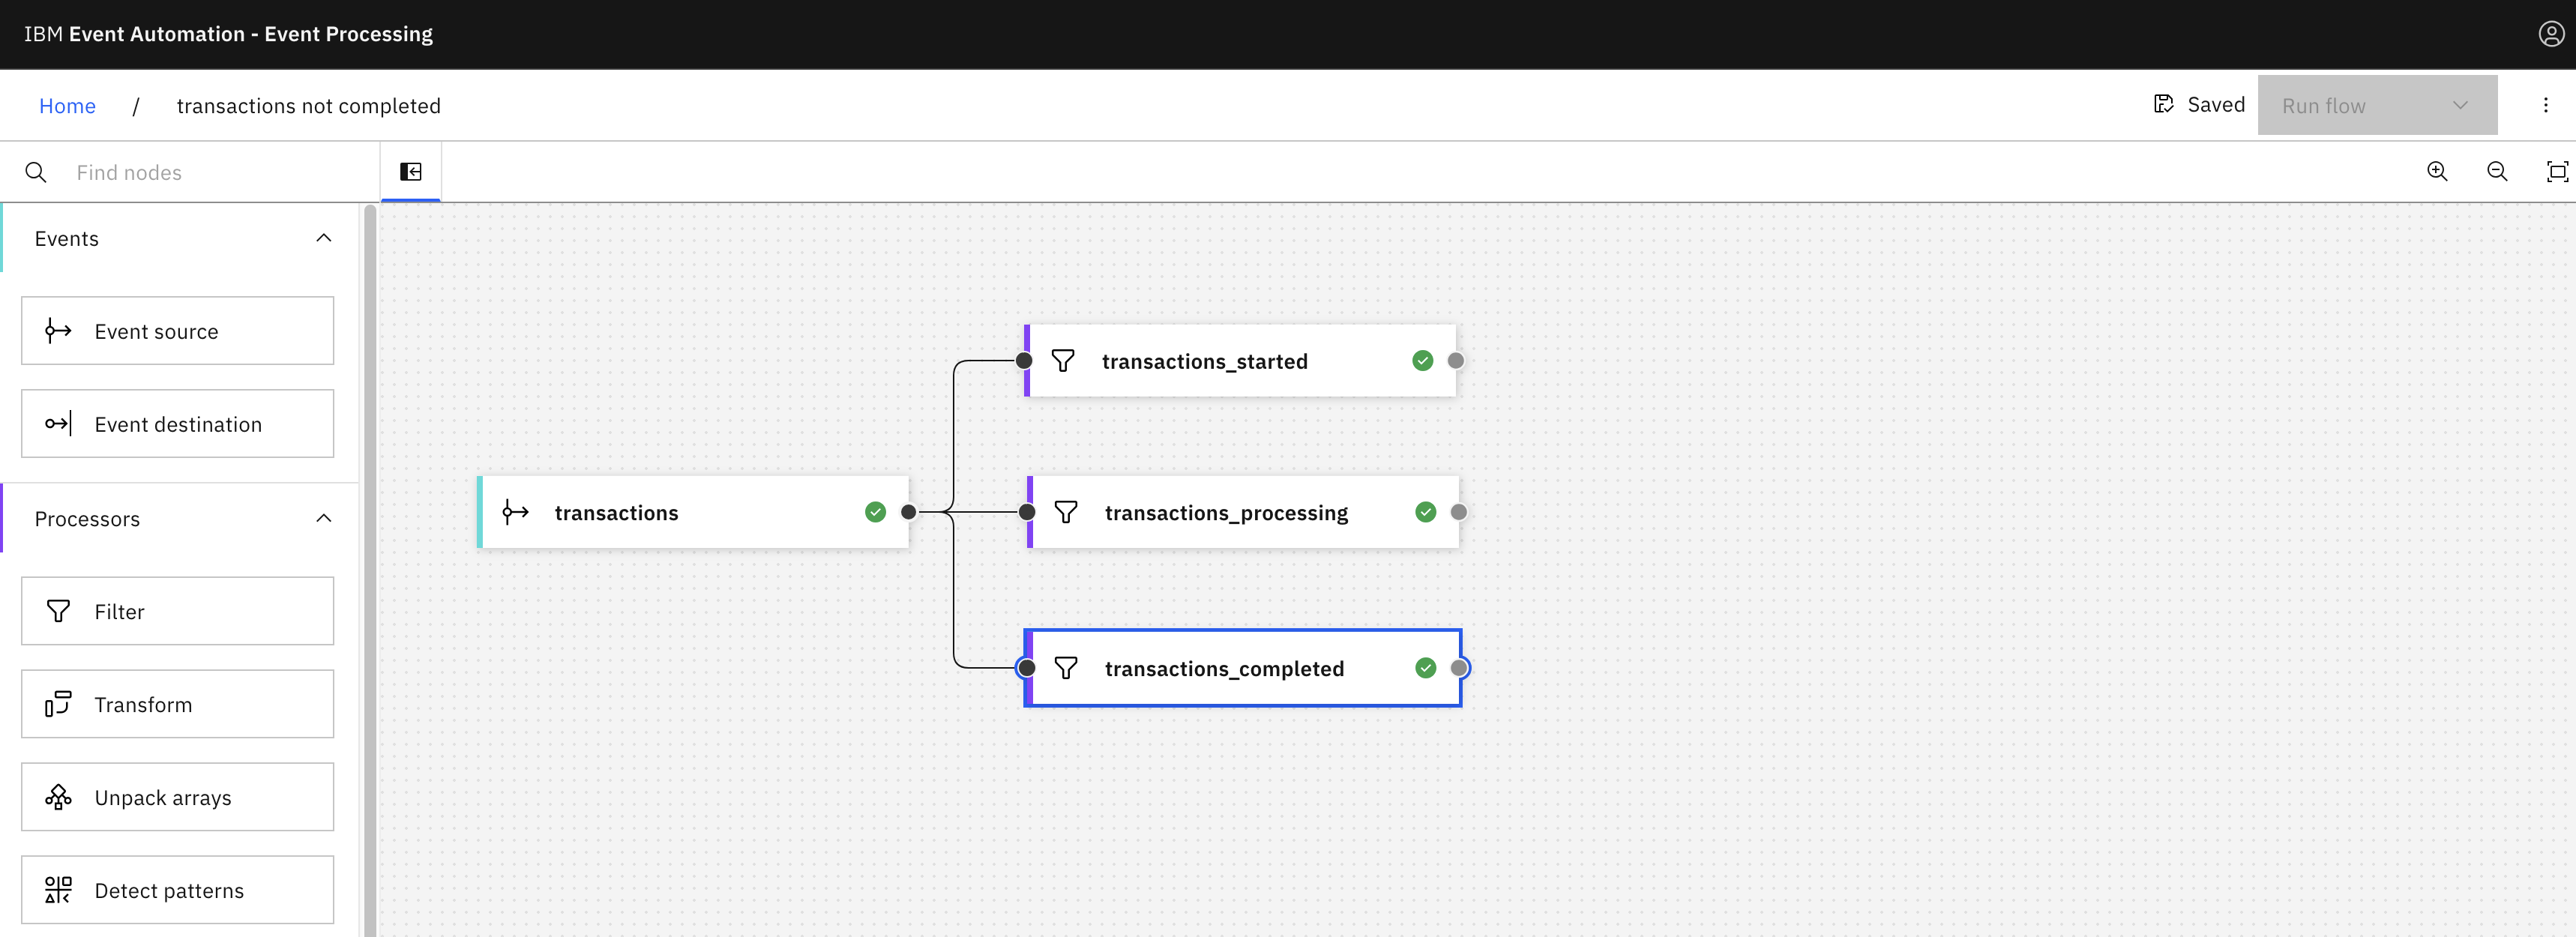
Add another Filter node for the
COMPLETEDstate and link it to thetransactionsevent.Hover over the filter node, and click
Edit to configure the node. In the Node name field, enter the name of the filter node as
transactions_completed, and then click Next.Enter the filter expression `state` LIKE ‘COMPLETED’, click Next to open the Output properties pane, and then click Configure.
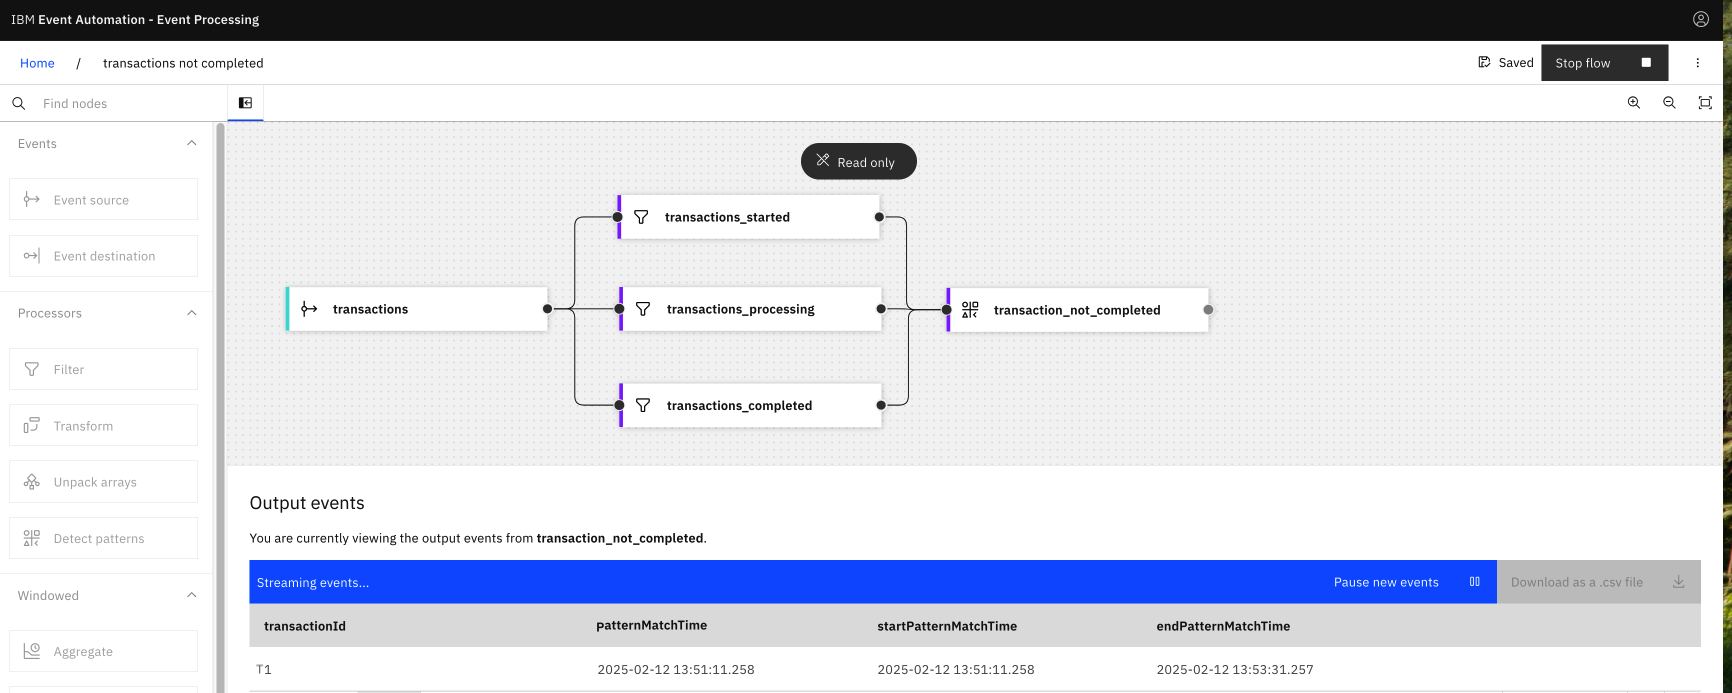
Step 5: Detect transactions that are not completed
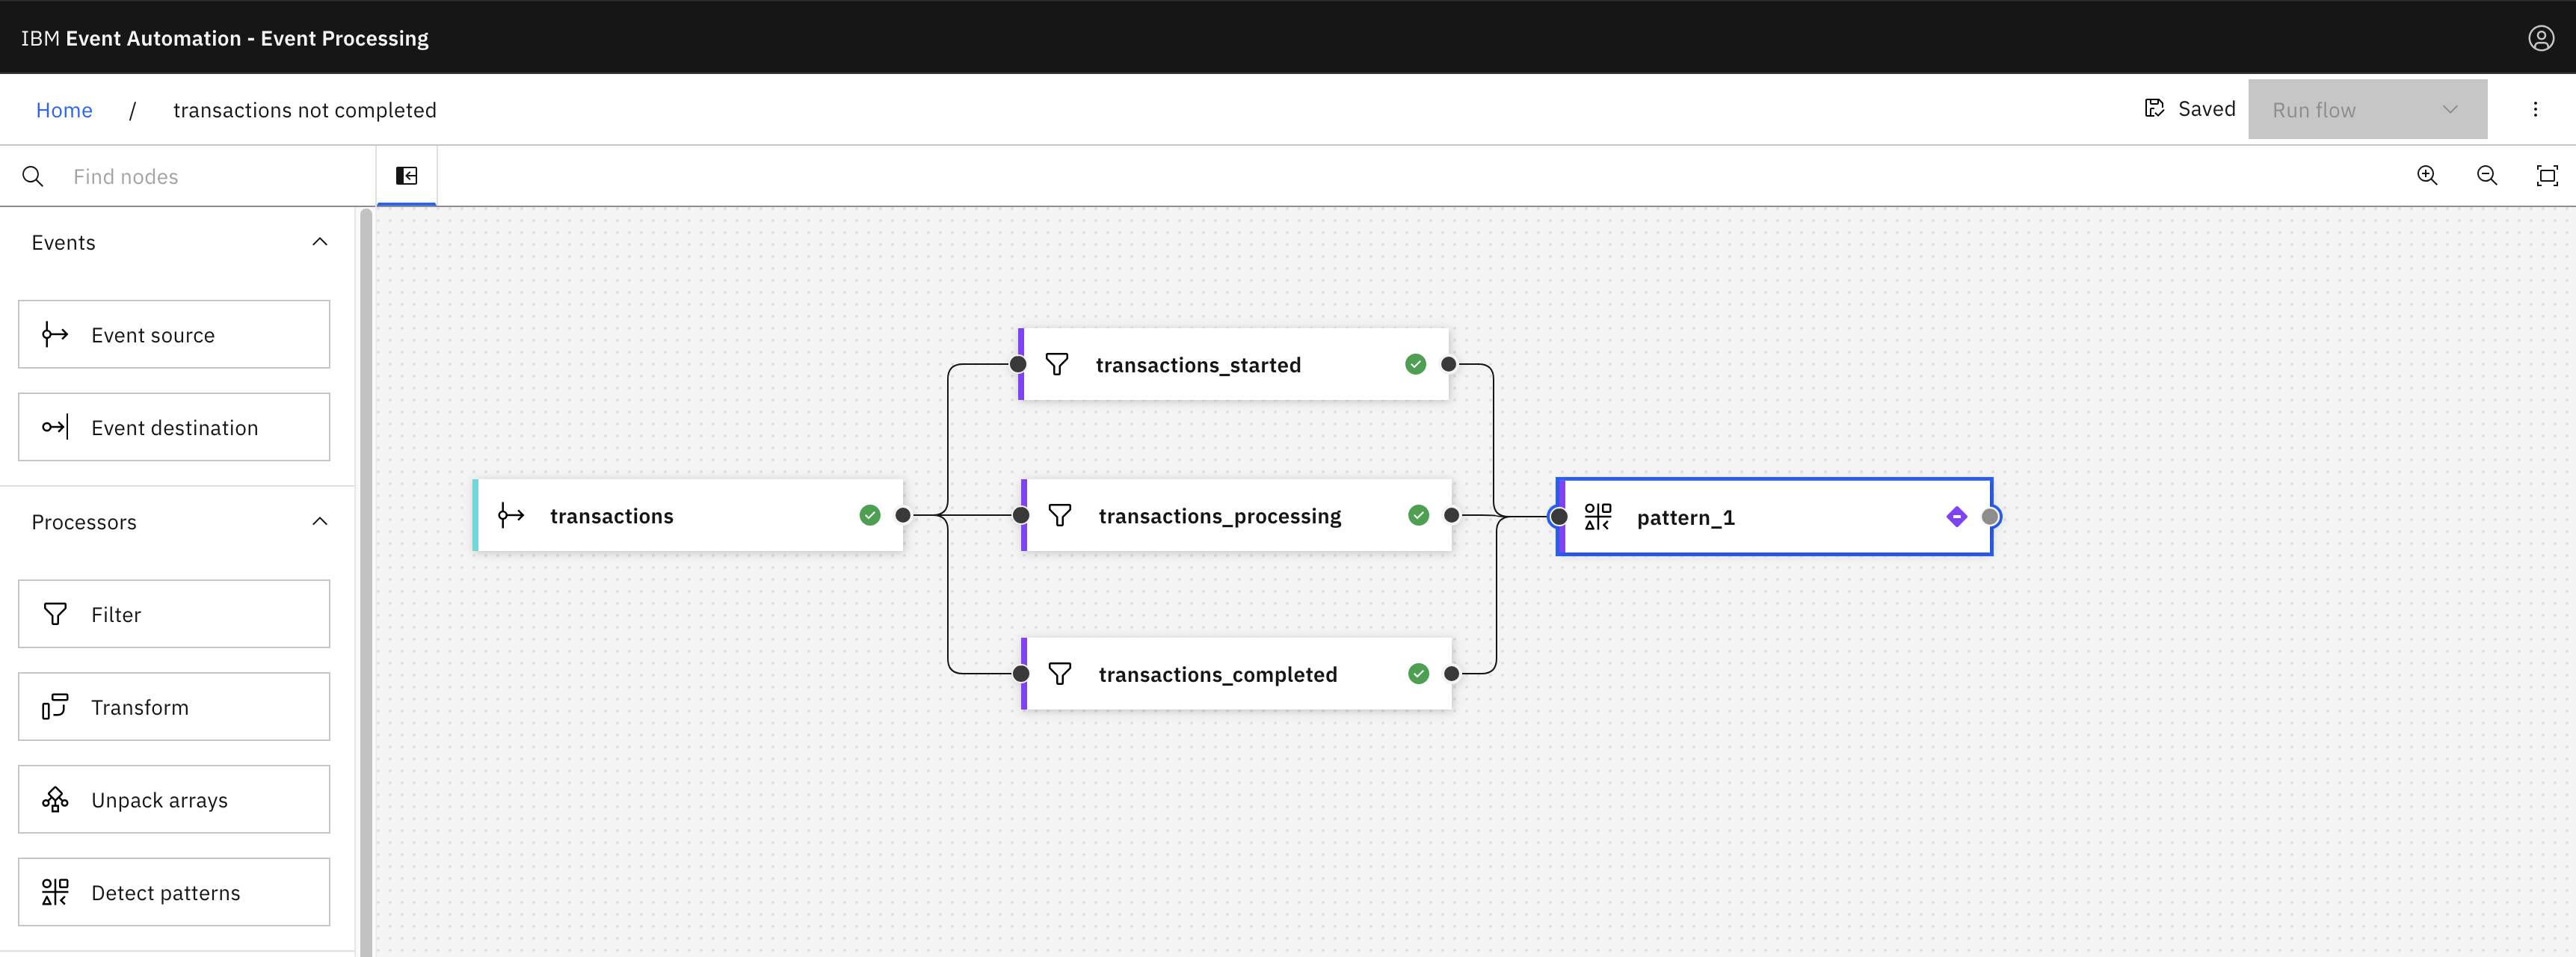
To detect failed transactions, use the detect patterns node as follows.
-
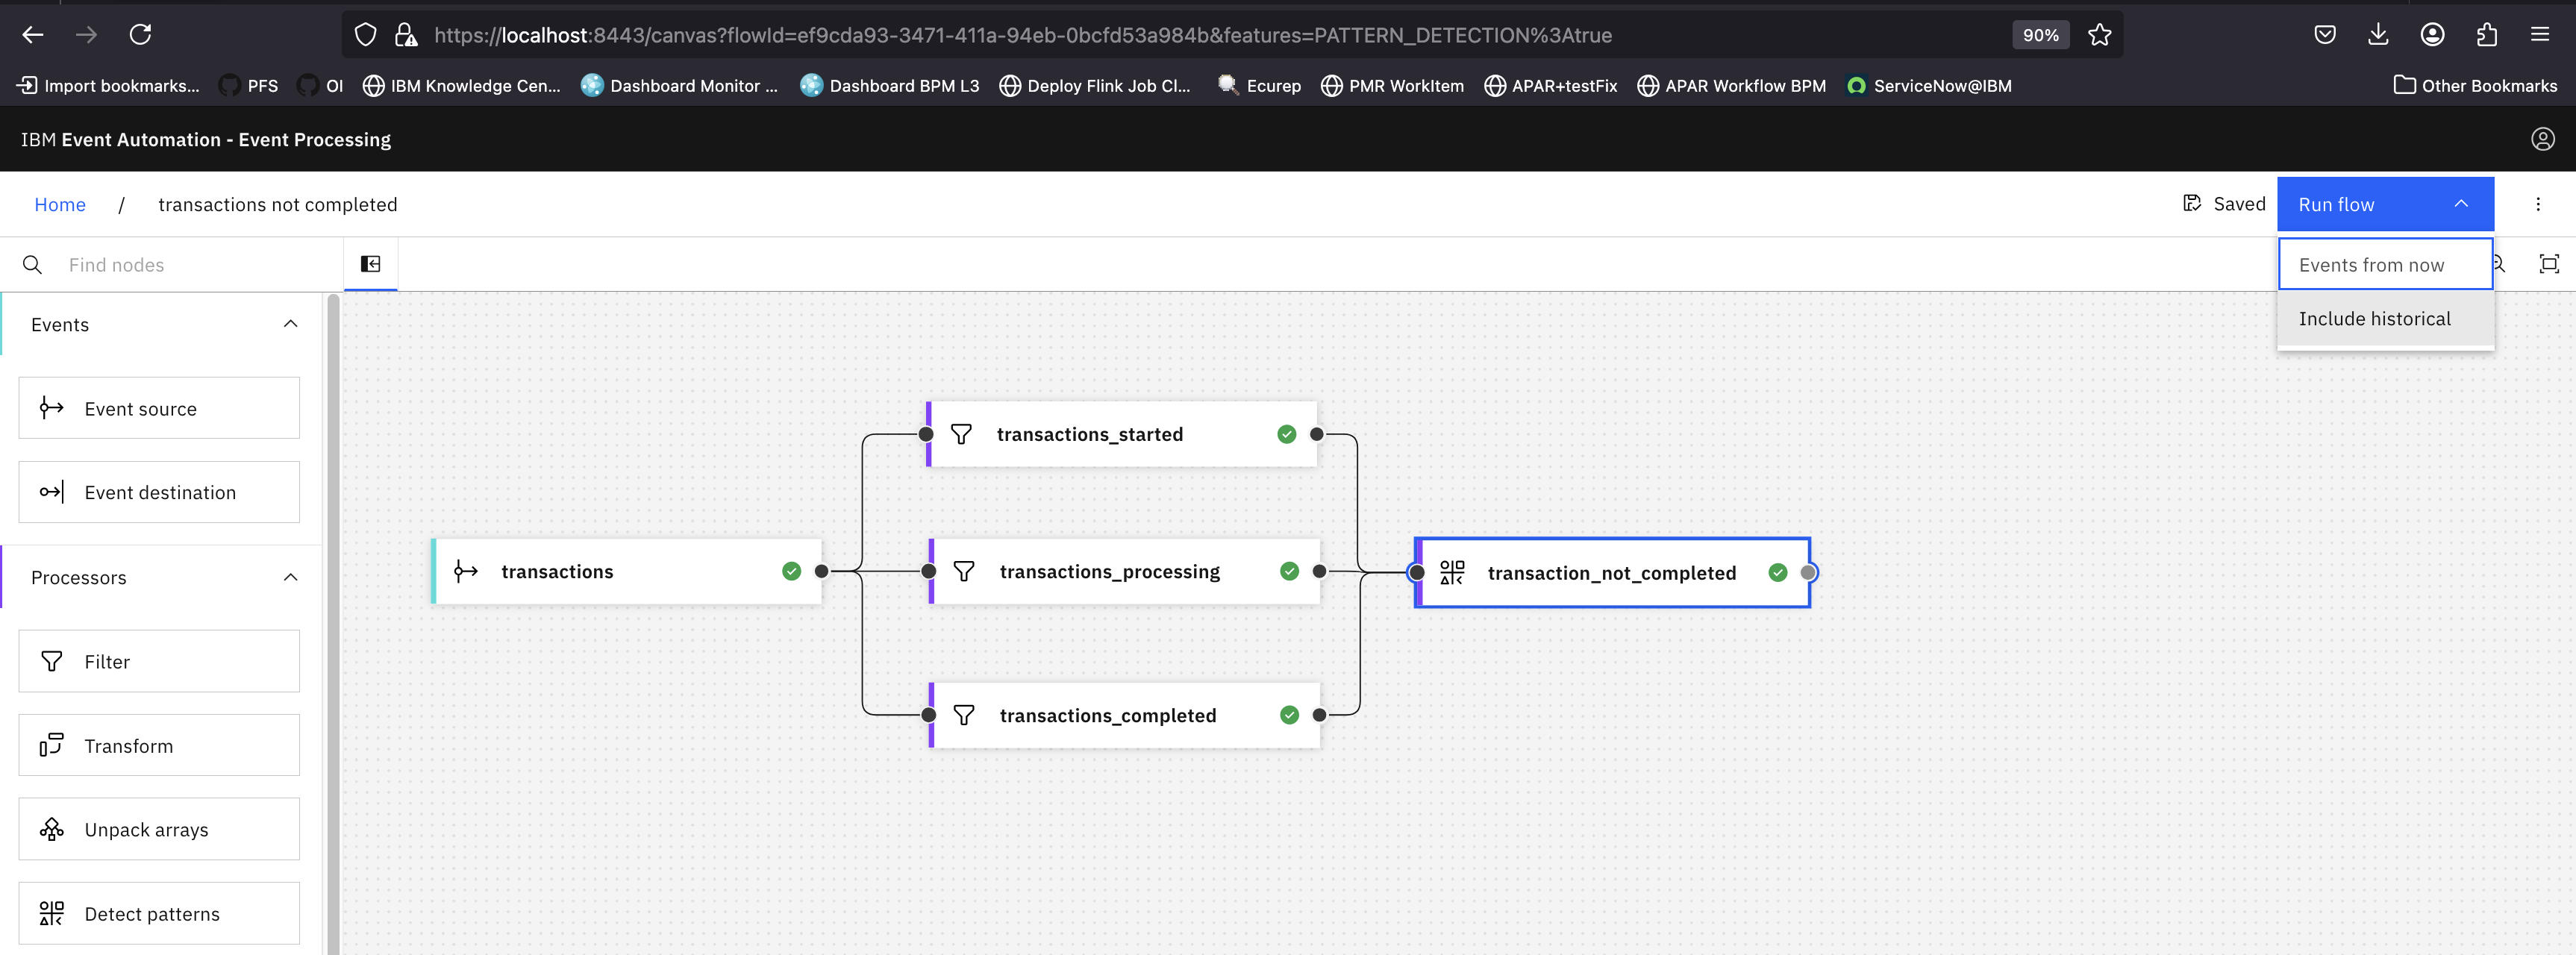
Add a Detect patterns node and link it to each output of your three filters.
Hover over the detect patterns node, and click
Edit to configure the node.
-
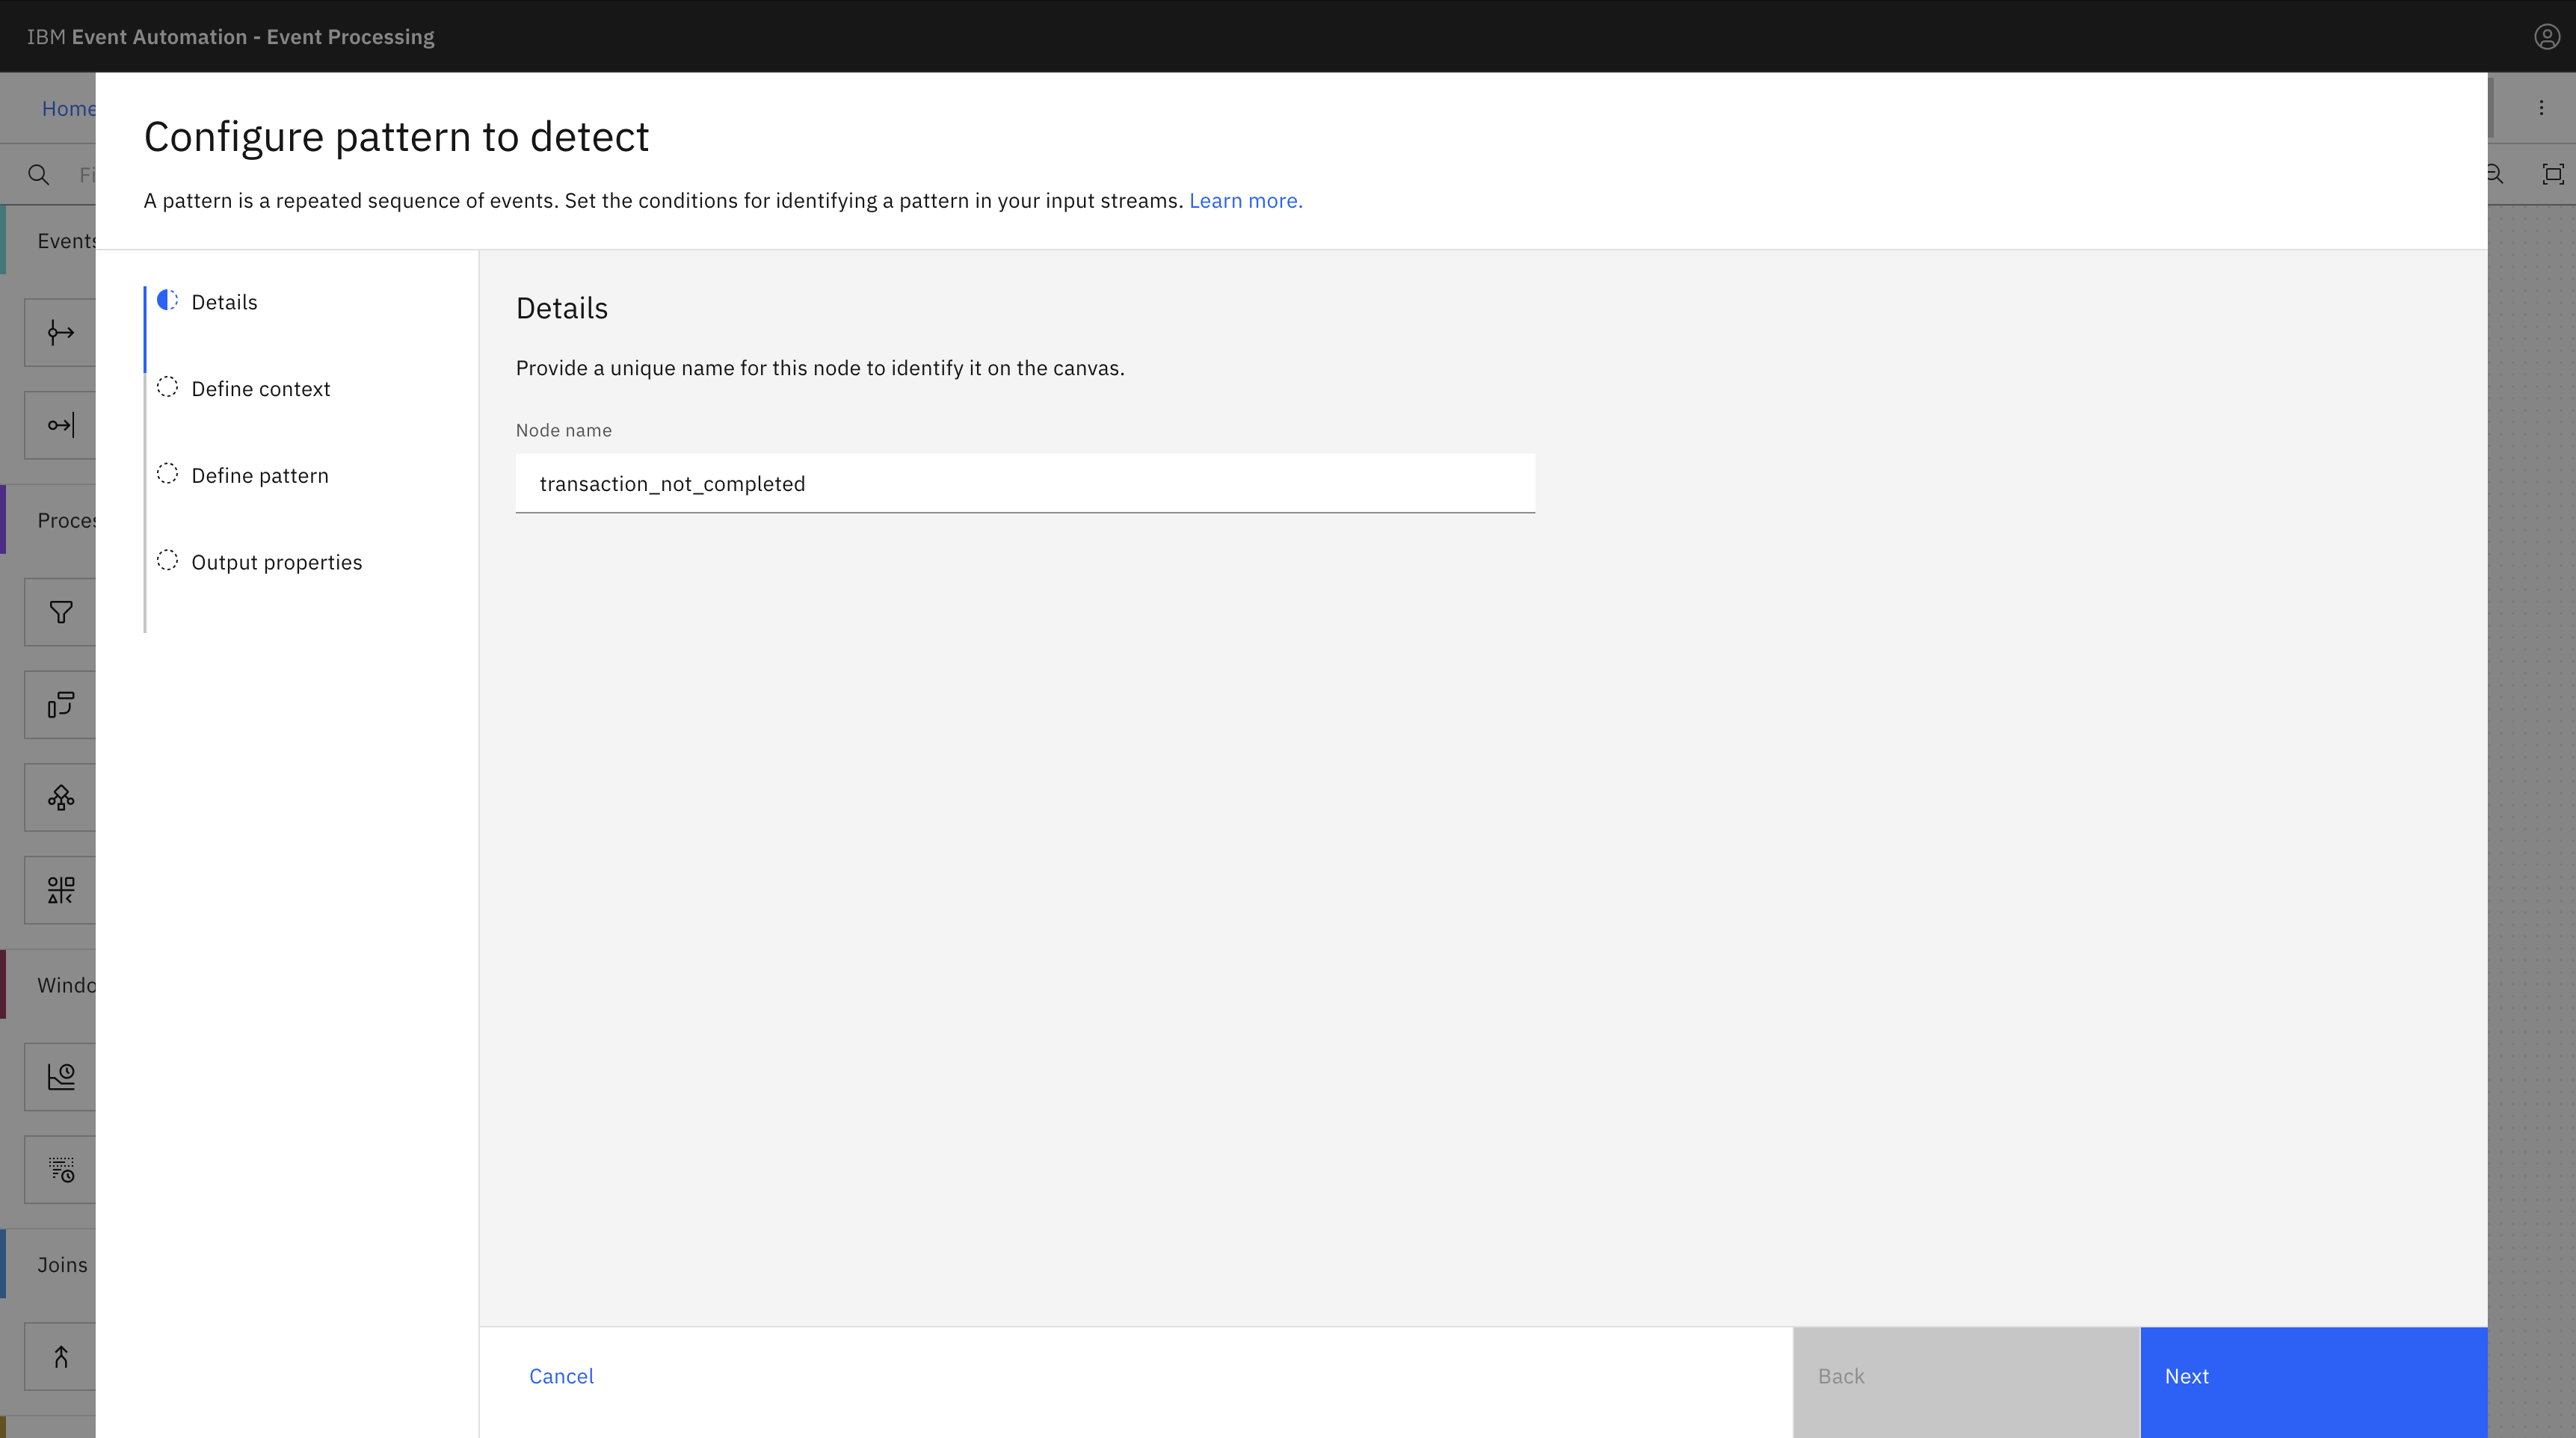
In the Node name field, enter the name of the detect patterns node as
transactions_completed, and then click Next. -
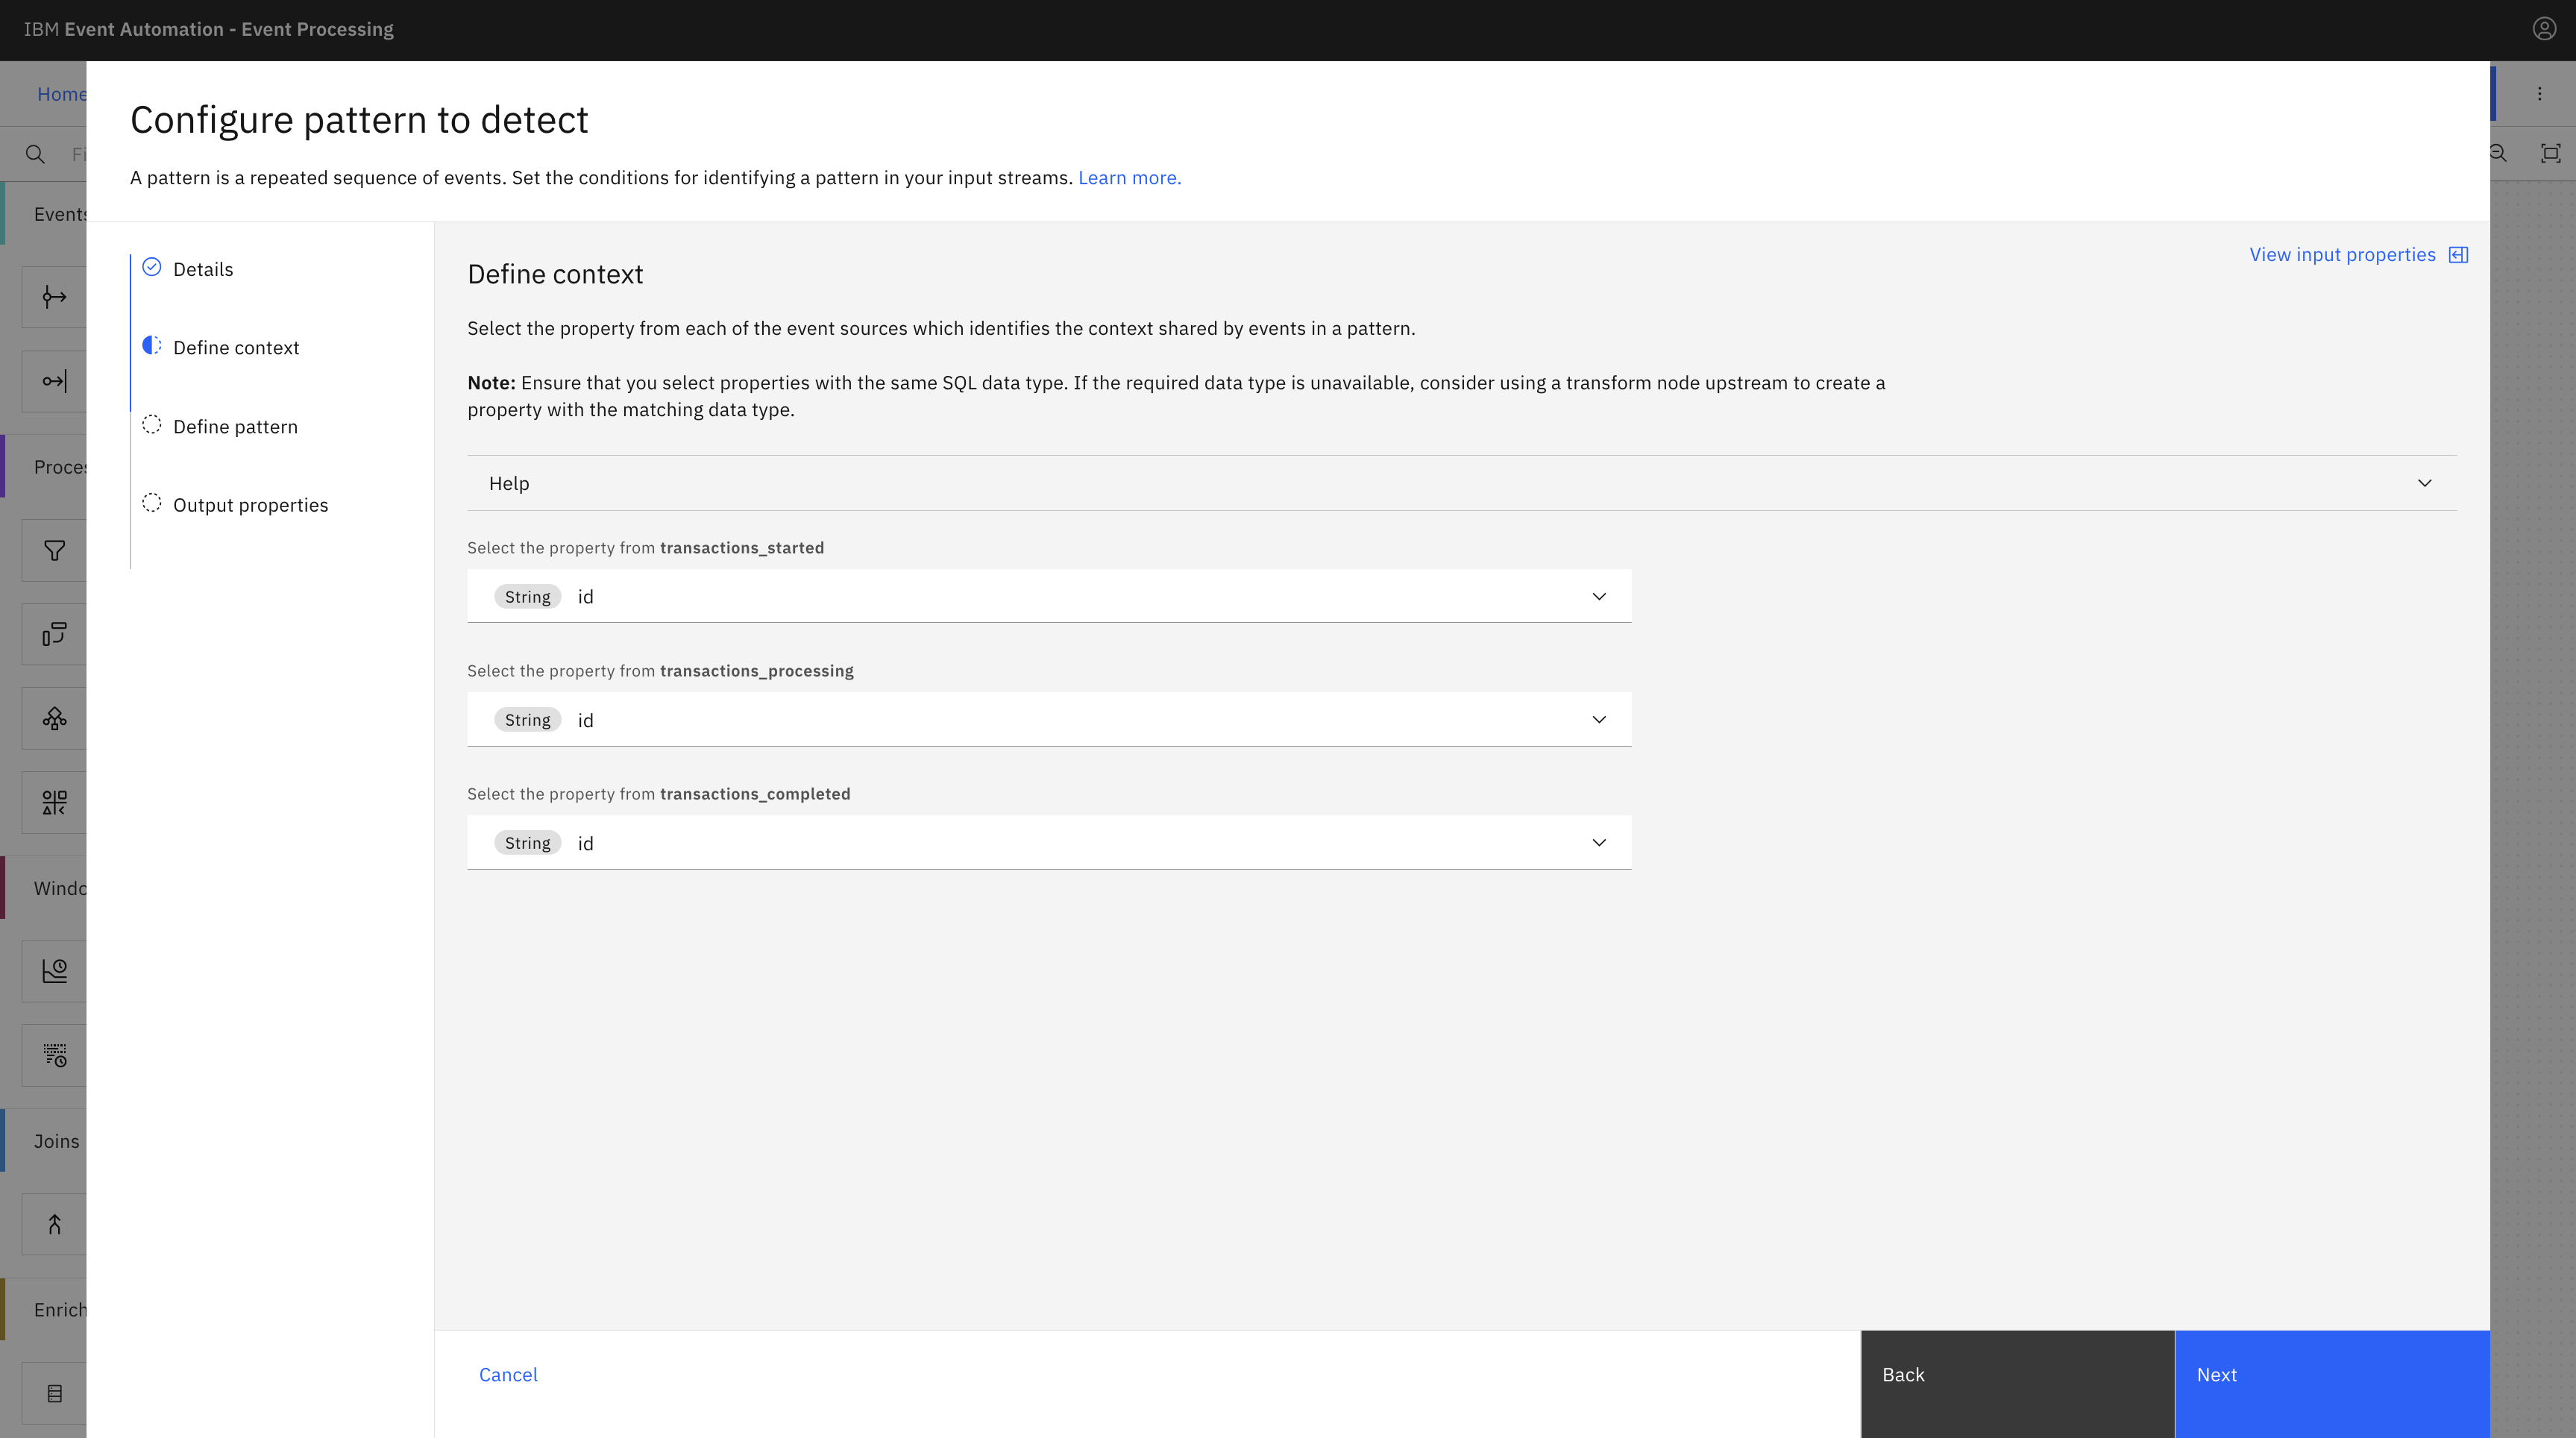
In the Define context, select id from each dropdown list, and then click Next.
-
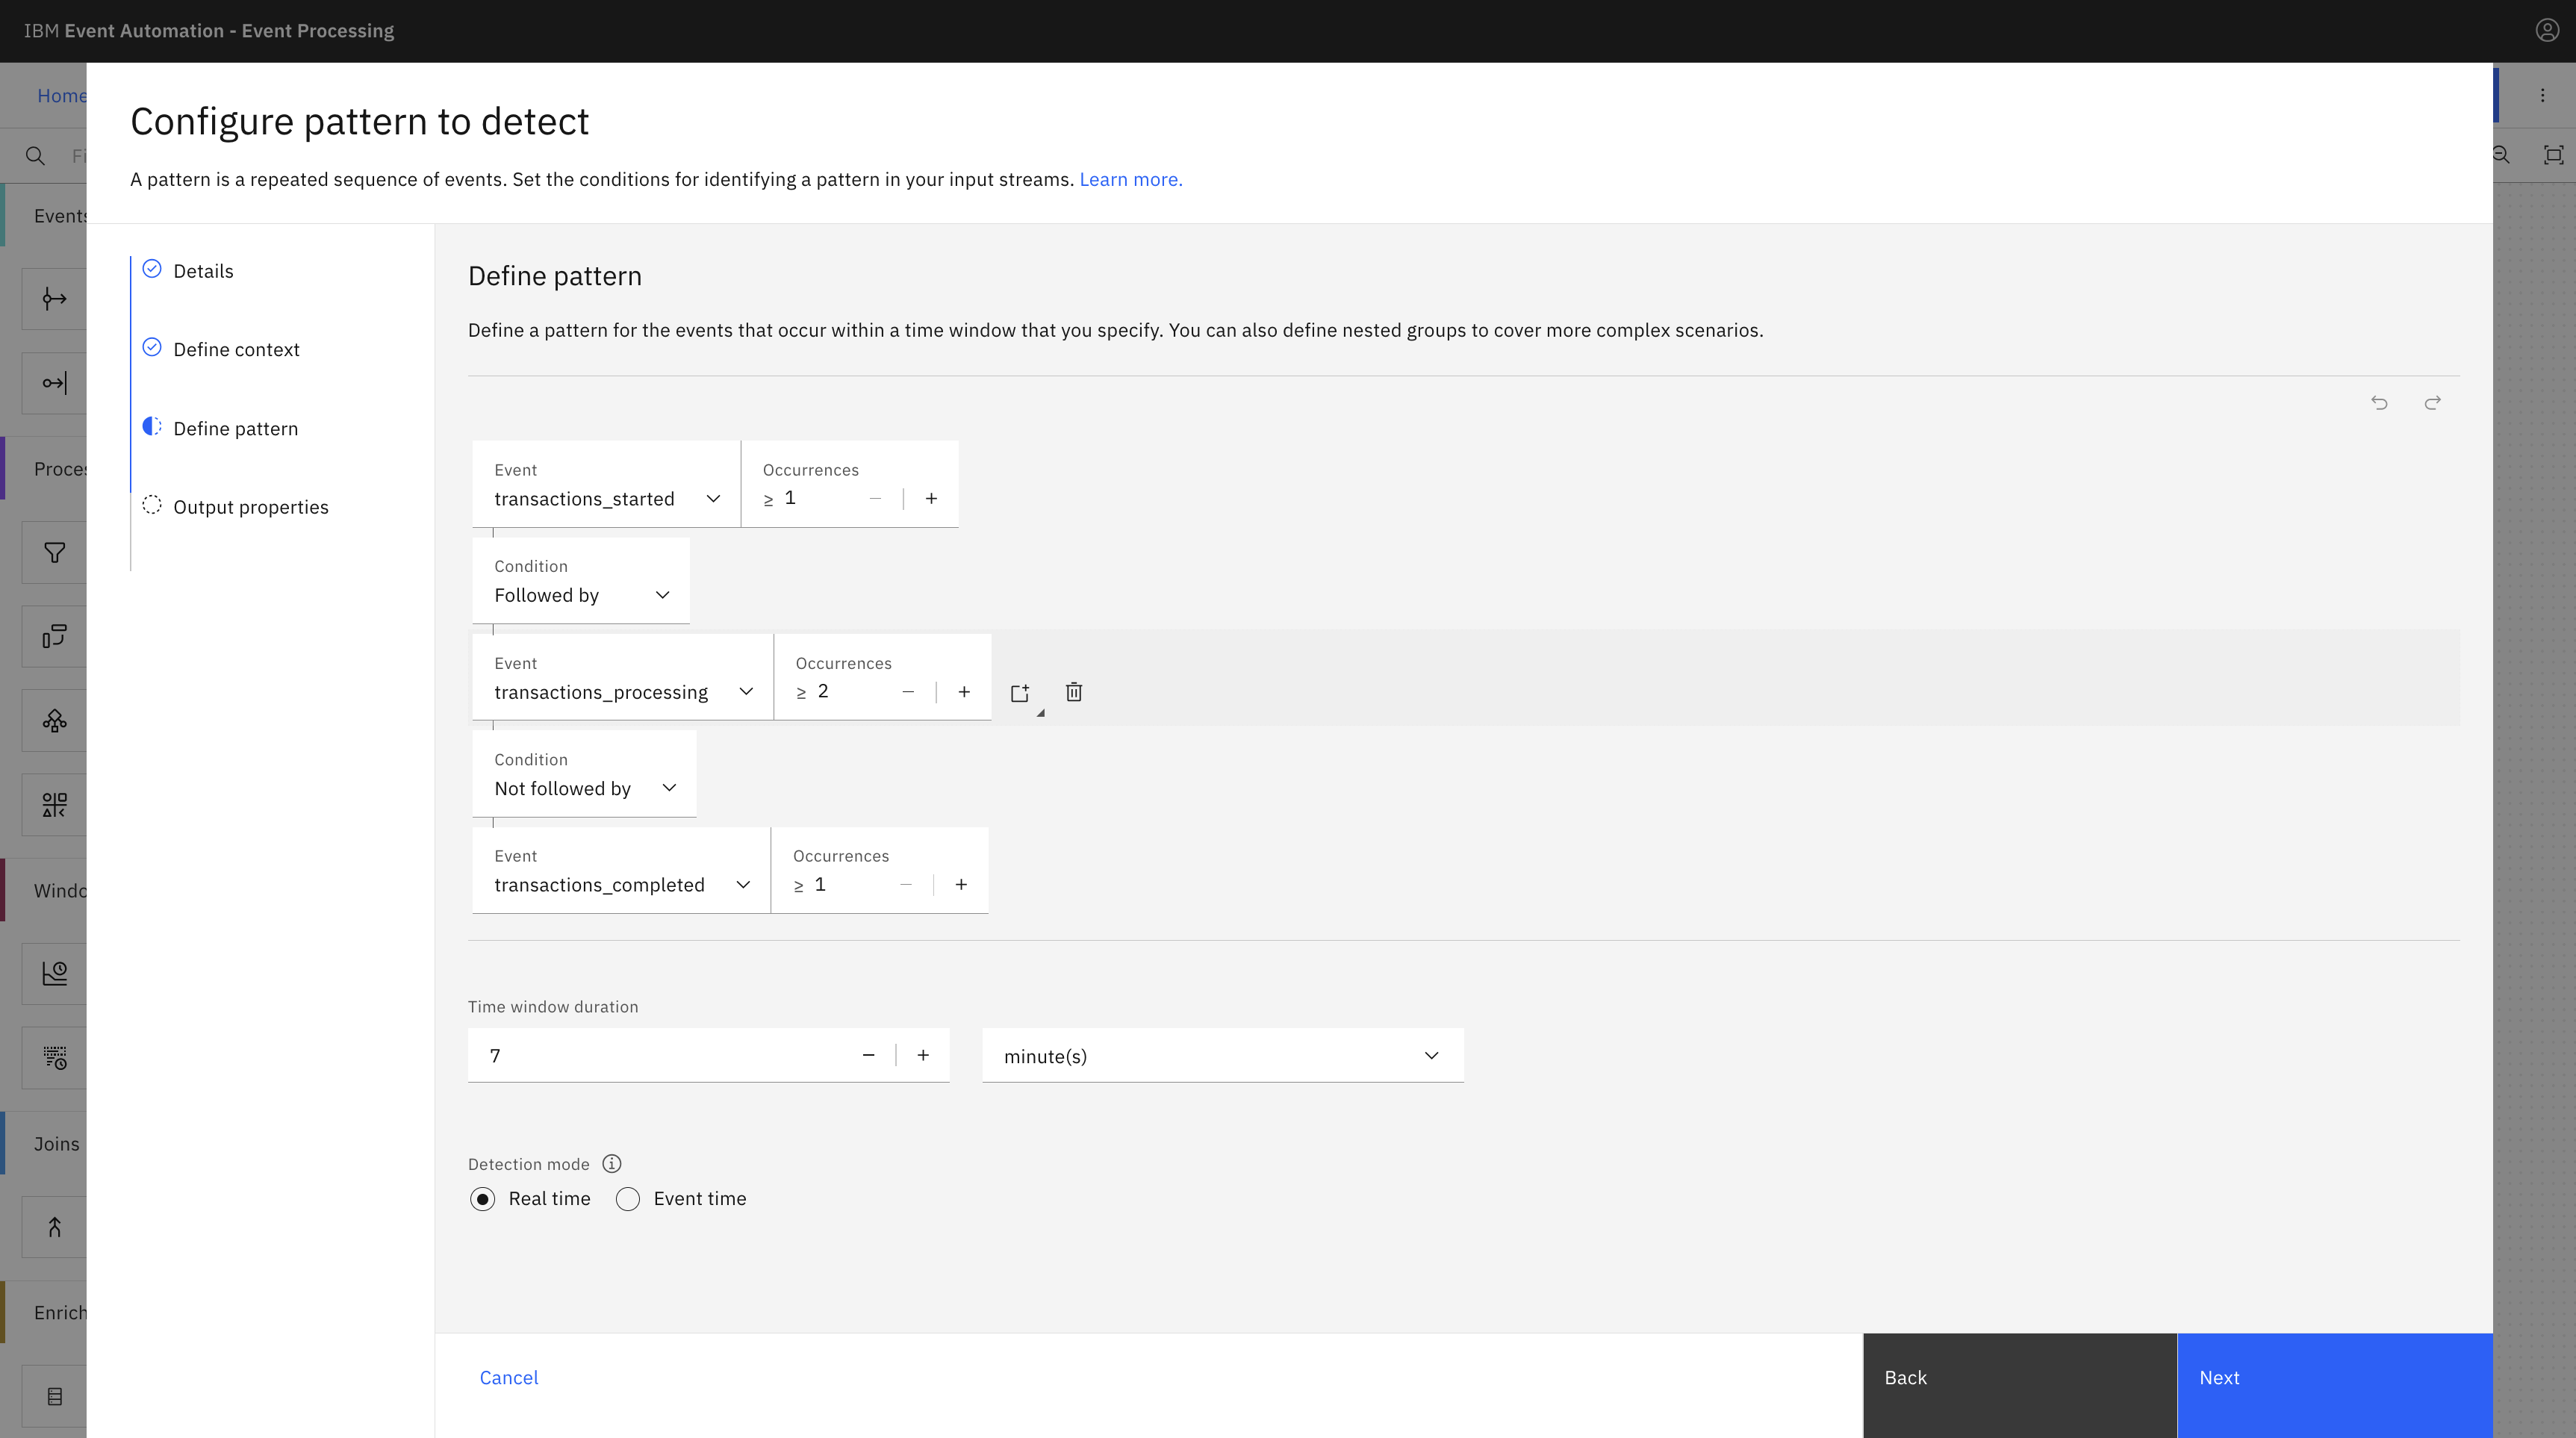
In the Define pattern, create the following matching condition:
Event: transaction_started, occurrence: 1
Condition: Followed by
Event: transaction_processing, occurrence: 2
Condition: Not followed by
Event: transaction_completed, occurrence: 1
For the Event time property to detect patterns, select
transactions_started (timestamp)as the event time property for pattern detection.For the Time window duration, select
7 minutes.For the Detection mode, select Real time, then click Next.
-
In the Output properties, remove property
patternMatchTimeand rename propertycontextKeytotransactionId, then click Configure. -
From the menu, click button Run flow then select Include historical.
After a moment, the output will be displayed.
Recap
You used filter node to filter the state of your transactions into separate events and detected failed transactions by using the detect patterns node.
