This page contains details for how to access the connection details for IBM Event Automation deployments created by using the tutorial environment setup.
Web interfaces
The tutorial environment includes a deployment of an admin web interface for each of the three Event Automation capabilities. This section explains how you can find the URL and login credentials for accessing them.
Event Streams
URL
To access the Event Streams UI, follow these steps to locate the web address in the OpenShift console.
-
From the Administrator view in the OpenShift console, navigate to Operators > Installed Operators.
-
Set the Project to
event-automation. -
Click the IBM Event Streams Operator.
-
Navigate to the Event Streams tab, and click the
my-kafka-clusteritem. -
The web address for the Event Streams UI is shown as Admin UI.
Login credentials
To log in to the Event Streams UI, use the default es-admin username and follow these steps to retrieve the password from the OpenShift console or by using the CLI.
-
The username for accessing this UI is
es-admin. -
To find the password for accessing the UI, view the contents of the
passwordvalue of the es-admin secret in theevent-automationproject.
Alternatively, you can retrieve the Event Streams UI URL and the password by using the oc CLI:
# URL
oc get route \
    my-kafka-cluster-ibm-es-ui \
    -n event-automation \
    -o jsonpath='https://{.spec.host}'

# password for 'es-admin' user
oc get secret \
    es-admin \
    -n event-automation \
    -o jsonpath='{.data.password}' | base64 -d
Event Endpoint Management
URL
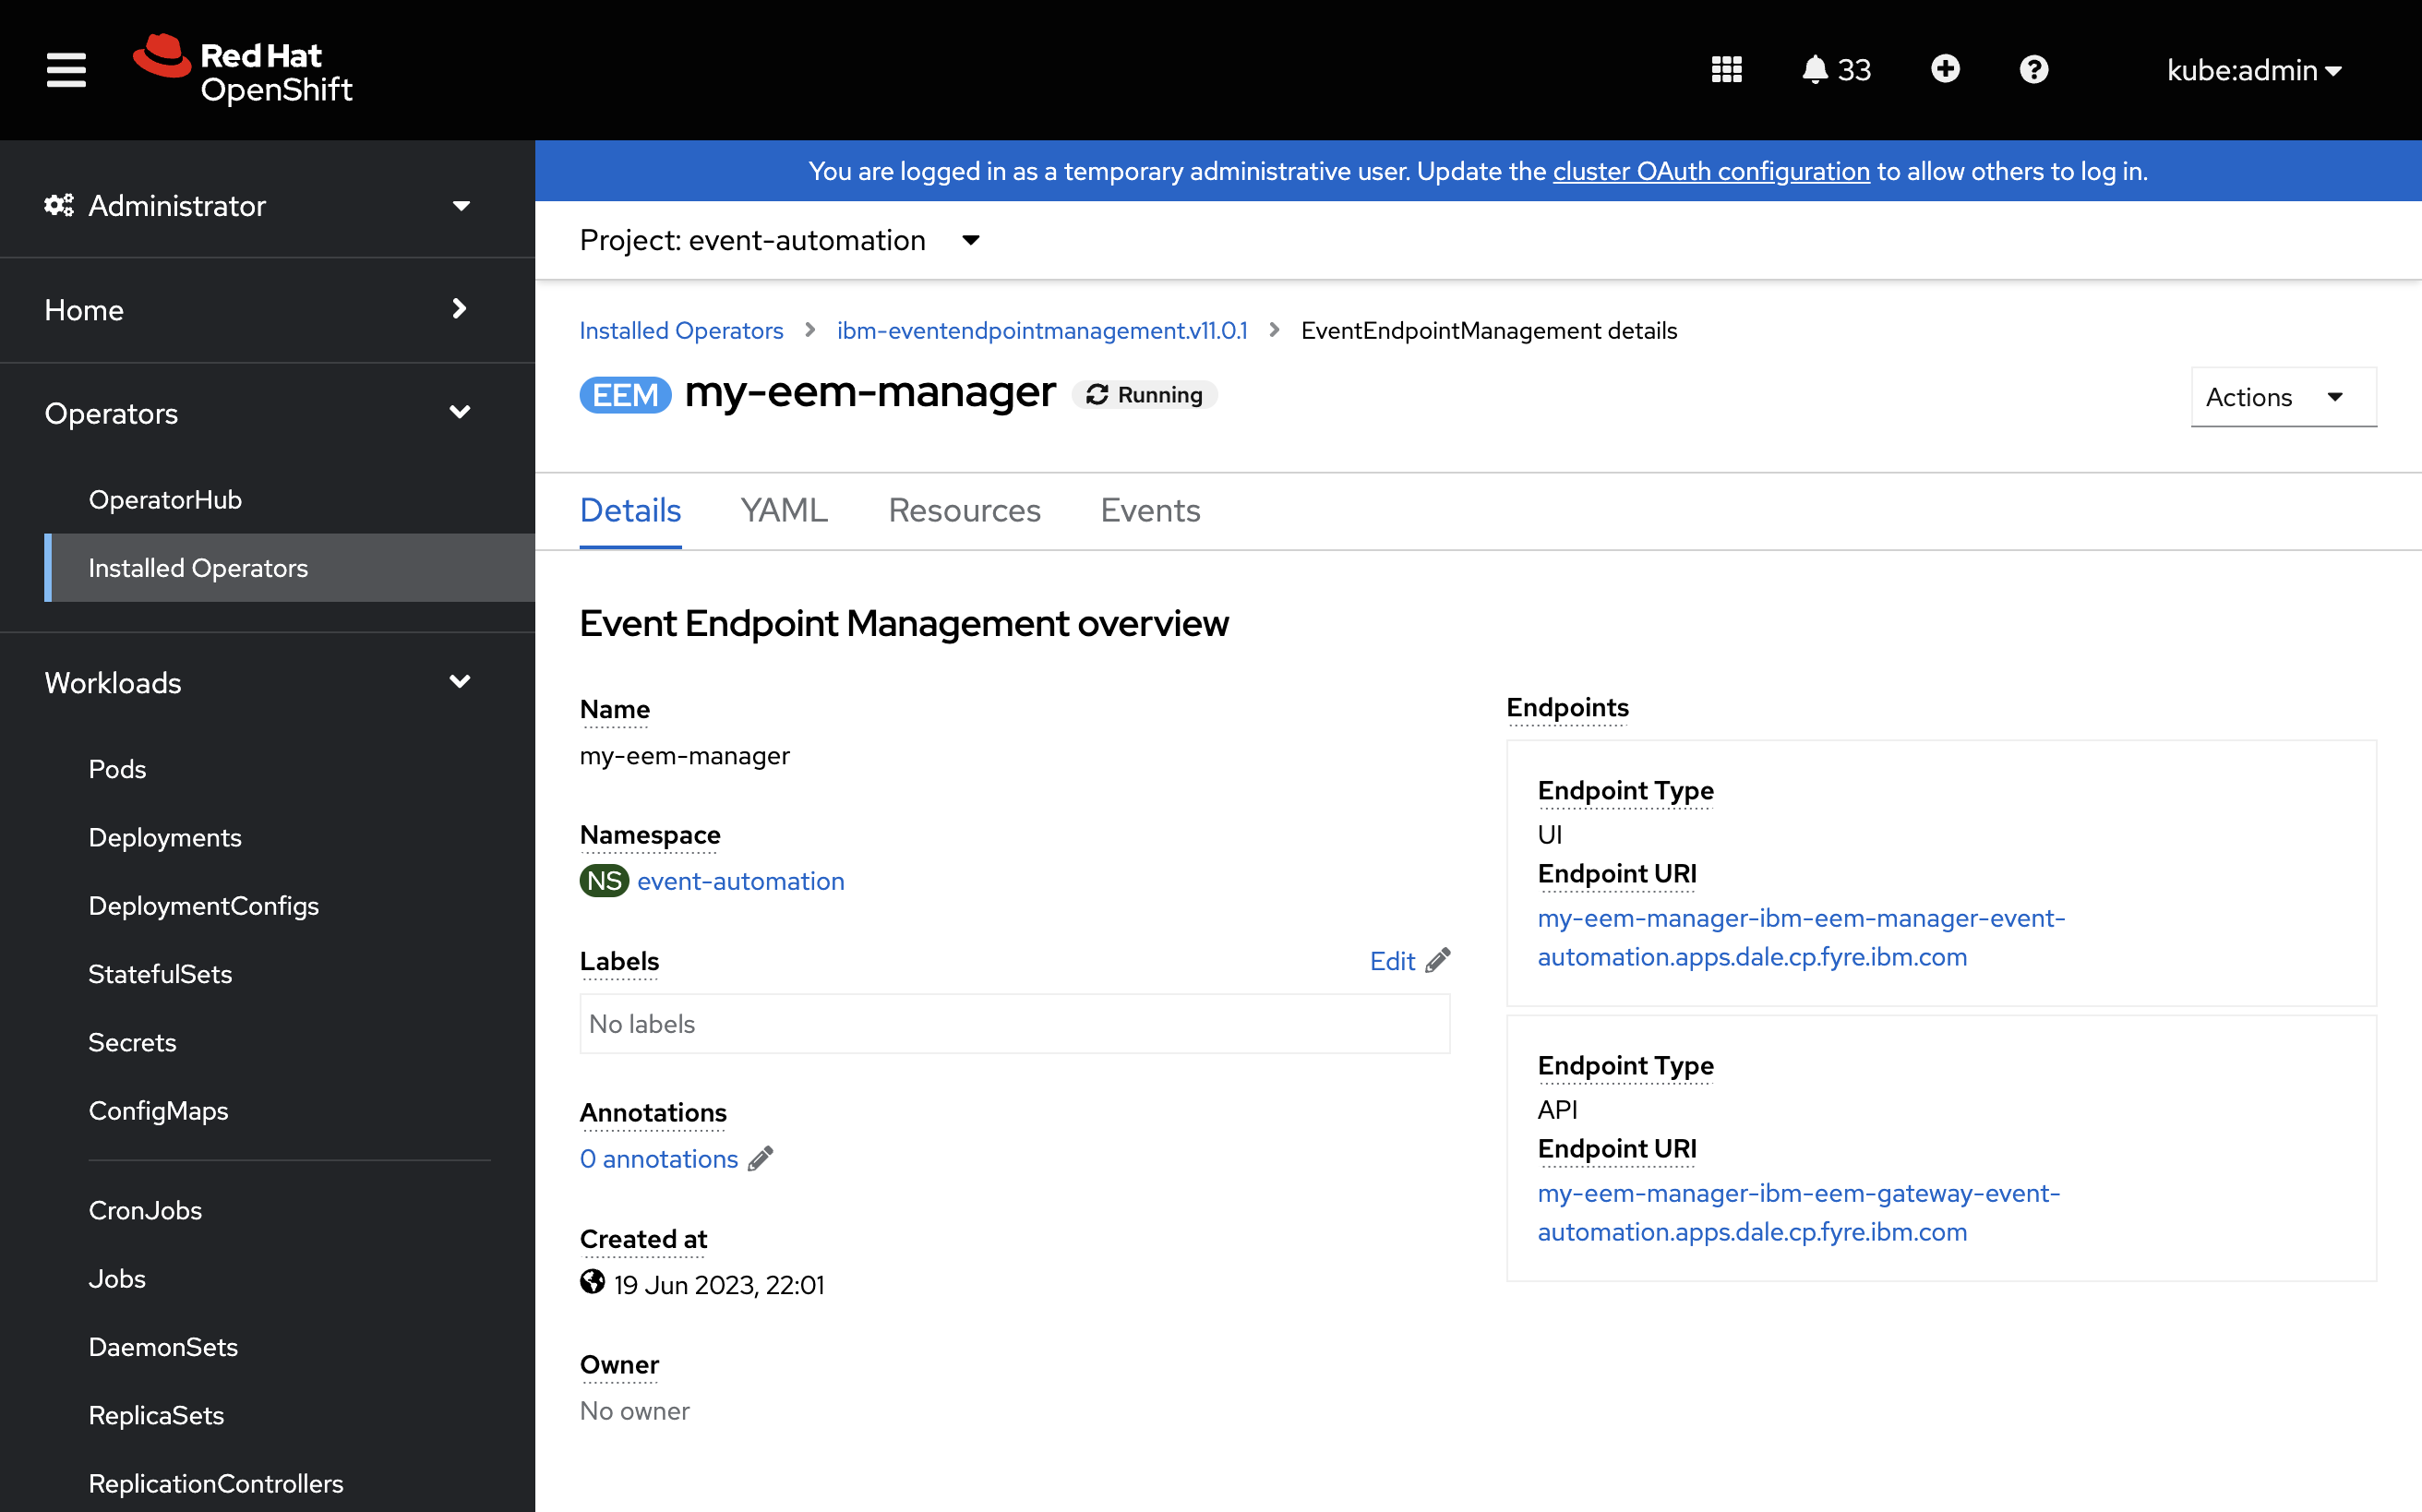
To access the Event Endpoint Management UI, follow these steps to locate the web address in the OpenShift console.
-
From the Administrator view in the OpenShift console, navigate to Operators > Installed Operators.
-
Set the Project to
event-automation. -
Click the IBM Event Endpoint Management Operator.
-
Navigate to the Event Endpoint Management tab, and click the
my-eem-manageritem. -
The web address for the Event Endpoint Management UI is shown as UI Endpoint URI.
Login credentials
To log in to the Event Endpoint Management UI, use the default eem-admin username and follow these steps to retrieve the password from the OpenShift console or by using the CLI.
-
The username for accessing this UI is
eem-admin. -
To find the password for accessing the UI, view the contents of the
user-credentials.jsonvalue of the my-eem-manager-ibm-eem-user-credentials secret in theevent-automationproject.
Alternatively, you can retrieve the Event Endpoint Management UI URL and the password by using the oc CLI:
# URL
oc get route \
    my-eem-manager-ibm-eem-manager \
    -n event-automation \
    -o jsonpath='https://{.spec.host}'

# password for 'eem-admin' user
oc get secret \
    my-eem-manager-ibm-eem-user-credentials \
    -n event-automation \
    -o jsonpath='{.data.user-credentials\.json}' | base64 -d
Event Processing
URL
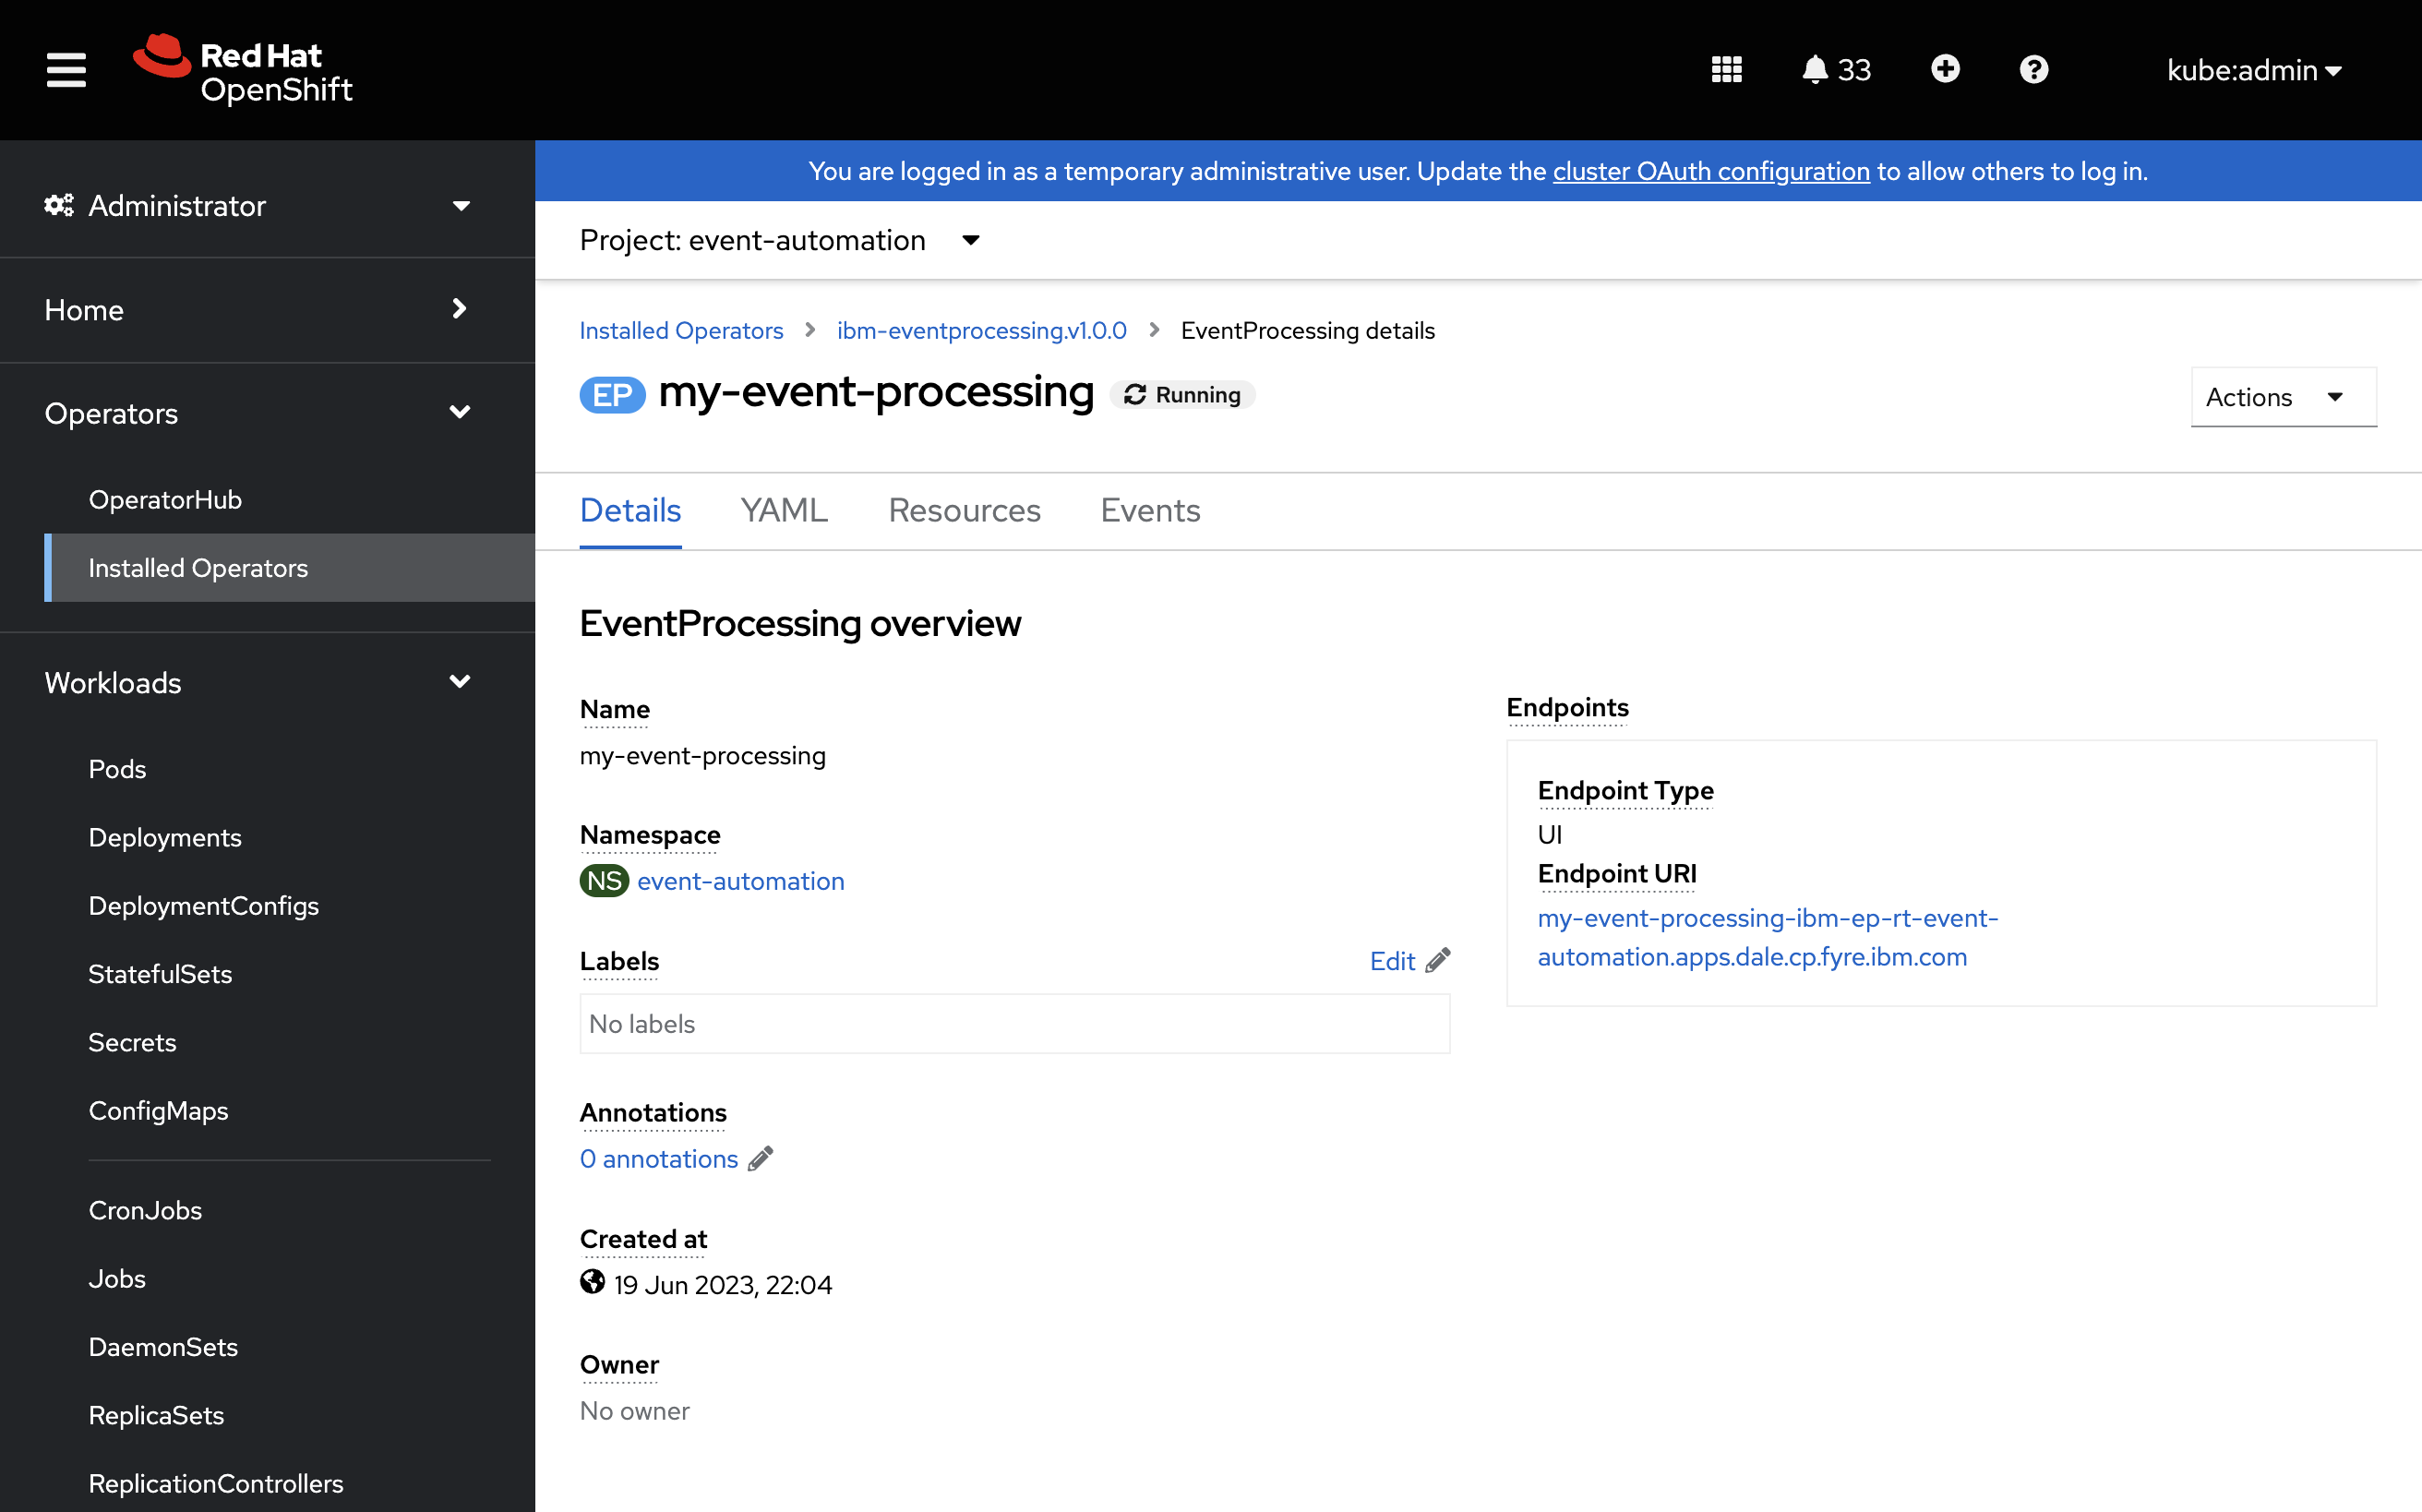
To access the Event Processing UI, follow these steps to locate the web address in the OpenShift console.
-
From the Administrator view in the OpenShift console, navigate to Operators > Installed Operators.
-
Set the Project to
event-automation. -
Click the IBM Event Processing Operator.
-
Navigate to the EventProcessing tab, and click the
my-event-processingitem. -
The web address for the Event Endpoint Management UI is shown as UI Endpoint URI.
Login credentials
To log in to the Event Processing UI, use the default ep-admin username and follow these steps to retrieve the password from the OpenShift console or by using the CLI.
-
The username for accessing this UI is
ep-admin. -
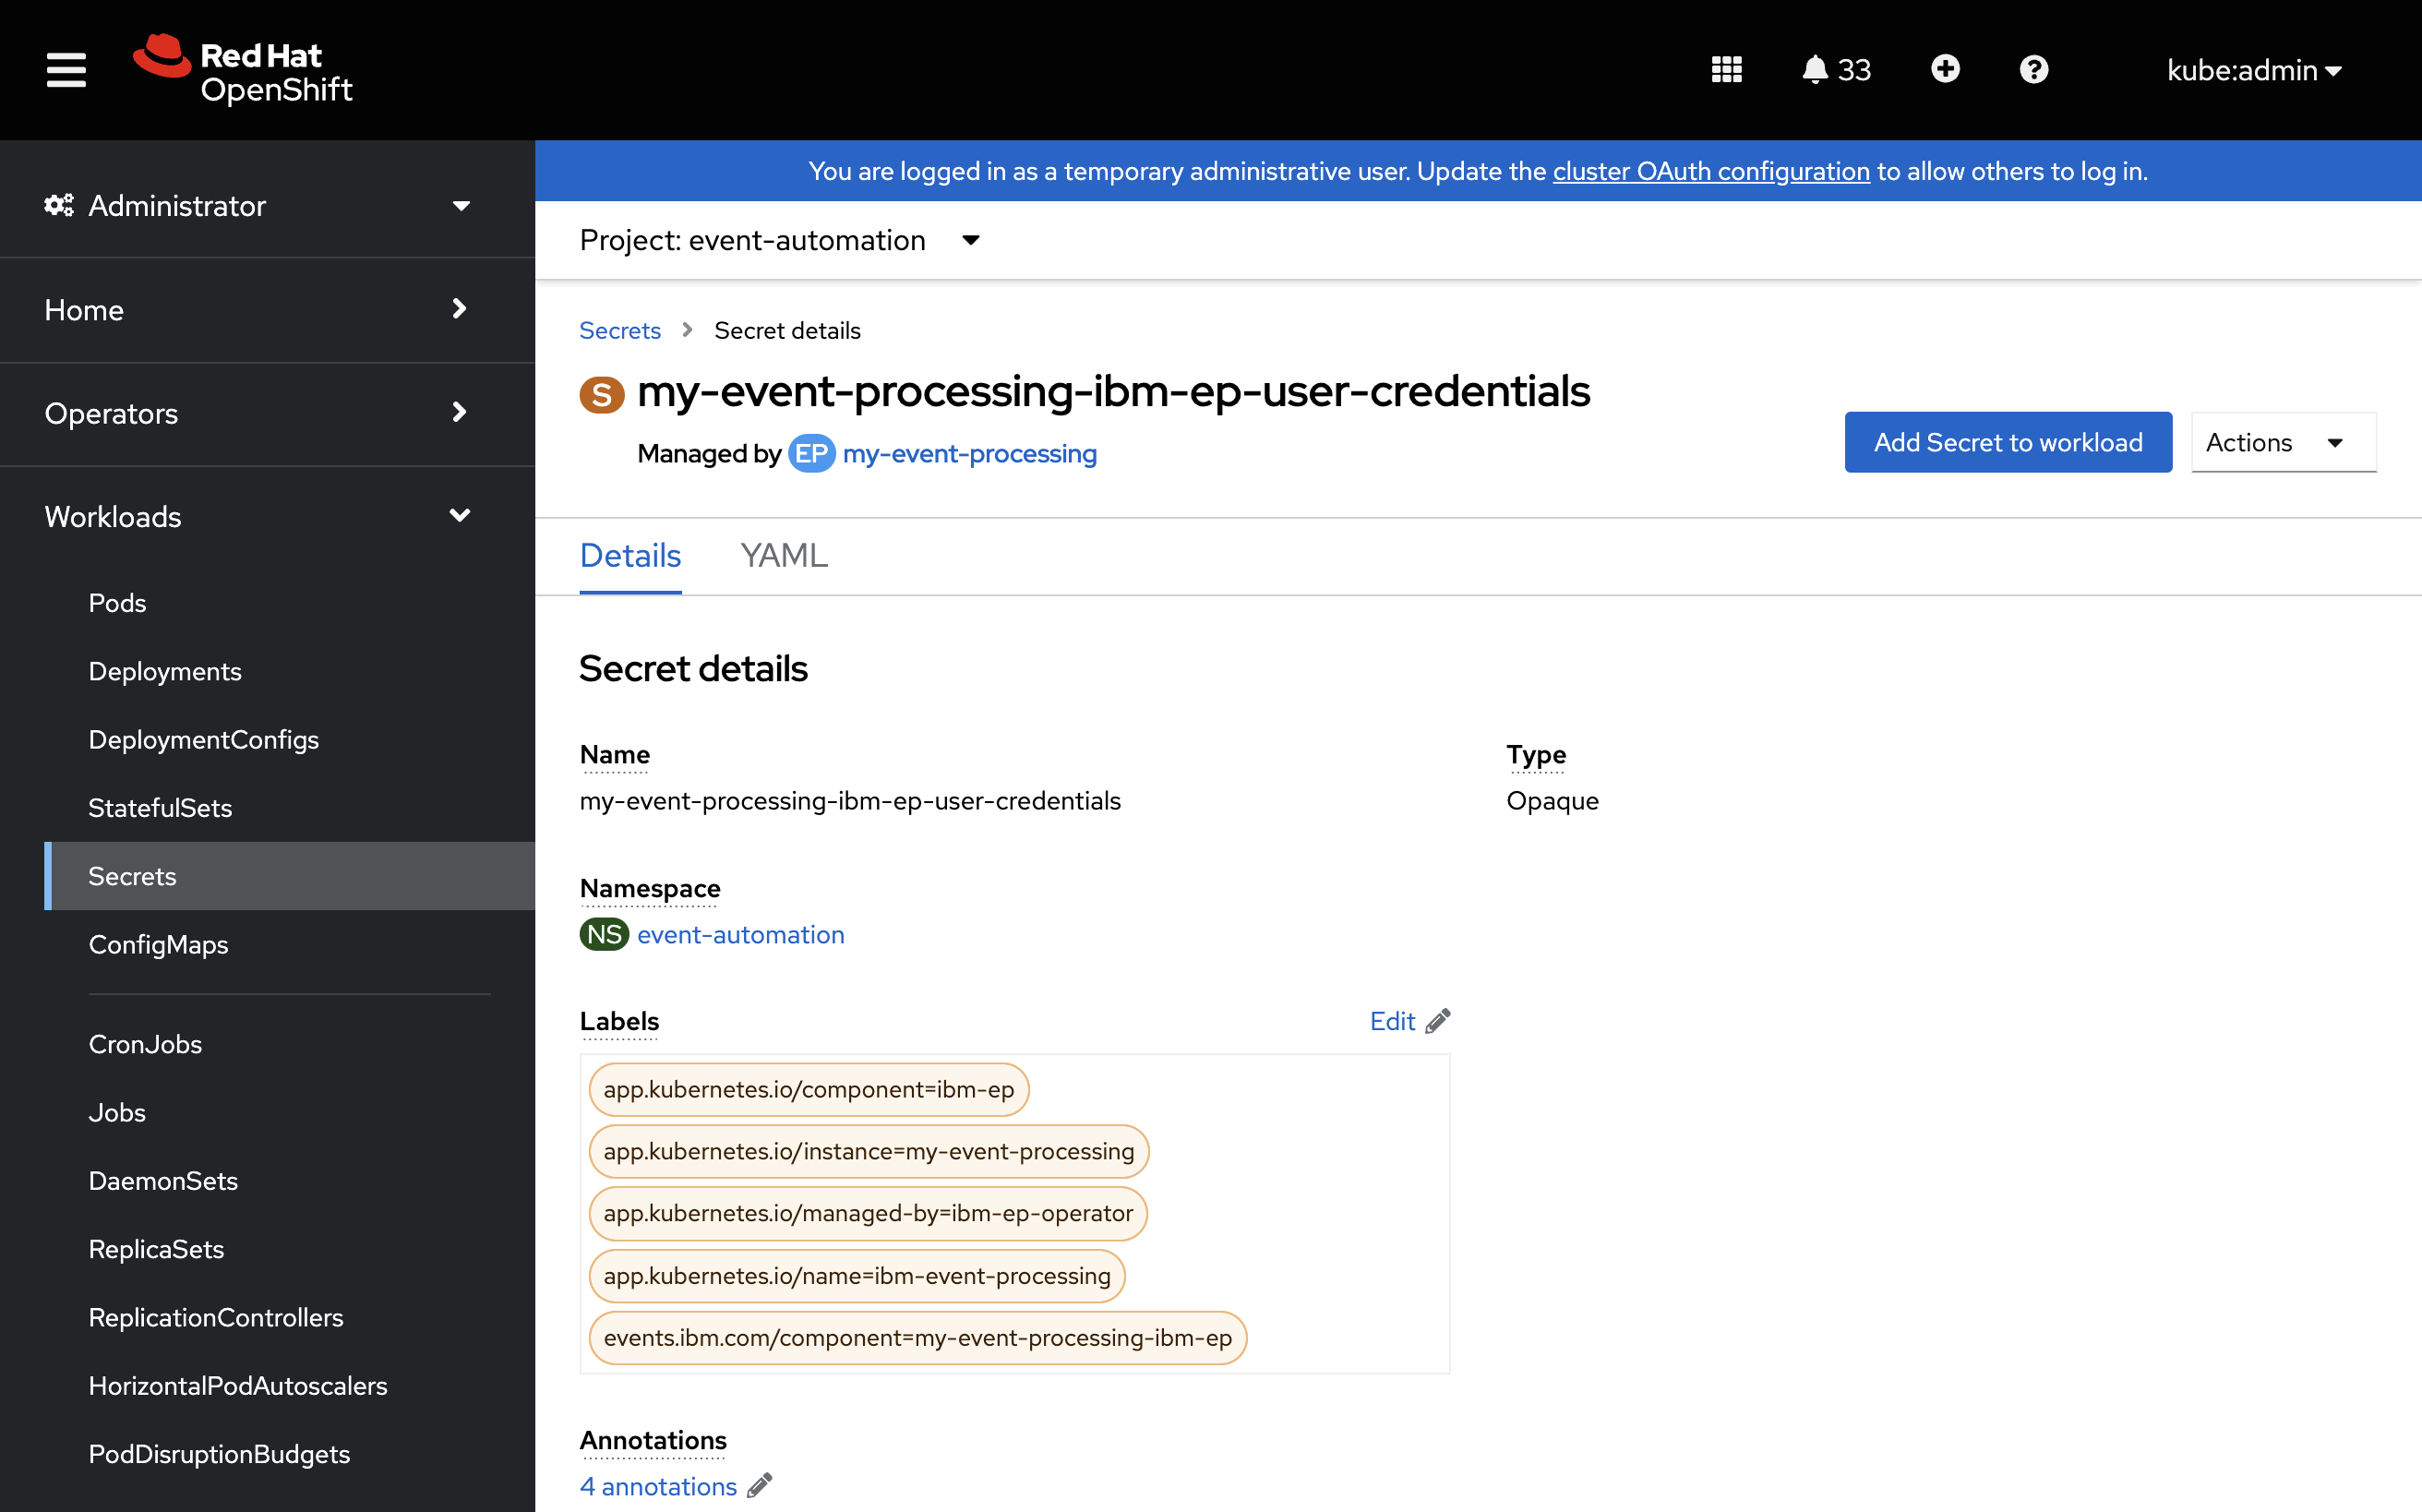
To find the password for accessing the UI, view the contents of the
user-credentials.jsonvalue of the my-event-processing-ibm-ep-user-credentials secret in theevent-automationproject.
Alternatively, you can retrieve the Event Processing UI URL and the password by using the oc CLI:
# URL
oc get route \
    my-event-processing-ibm-ep-rt \
    -n event-automation \
    -o jsonpath='https://{.spec.host}'

# password for 'ep-admin' user
oc get secret \
    my-event-processing-ibm-ep-user-credentials \
    -n event-automation \
    -o jsonpath='{.data.user-credentials\.json}' | base64 -d
Accessing Kafka topics
Some of the tutorials involve configuring a Kafka application. The tutorial playbook automatically sets up credentials that you can use for this.
-
The username for Kafka applications is
kafka-demo-apps. -
To find the password, view the contents of the
passwordvalue of the kafka-demo-apps secret in theevent-automationproject.
Alternatively, you can retrieve the Kafka application password by using the oc CLI:
oc get secret \
    kafka-demo-apps \
    -n event-automation \
    -o jsonpath='{.data.password}' | base64 -d
Accessing PostgreSQL database tables
Some of the tutorials involve enriching Kafka events by using reference data from a PostgreSQL database. An optional tutorial playbook automatically creates this database, and credentials that you can use to access it.
-
The database is called
pgsqldemo. -
The username is
demouser. -
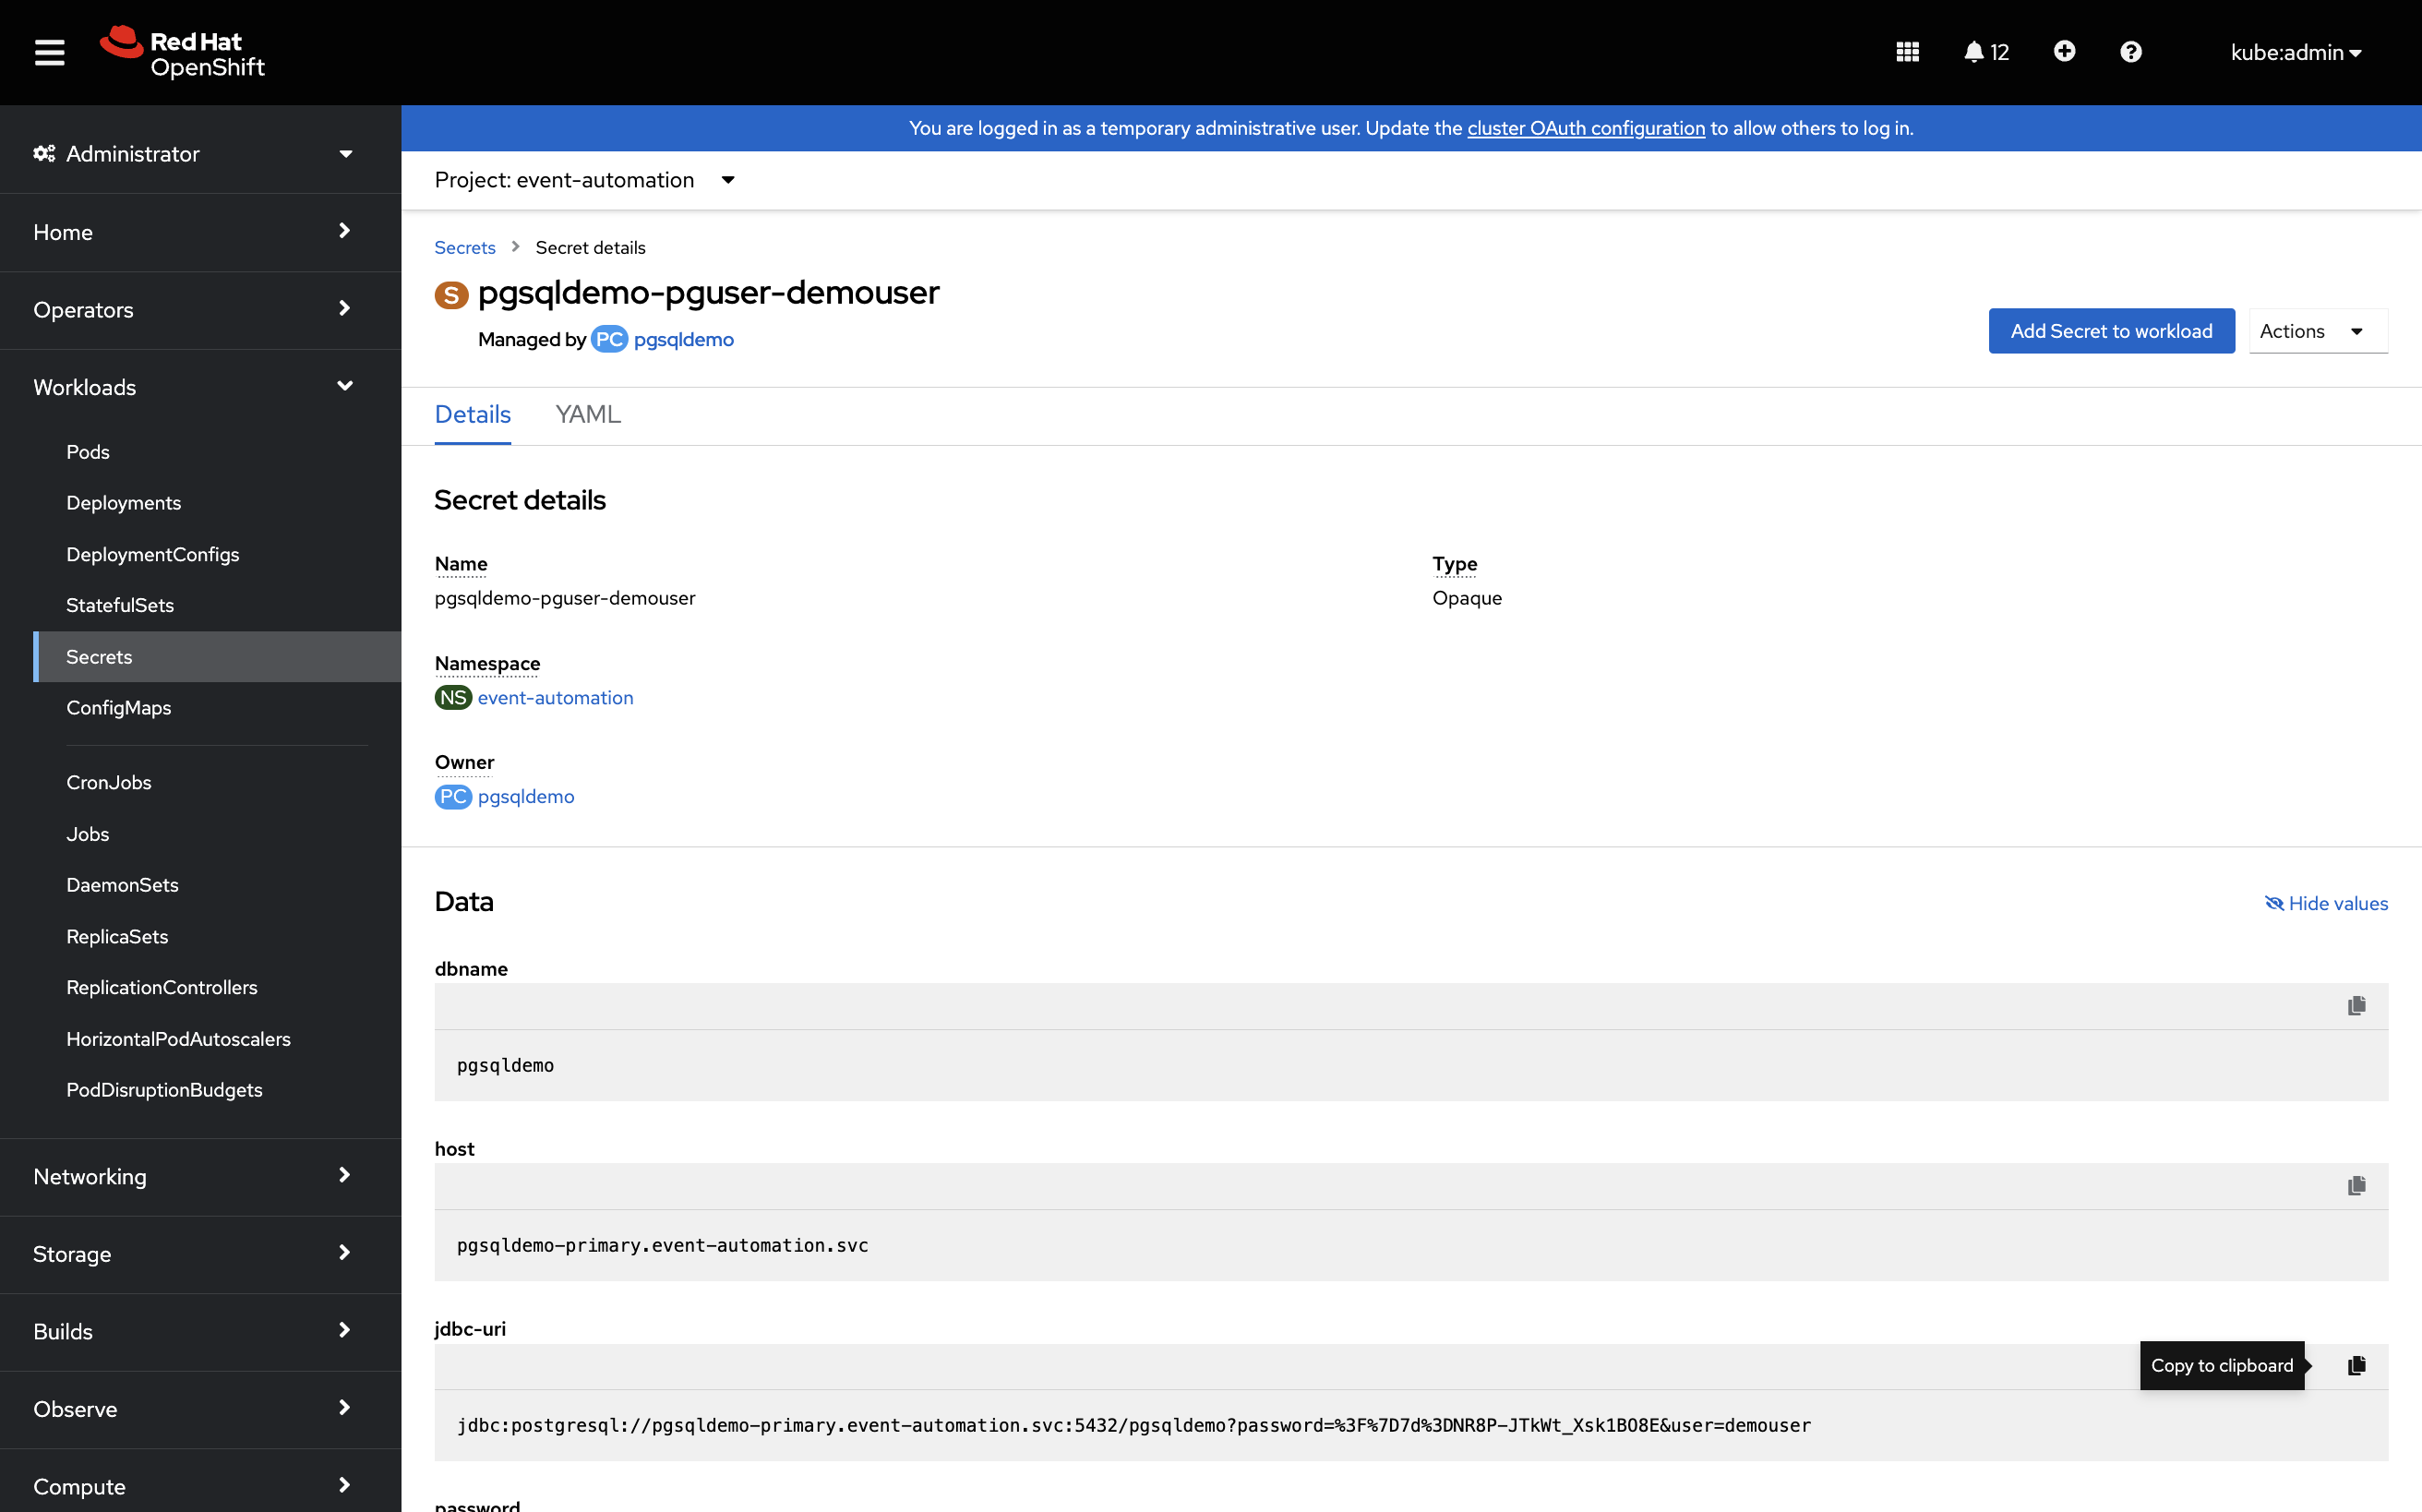
To find the JDBC connection string, copy the contents of the
jdbc-urivalue of the pgsqldemo-pguser-demouser Secret in theevent-automationproject.
Alternatively, you can retrieve the JDBC connection string by using the oc CLI:
oc get secret \
    pgsqldemo-pguser-demouser \
    -n event-automation \
    -o jsonpath='{.data.jdbc\-uri}' | base64 -d
Accessing Grafana dashboards
Some of the tutorials involve using Grafana dashboards to visualize key Event Automation metrics. An optional tutorial playbook automatically creates a Grafana installation, and credentials that you can use to access the dashboard.
URL
Find the OpenShift route that provides access to the Grafana dashboard.
-
From the Administrator view in the OpenShift console, navigate to Networking > Routes.
-
Set the Project to
event-automation. -
Navigate to the event-automation-route route, and click the link in the Location column.
login credentials
Retrieve the password from the OpenShift console.
-
The username for accessing this UI is
admin. -
From the Administrator view in the OpenShift console, navigate to Operators > Installed Operators.
-
Set the Project to
event-automation. -
Click the Grafana Operator.
-
Navigate to the Grafana tab, and click the
event-automationitem. -
Click on the YAML tab.
-
The admin password will be displayed at
spec.config.security.admin_password.
Alternatively, you can retrieve the Grafana dashboard URL and password by using the oc CLI:
# URL
oc get route \
    event-automation-route \
    -n event-automation \
    -o jsonpath='https://{.spec.host}'

# password for 'admin' user
oc get grafana \
    event-automation \
    -n event-automation \
    -o jsonpath='{.spec.config.security.admin_password}'


