6. Topology Applications and Business Criticality
6.1: Business Criticality
The business criticality of a resource provides an indication of how critical to the business that resource is, and therefore how important any related problems might be. You can define the levels of business criticality for your applications, resource groups and resources, and then view a list of them on the Business criticality page.
Lets have a quick overview of Policies as they leverage Business Criticality. Policies are rules that contain multiple condition and action sets. They can be triggered to reduce noise by suppressing alerts, grouping alerts together, automatically promote alerts to incidents, assign runbooks to remediate alerts, etc.
additional information can be found in the product documentation.
Business Criticality plays a major factor in making sure that Policies reflect business priorities in terms of what applications affect business operations the most. Policies can be defined in a way that considers the Business criticality as a factor to take an action such as promoting Alerts to an Incident that IT Ops. personnel can see in the Incident View.
Defining Business Criticality
Now we will define some business criticality values that can then be assigned to an application later in the Lab.
- From the burger menu in the top-left, navigate to: Operate → Resource management.
- In the Resource management page, click on the Settings gear icon in the top-right and select Topology configuration.
![]()
- From the Topology configuration page, in the Business criticality card, select Configure.
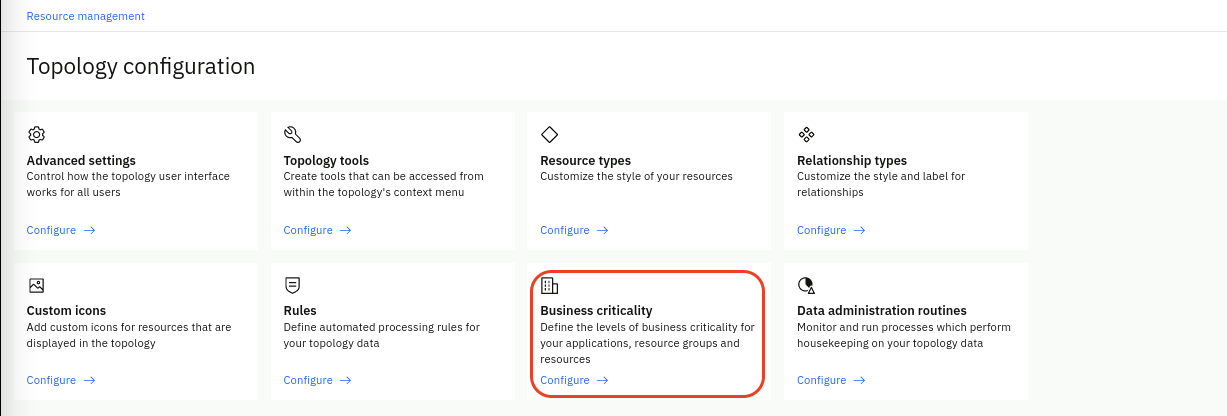
The Business criticality page is displayed listing any existing criticality definitions in a table format by name, description, and criticality value, in sortable columns. For the purpose of the Lab, we will use the predefined criticality values but note that you can custom define these values to better represent your specific IT environment.
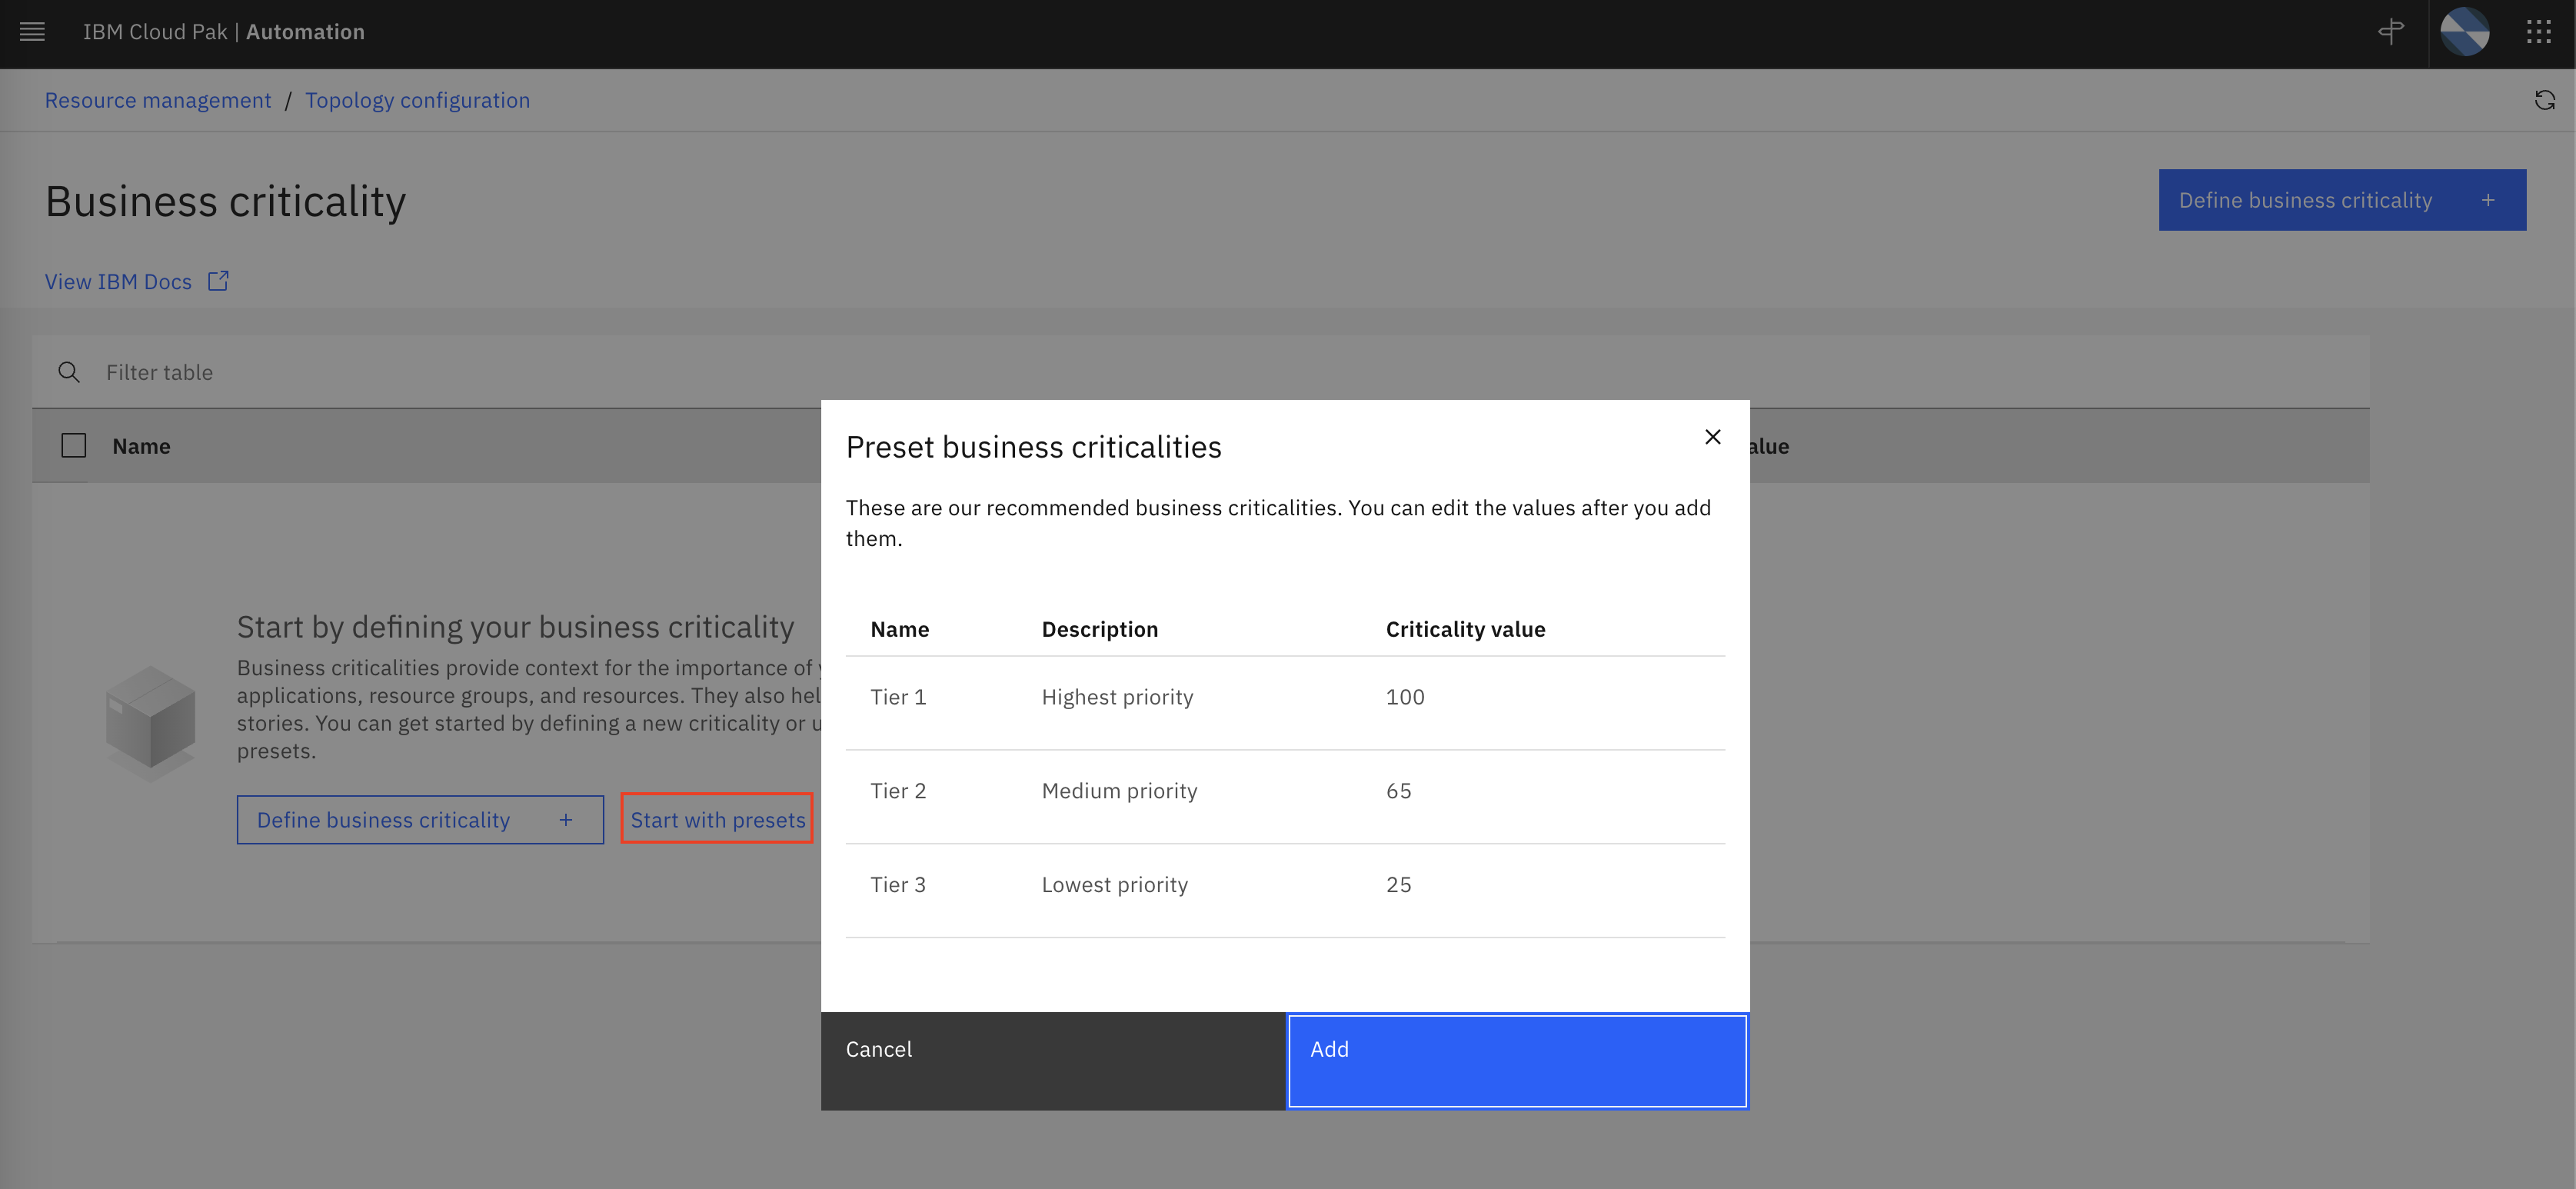
Click on Start with presets, inspect the preset values and click on Add.
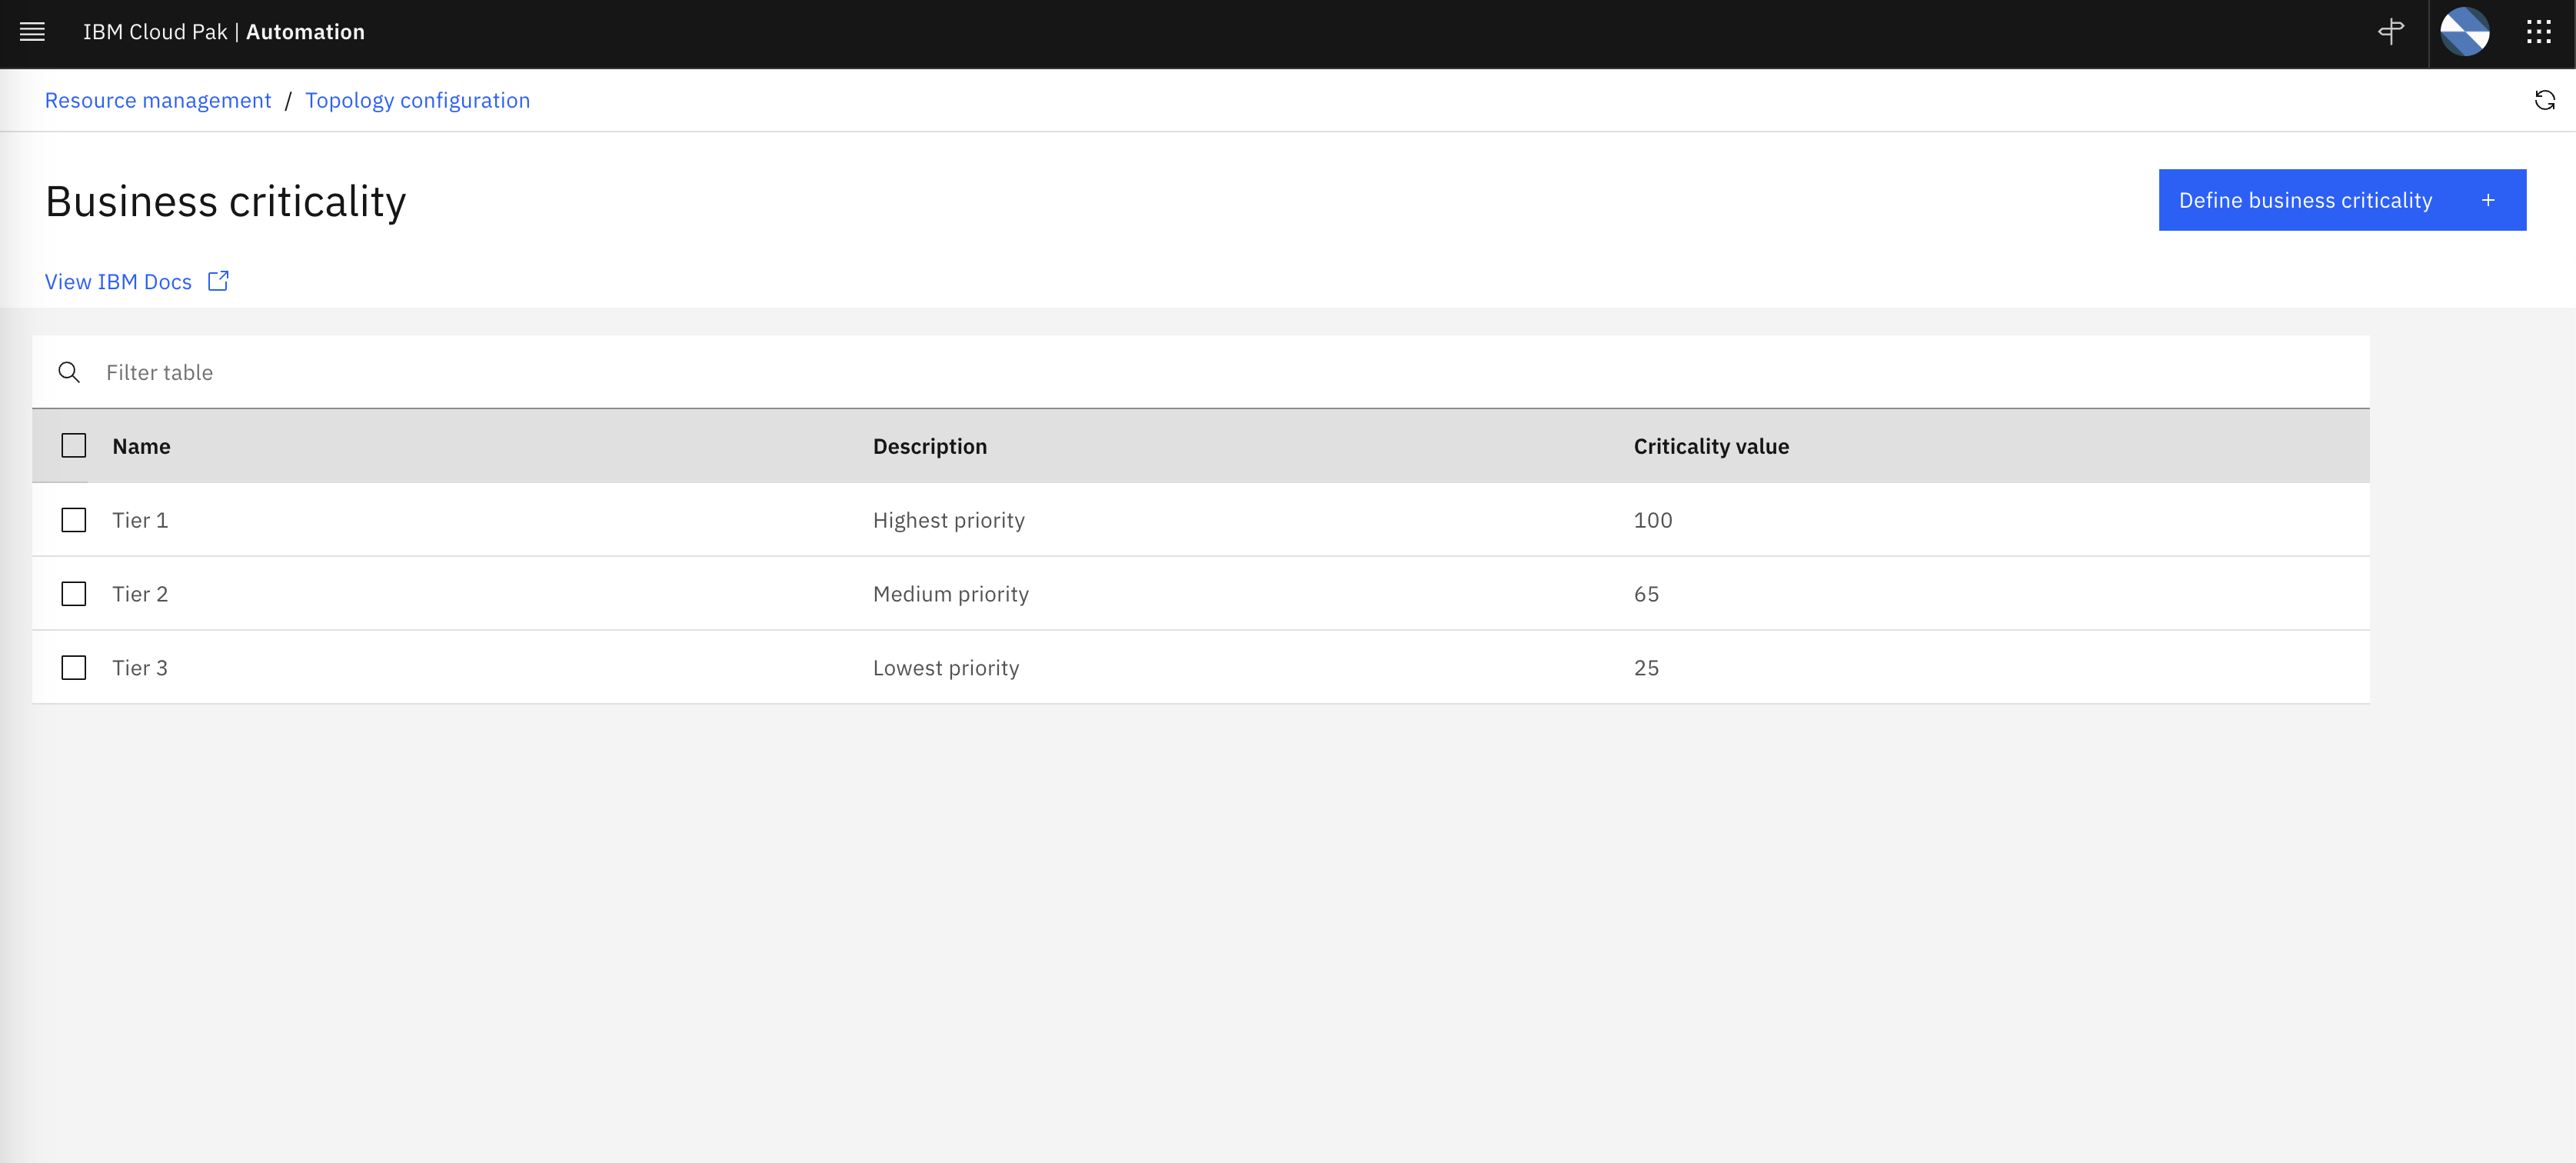
We have now defined three tiers of business criticality as shown below:
6.2: Applications or Services?
Based on customer feedback, starting in v4.1, the Cloud Pak for AIOps provides the option to call a collection of topology groups an Application or a Service. From a product functionality point of view, there is no difference between these two terms. But depending on the customer industry, these two terms represent two different abstractions. In the Telecommunications industry, a Service represents a group of interconnected components such as routers, switches, firewalls, etc. that participate in the operation of voice and data communications. In mostly every other industry, an Application represents a set of IT resources that performs a specific function directly for an end user or, in some cases, for another Application. In this Lab, we are using the term Application.
In summary, an Application, in the context of the Cloud Pak for AIOps, is a collection of topology resource groups that represent a complete IT solution stack. Applications, when combined with resource-level event correlation and grouping mechanisms, provide roll-up incident visibility. In other words, Alerts impacting resources will also surface as impacting the Applications that those resources belong to. This improves overall visibility and allows the prioritization of incident resolution based on the business criticality that has been preassigned to the impacted applications.
Defining Applications
You define and edit applications by adding (or removing) resource groups, icons and tags, assigning business criticality levels, and setting service disruption costs.
Lets define a fictional application based on the existing topology resource groups:
- From the burger menu in the top-left, navigate to: Operate → Resource management.
- In the Resource management page, click the Define application button in the top-right.
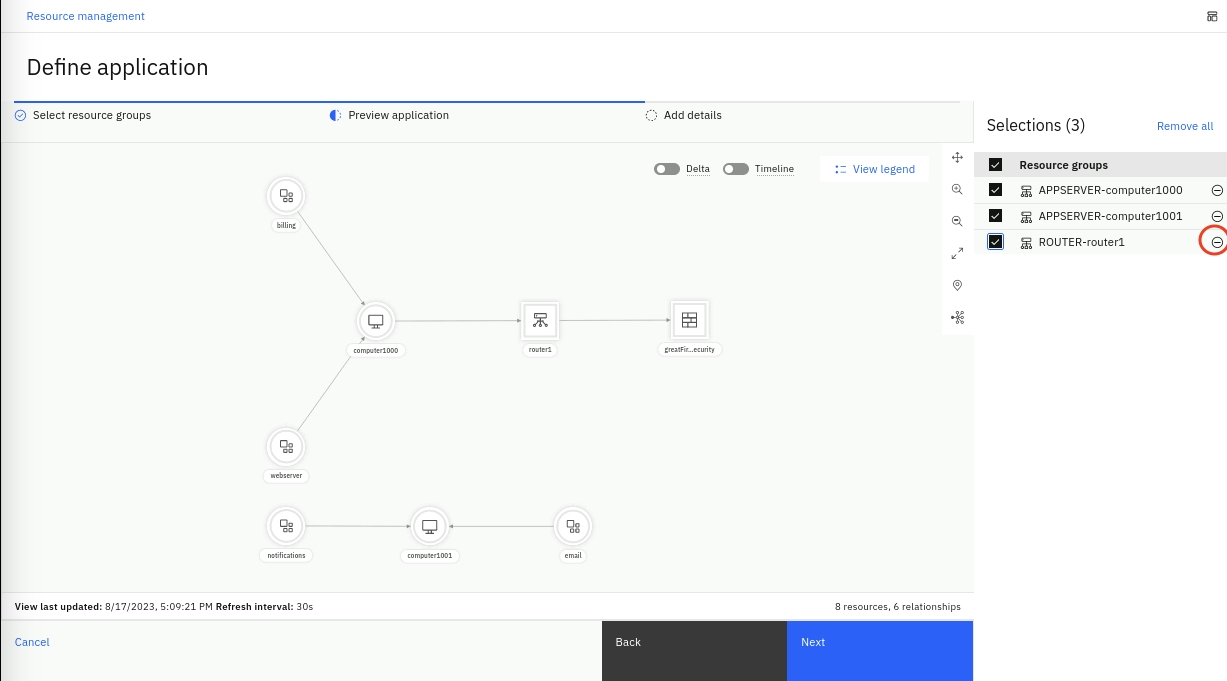
- In the Define application page, we will select a subset of the resource groups defined in previous chapters using Topology Group Templates. These are the resource groups that belong to our fictional application. Lets select APPSERVER-computer1000, APPSERVER-computer1001 and ROUTER-router1 as shown below:
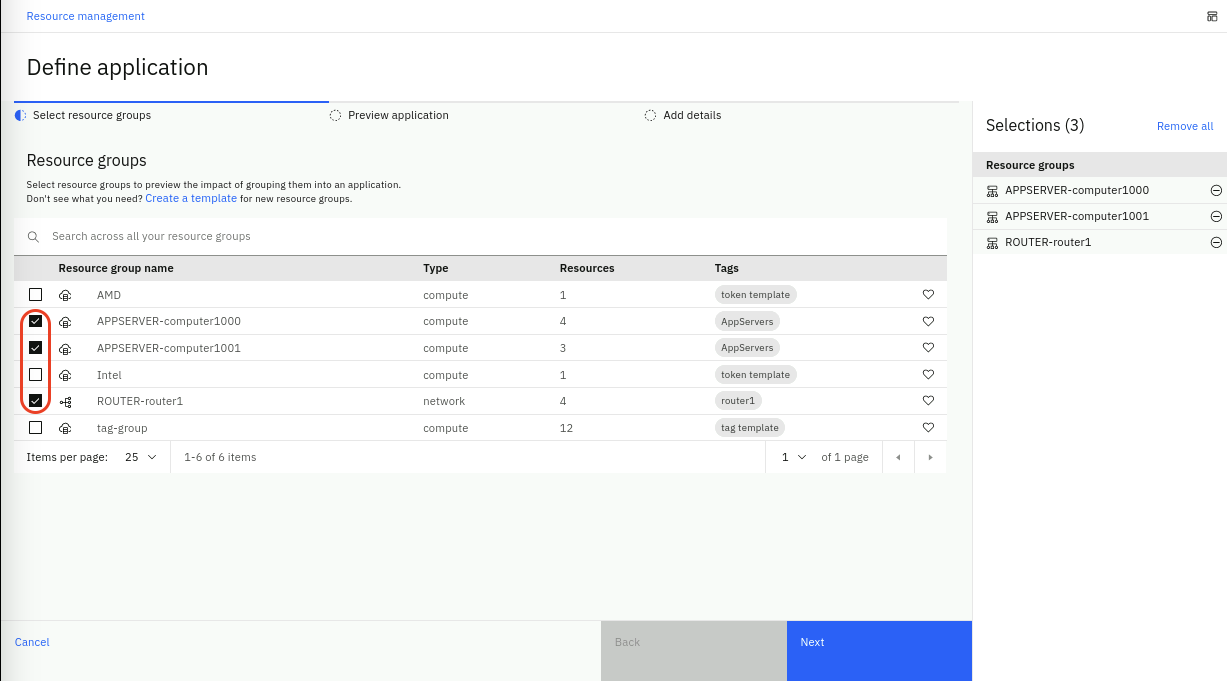
- Click Next to preview the application.
As we preview the application, we can use the checkbox to deselect resource groups on the right sidebar in order to visualize the application without those groups.
- In this preview step, we realize that we don't need the ROUTER-router1 resource group, so click on the (-) minus sign to remove the ROUTER-router1 resource group from this application.
- You should be left with the topology preview as shown below:
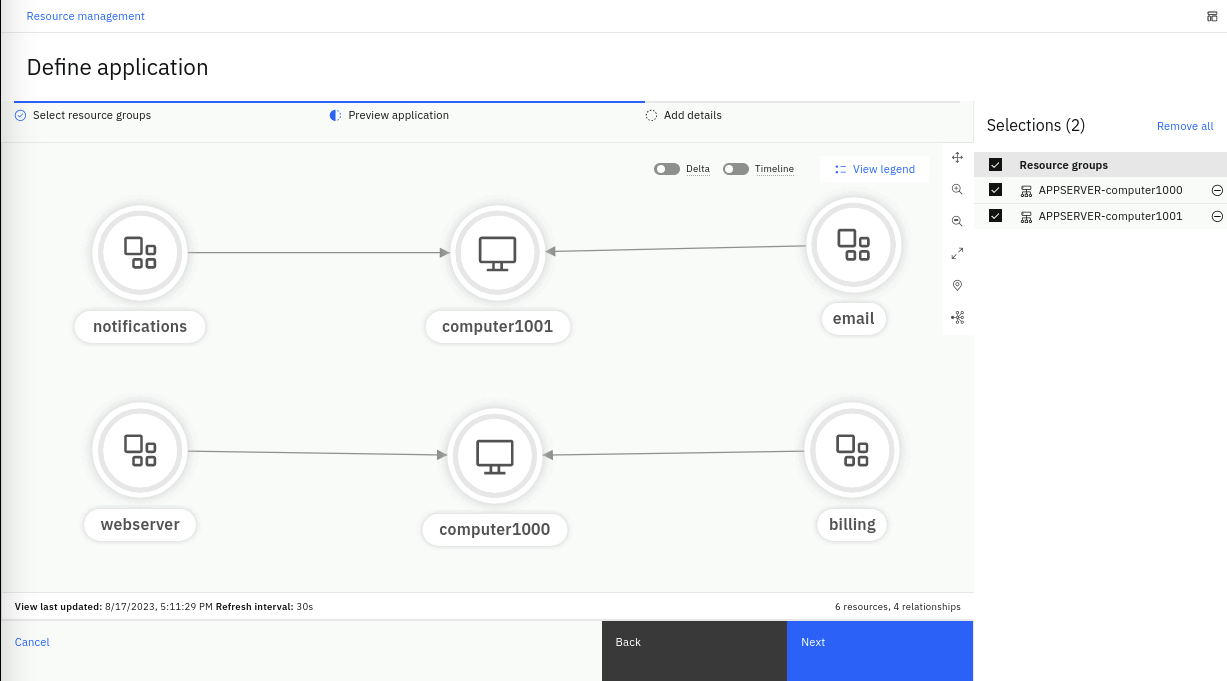
- Click Next to add additional details.
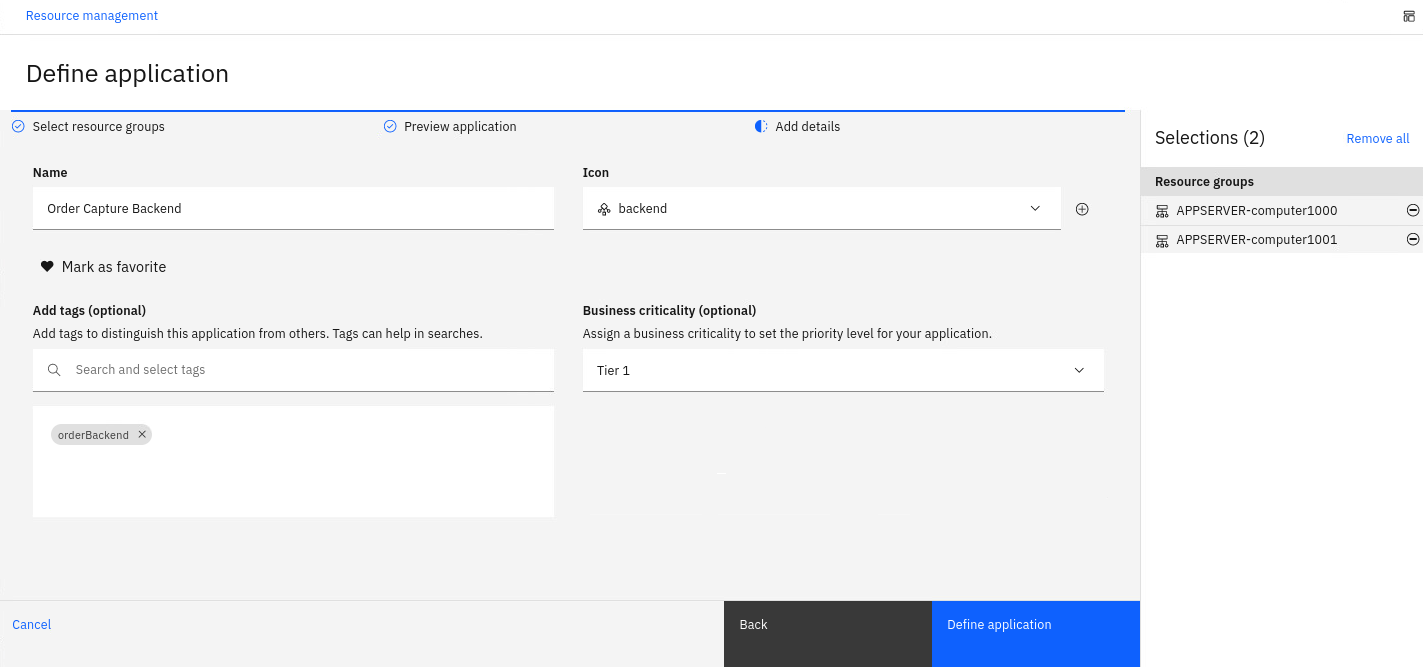
- Enter a Name for the application, for example Order Capture Backend
- Set an Icon for the application, using the drop-down list select the backend icon. This icon is used to identify the application resource type in the topology view of your applications.
- Mark the application as a favorite by clicking on the heart icon.
- In the Add tags field, type orderBackend and select Create new tag. Tags can be used to identify similar applications and to distinguish applications from other applications.
- In the Business criticality field, select Tier 1.
You should see the application details as shown below:
- Click Define application.
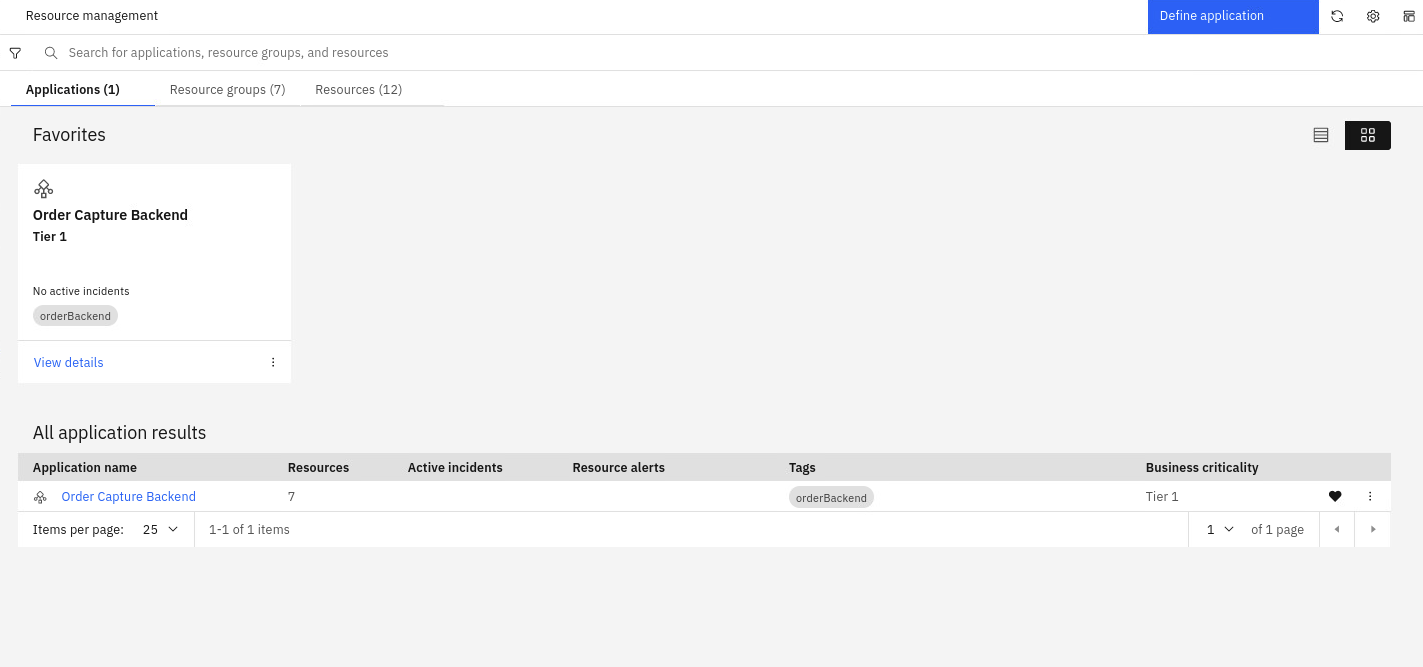
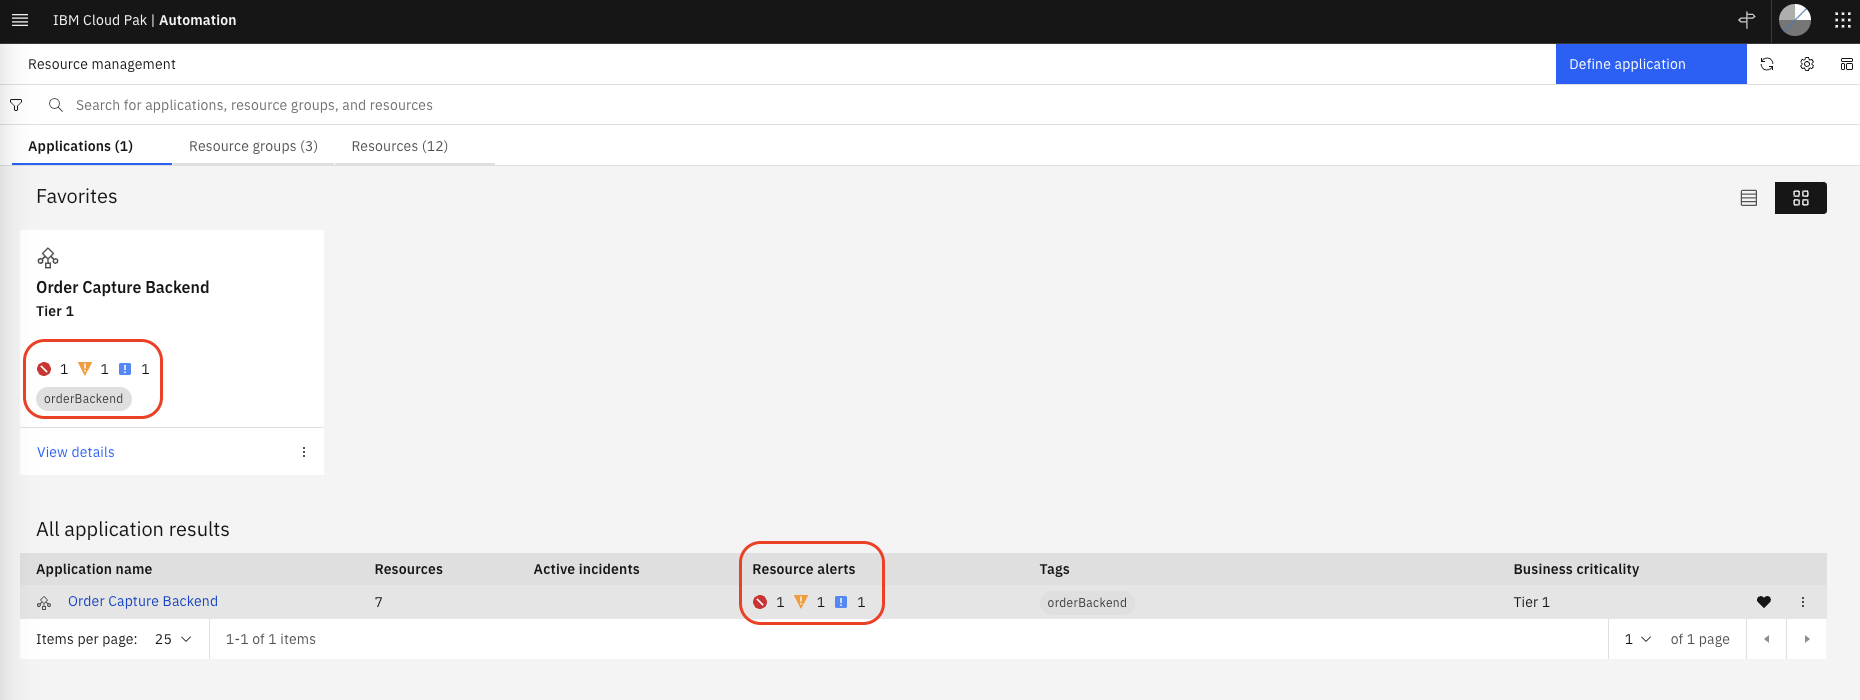
Now the application is added to the list of all applications on the page, as shown below. Note that from this view we can see total number of resources, the active Incidents and Alerts related to the application.
6.3: Alert Topological Correlation
We will see how the topology resource groups we have created are used to correlate alerts. Topological alert grouping helps you understand when alerts are connected based on their topology, providing valuable context information for why related alerts might occur together.
In order to load alerts, we need to create a webhook connection and an event loader script.
Creating a Webhook Connection
The webhook connection allows the Cloud Pak for AIOps to expose an API that can be used to load IT Ops events created by observability tools such as Datadog, Zabbix and others:
- from the burger menu in the top-left navigate to: Define → Integrations
- from the Integrations page click on Add integration
- from the Add integrations page search for webhook, click on the Generic Webhook tile and click Get started.
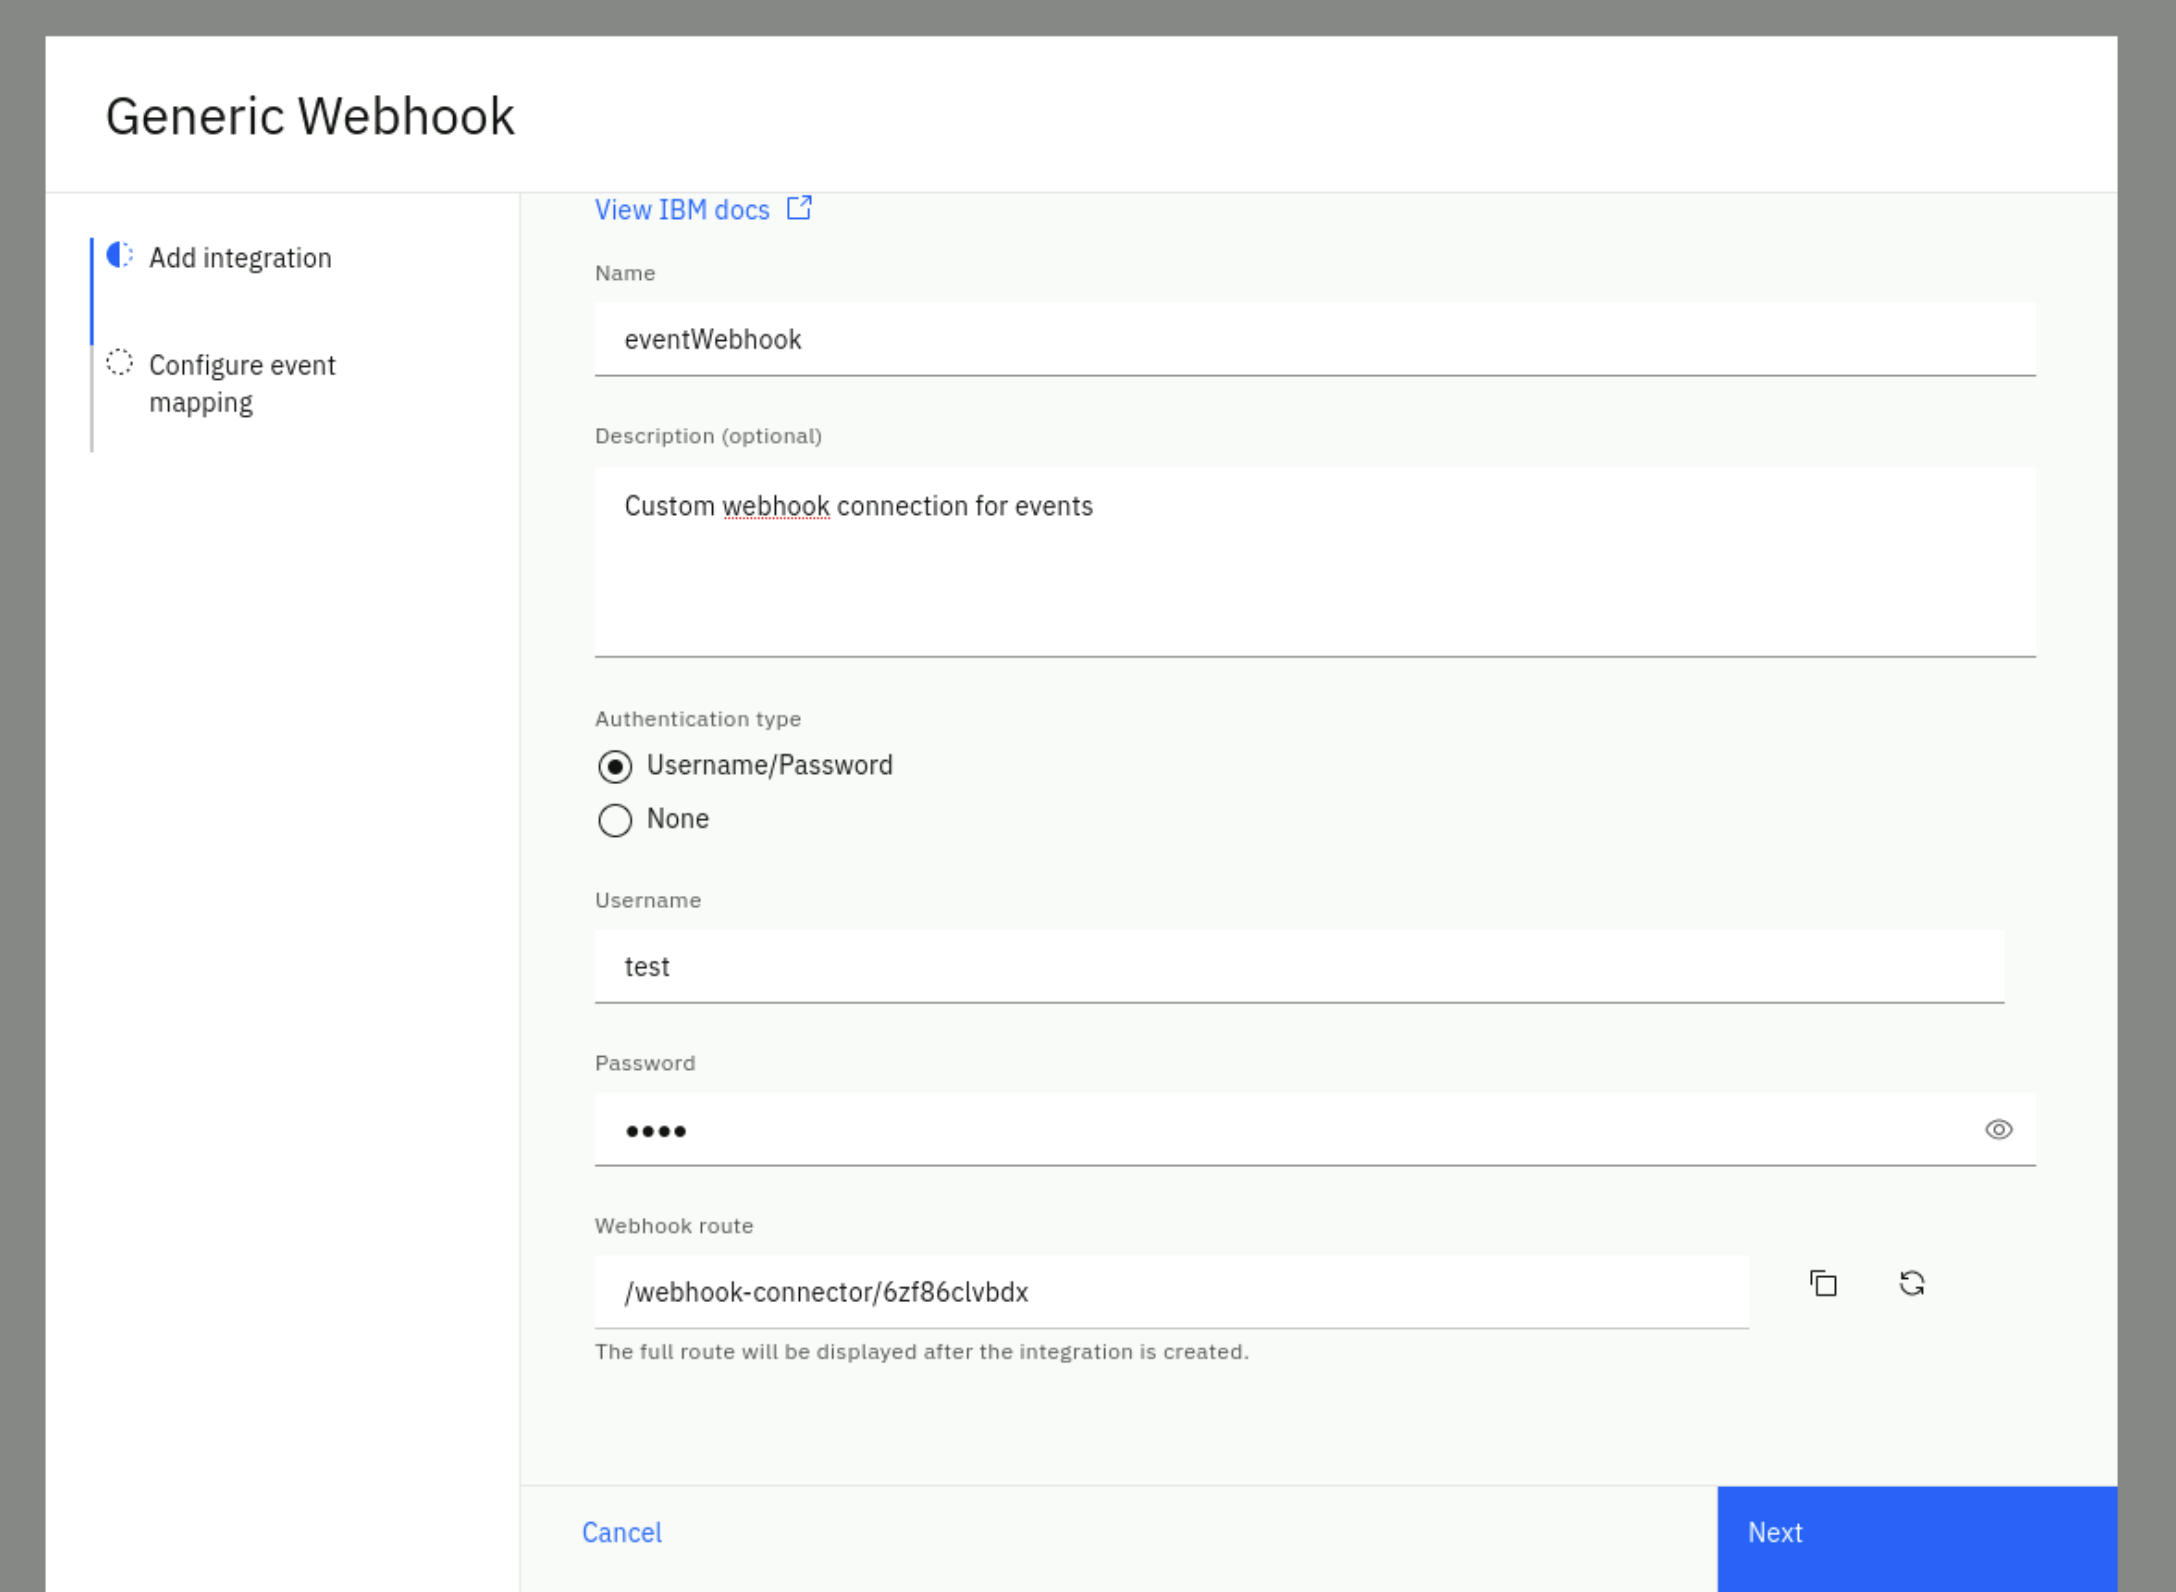
Fill the Add integration form with these values:
- Name: eventWebhook
- Description: custom webhook connection for events
- Authentication type: select Username/Password
- Username: pick a username (e.g. test)
- Password: pick a password (e.g. test)
Your complete form should look like this (note that your route will be different)
Click Next.
In the Configure event mapping form:
- Confirm the Enable webhook slider is green (On)
- The webhook connector leverages JSONata which is a simple expression language to transform JSON data. You can read about JSONata here. In this Lab, we provide the JSON event format as expected by the Cloud Pak for AIOPs, therefore the JSONata is just a "passthrough". In a real scenario, you will find this mapping capability very useful.
Enter the following JSONata configuration (use the copy helper icon (top-right) for one-click copy)
{
   "sender":{
      "service": sender.service,
      "name": sender.name,
      "type": sender.type
   },
   "resource":{
      "application": resource.application,
      "name": resource.name,
      "hostname": resource.hostname,
      "type": resource.type,
      "ipaddress": resource.ipaddress,
      "location": resource.location
   },
   "type":{
      "classification": type.classification,
      "eventType": type.eventType
   },
   "severity": severity,
   "summary": summary,
   "occurrenceTime": occurrenceTime,
   "expirySeconds": expirySeconds
}
Click on Done. You will see a new webhook created as shown below. After the webhook has finished initializing copy the Webhook route URL on the right. You will need this URL in the next step.

Creating a Webhook Event Loader Script
We will create a simple bash script that reads an event file and calls the webhook API with every event in the file as a parameter.
In the same lab folder, create a file called event-load-webhook.sh by running the following command in the Terminal window to open the text editor , copy the bash script below (use the copy helper icon (top-right) for one-click copy), paste it into the text editor.
gedit event-load-webhook.sh
#!/bin/bash
# this is the event-load-webhook.sh script

# Check if a file is provided as a parameter
if [ $# -eq 0 ]; then
  echo "Please provide an event file as a parameter."
  exit 1
fi

###########################################
WEBHOOK_URL='<insert the webhook URL here>'
# Note below there is a colon character ':' between the username and password e.g. test:test
AUTH=<insert your chosen user name>:<insert your chosen password>
###########################################


# Read the event file line by line and submit the event via webhook
while IFS= read -r line; do
  curl -X POST -u $AUTH --insecure -H 'Content-Type: application/json' $WEBHOOK_URL -d "$line"
  echo ""
done < "$1"
There are two changes you need to make to the script:
- assign to WEBHOOK_URL the webhook route of the webhook you just created in the previous step
- assign to AUTH the chosen user name and password of the webhook you just created in the previous step e.g. test:test
Click on the Save button in the text editor and close the editor window (click on the X).
Validating Topological Correlation
We will now load a set of sample events. Because these events impact resources we have in one of our topology group (billing, computer1000 and webserver) these events will be correlated.
Create a new file called topology-events.json by running the following command in the Terminal window to open the text editor, copy the event data below, paste it into the text editor, click on the Save button in the text editor and close the editor window (click on the X).
gedit topology-events.json
{ "sender":{ "service":"Zabbix Middleware Monitoring", "name":"US-SOUTH CEA SelfMonitoring @AGG_P", "type":"Zabbix" }, "resource":{ "application":"eCom2 web server", "name":"computer1000", "hostname":"computer1000.company.com", "type":"host", "ipaddress":"10.1.96.24", "location":"US-SOUTH" }, "type":{ "classification":"System status", "eventType":"problem" }, "severity":3, "summary":"CPU at 80% utilization", "occurrenceTime":"2023-05-05T14:40:38.000Z", "expirySeconds":0 }
{ "sender":{ "service":"Zabbix Middleware Monitoring", "name":"US-SOUTH CEA SelfMonitoring @AGG_P", "type":"Zabbix" }, "resource":{ "application":"eCom2 api layer", "name":"billing", "hostname":"", "type":"device", "ipaddress":"10.1.96.28", "location":"US-SOUTH" }, "type":{ "classification":"System status", "eventType":"problem" }, "severity":5, "summary":"Unscheduled device restart. Review log files", "occurrenceTime":"2023-05-05T14:45:20.000Z", "expirySeconds":0 }
{ "sender":{ "service":"Zabbix Middleware Monitoring", "name":"US-SOUTH CEA SelfMonitoring @AGG_P", "type":"Zabbix" }, "resource":{ "application":"eCom2 security layer", "name":"webserver", "hostname":"", "type":"device", "ipaddress":"10.1.96.29", "location":"US-SOUTH" }, "type":{ "classification":"System status", "eventType":"problem" }, "severity":6, "summary":"Unable to load firewall rules after reboot", "occurrenceTime":"2023-05-05T14:46:10.000Z", "expirySeconds":0 }
Now lets submit the events via the webhook event loader script created in the previous section by running the following command from the Terminal window:
bash event-load-webhook.sh topology-events.json
First, lets see how the Application we have defined shows these events:
- From the burger menu in the top-left navigate to: Operate → Resource Management and click on the Applications tab
Note that the events impacting the resources, have rolled-up into the impacted Application that contains these resources, as shown below
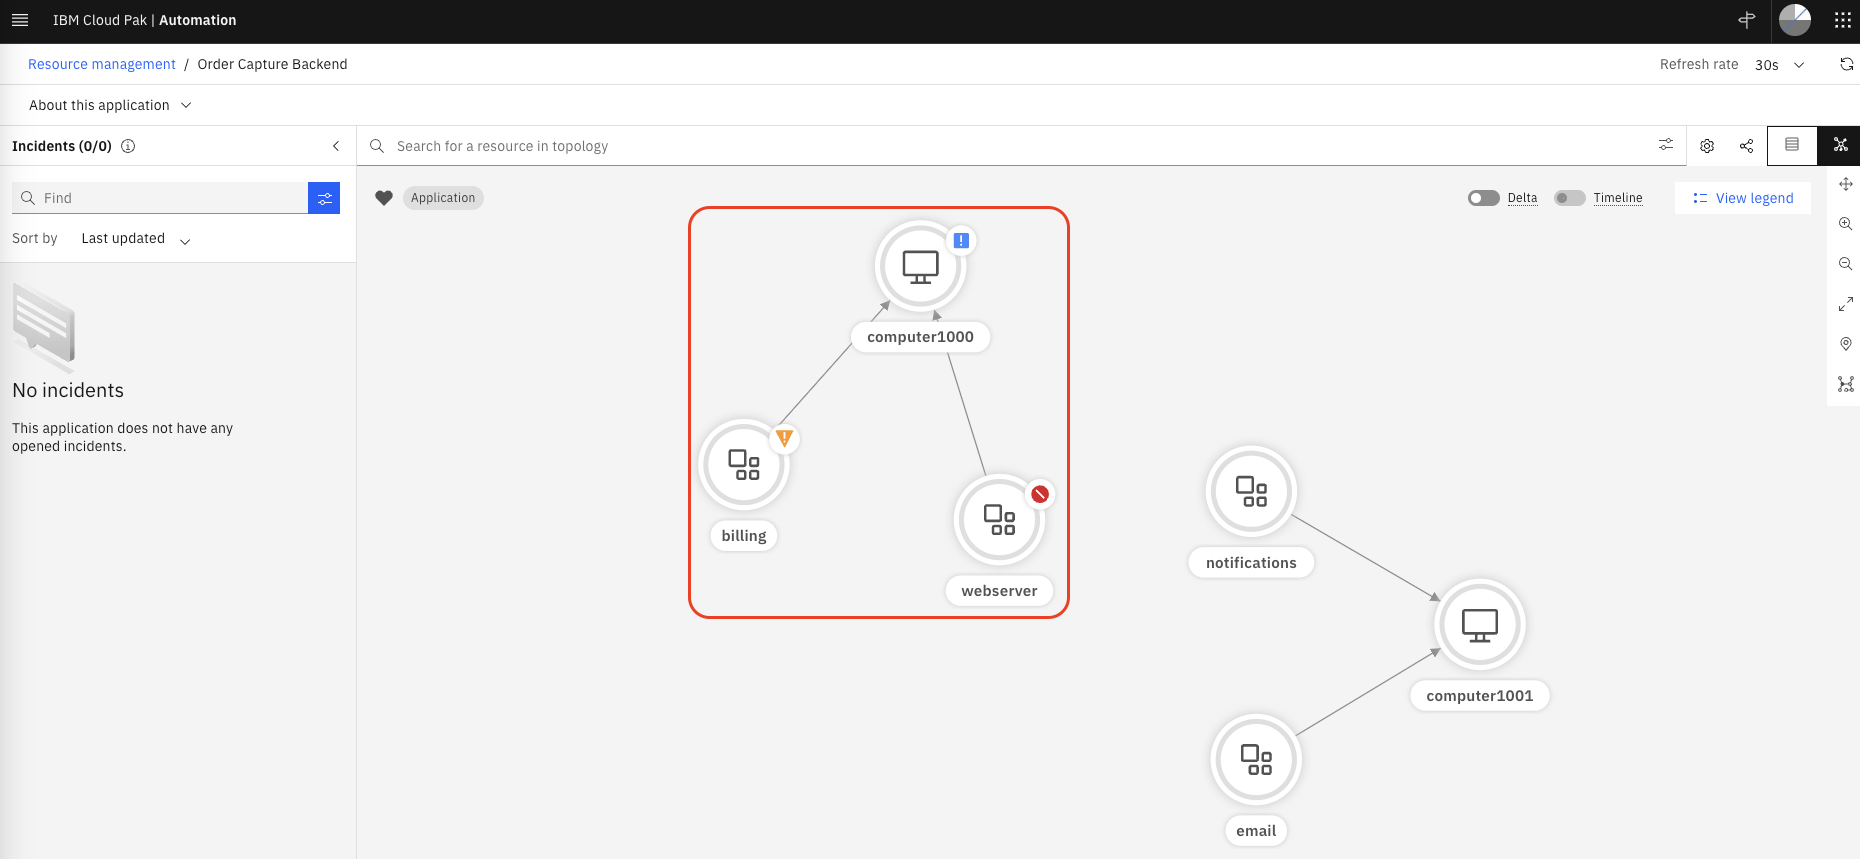
Click on the Application name (Order Capture Backend) to see the topology resources impacted
Finally, lets see how these events are correlated:
- From the burger menu in the top-left navigate to: Operate → Alerts
- Click on the Refresh alerts icon on the right
- Lets add some color to this page:
- Click on the gear icon in the right and select User preferences.
- From the User preferences for alerts pop-up, click on the Row coloring switch to On (green).
- Click on Save.
In the Alerts view, we can see a single group of alerts as shown below.

Click on the chevron icon on the left to expand this group. See how the three events we have submitted have been grouped together. Also click on the View correlation icon in the top-right, the Correlation column on the right, shows the topological group icon.

6.4: Lab Recap
Congratulations if you made it here!. We have seen a lot of features in a short period of time. If there is a single thought that you can take away from this Lab, this is it:
A real-time, unified Topology View is a core capability of the Cloud Pak for AIOps, as it allows to visualize topology changes over time, anomalous alerts in context and the correlation of alerts based on the impacted topology resources. Topology is a key component to achieve fast incident resolution through the Cloud Pak for AIOps.