Administer Instana
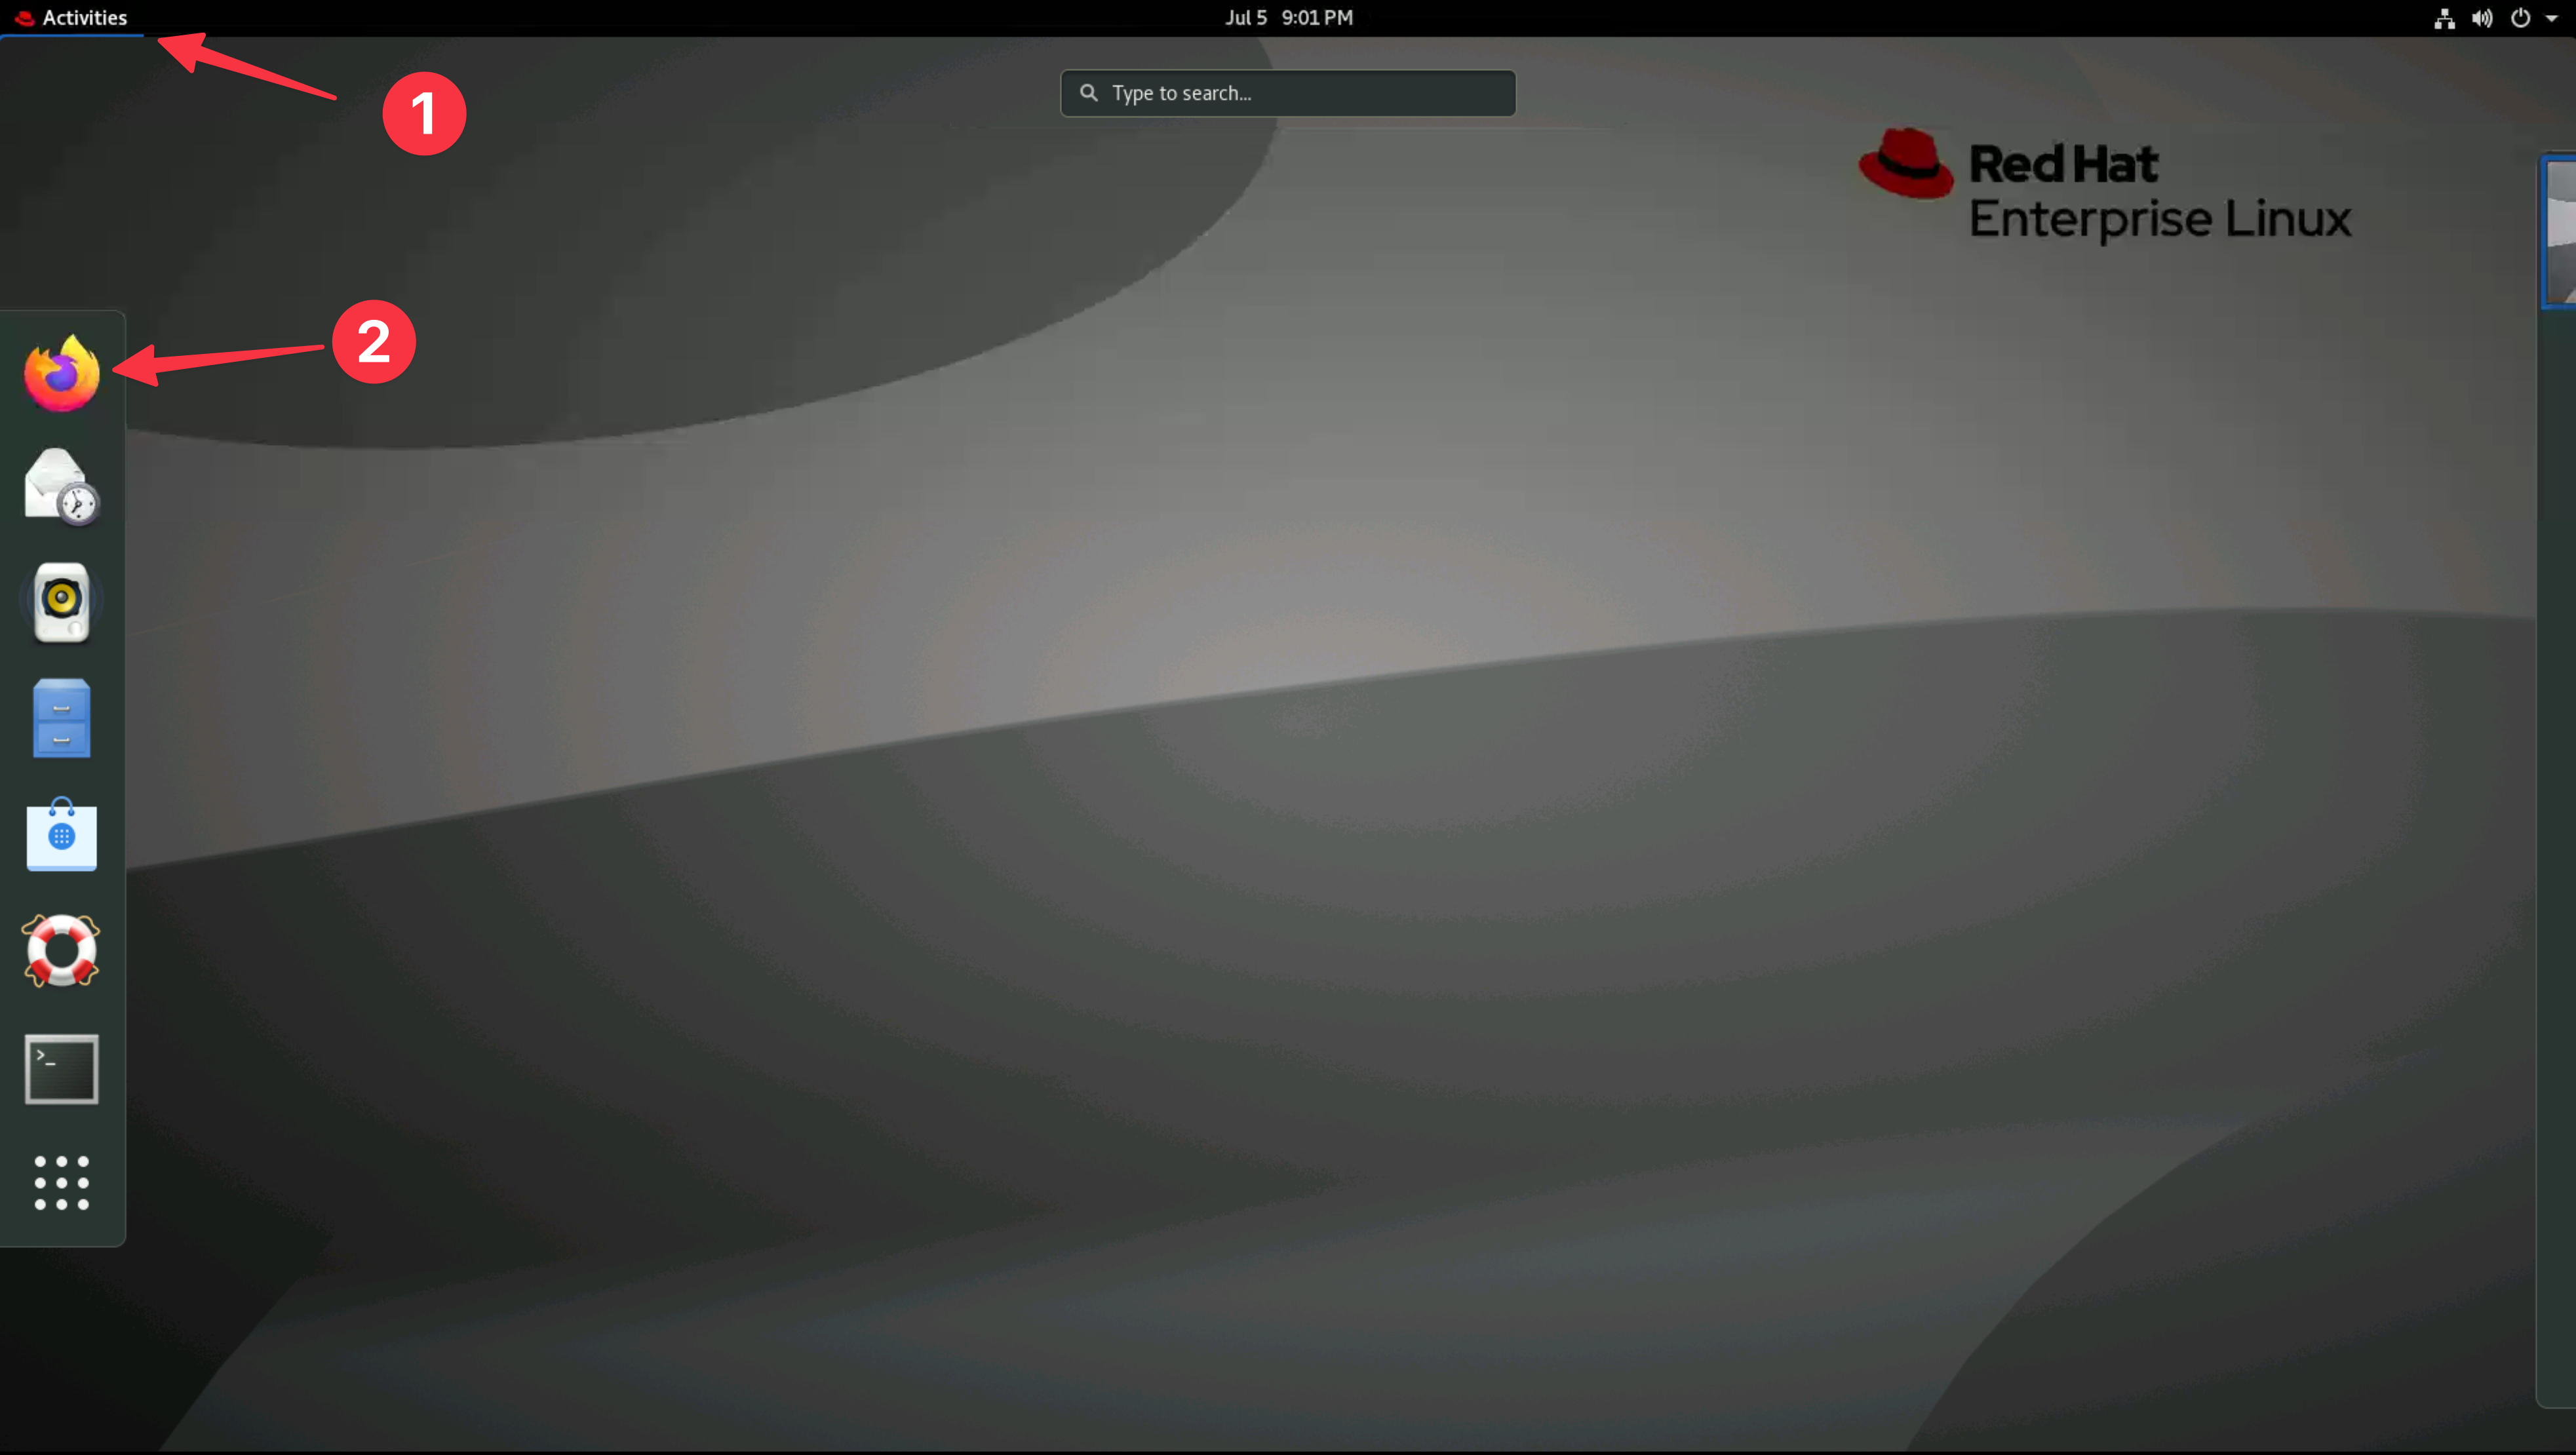
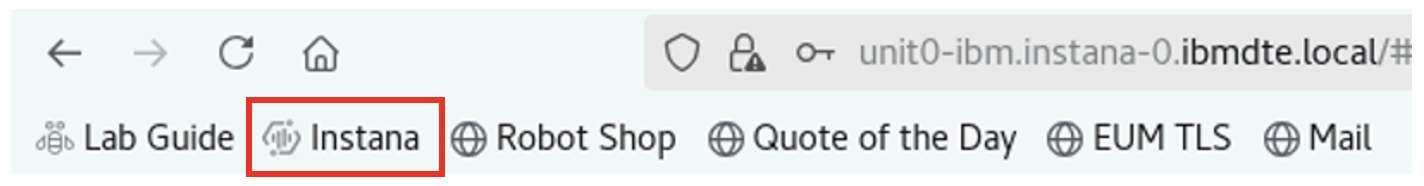
From the Bastion host open the Firefox browser and select the Instana bookmark.
If you are unsure how to get access to the Bastion host (Guacamole) see Accessing a Lab Environment
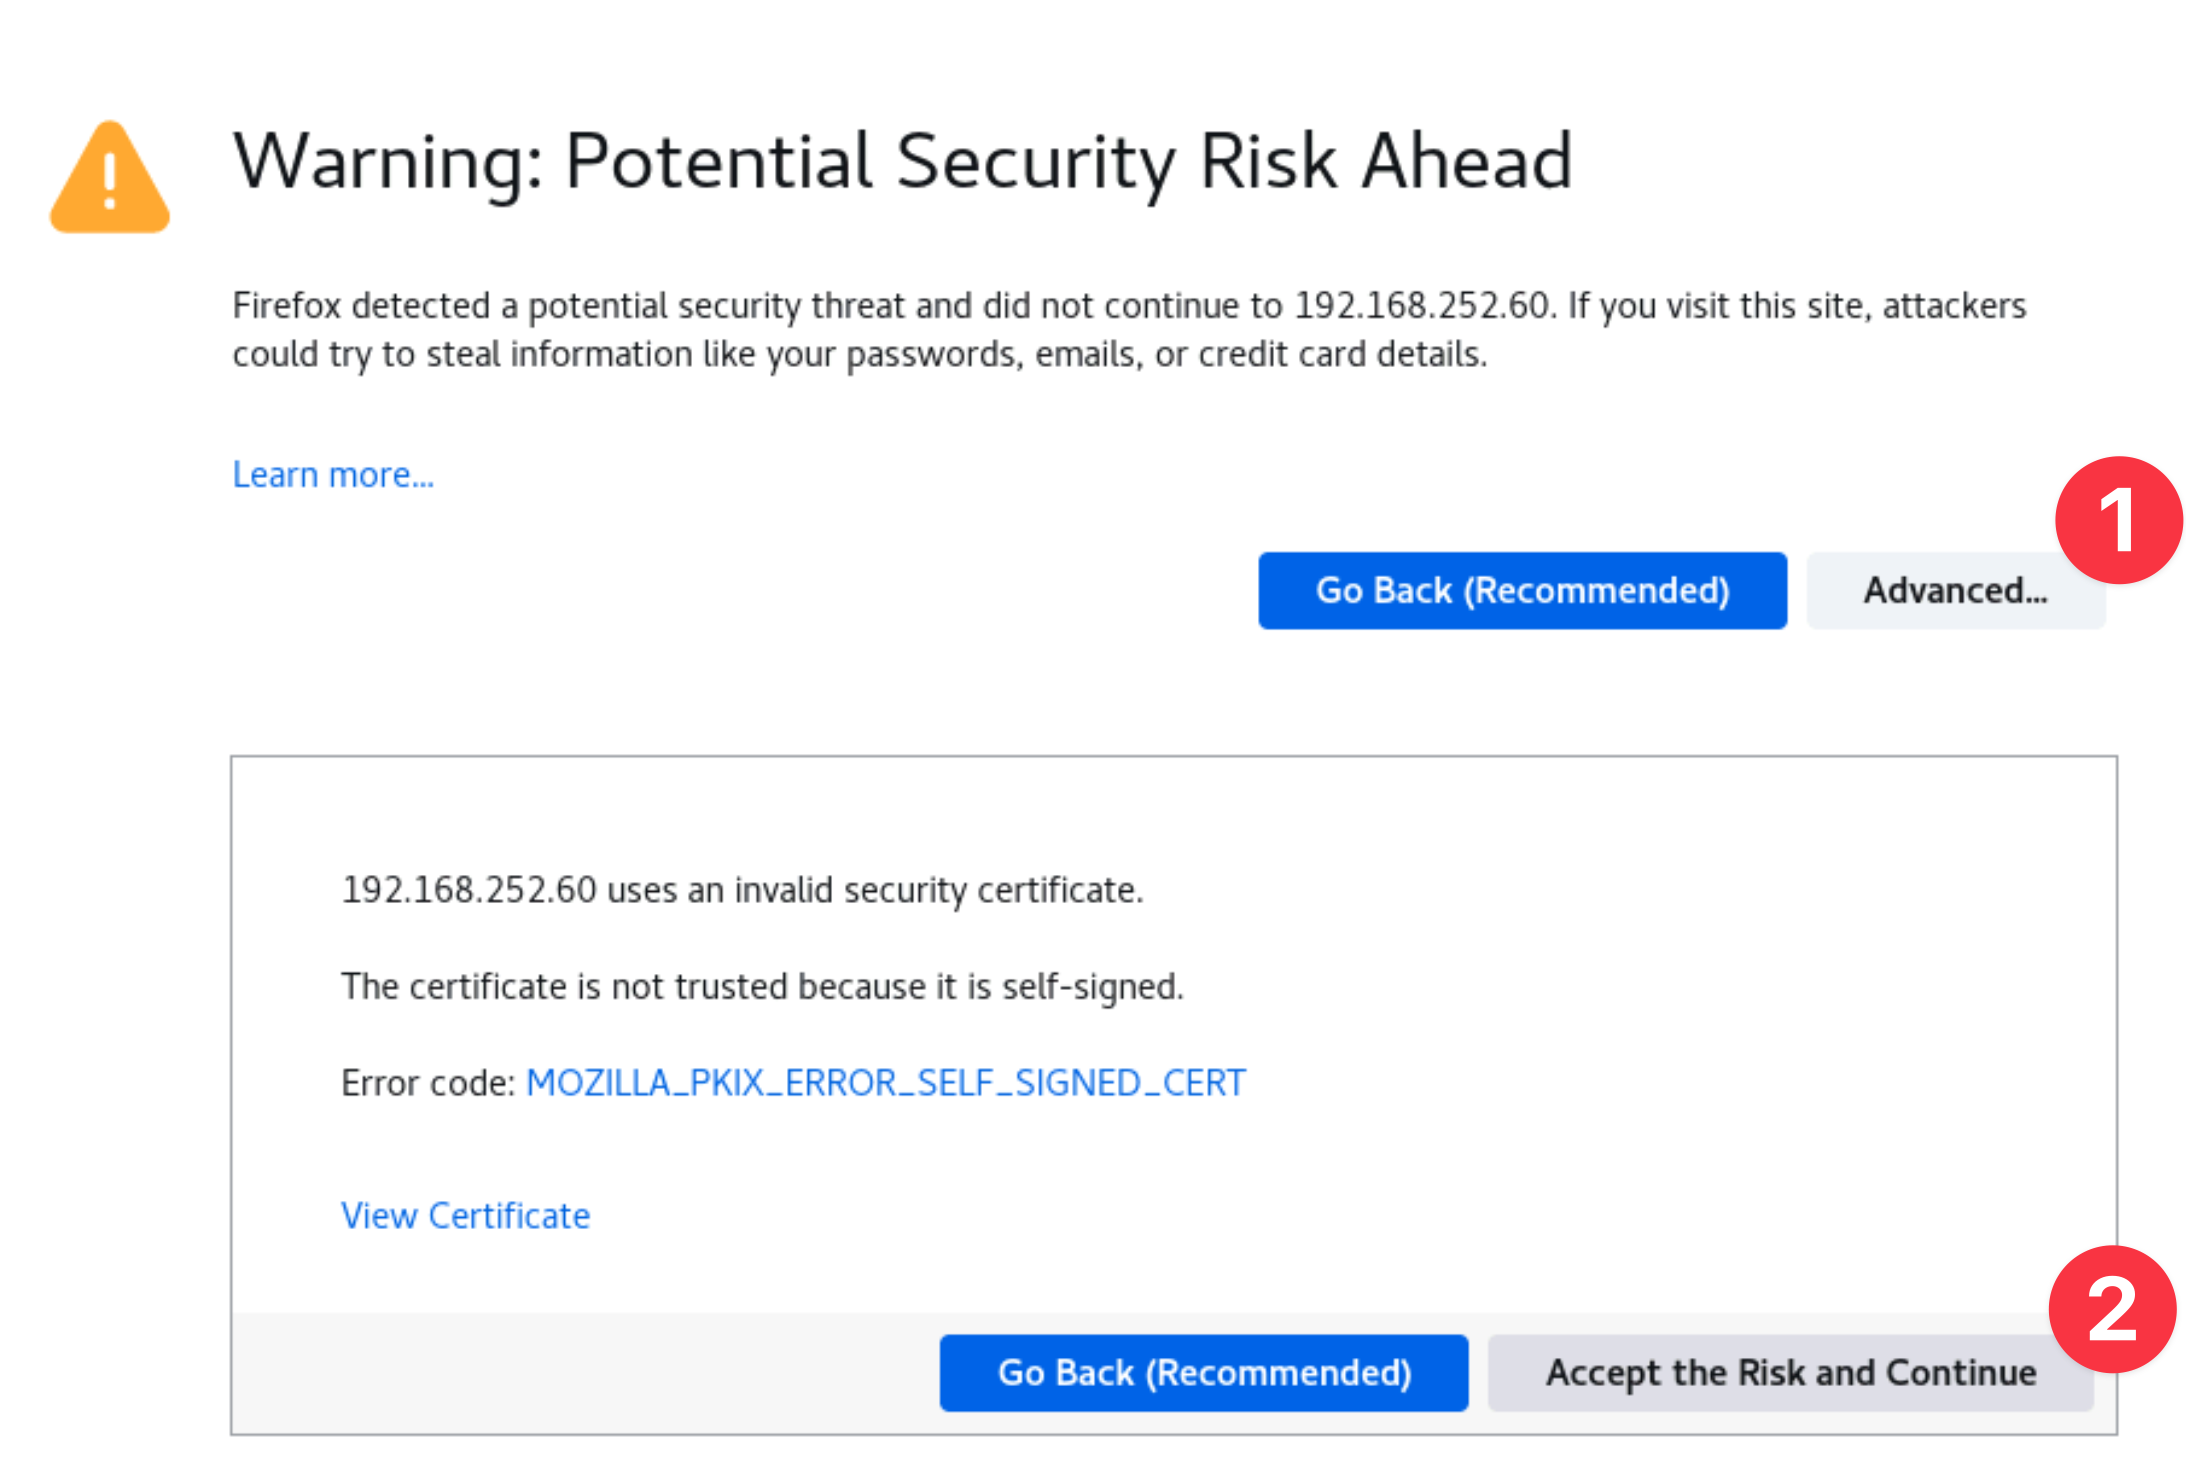
You can safely ignore the warning about the certificate being untrusted.
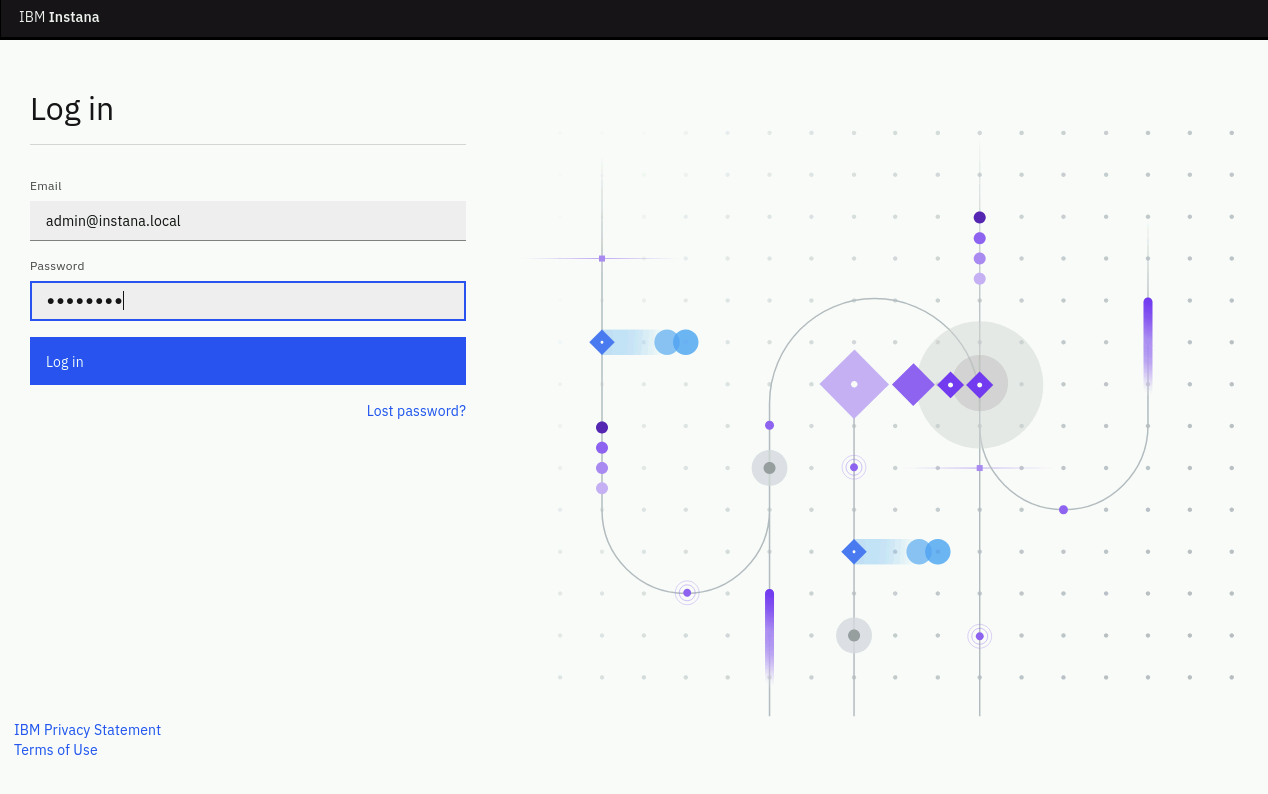
When prompted, enter the username and password that you updated earlier.
- Username: admin@instana.local
- Password: Passw0rd
3.1: Create an Alert Channel
In order to notify people when problems occur in an Instana environment, you must first have an Alert Channel. An Alert Channel is a mechanism that is used to get Events out of Instana and into another system when Events are triggered.
There are a variety of Alert Channels including:
- Slack
- AIOps
- and more...
In this section we'll show you how to setup an Alert Channel. Later, in the Administrative section, we'll use that Alert Channel to get notifications when an Event triggers.
About SMTP Configuration Information:
-
Pre-configuration: In this lab, the SMTP server was set up during the initial Instana backend installation. You can view the specific steps in the Server and Agent Installation Lab guide.
-
Modification/Setup: If you need to configure or update SMTP settings after installation, there is also an information section giving details on how to configure SMTP post installation.
From the Instana UI select the Settings gear in the left side navigation. Then, select Alert Channels
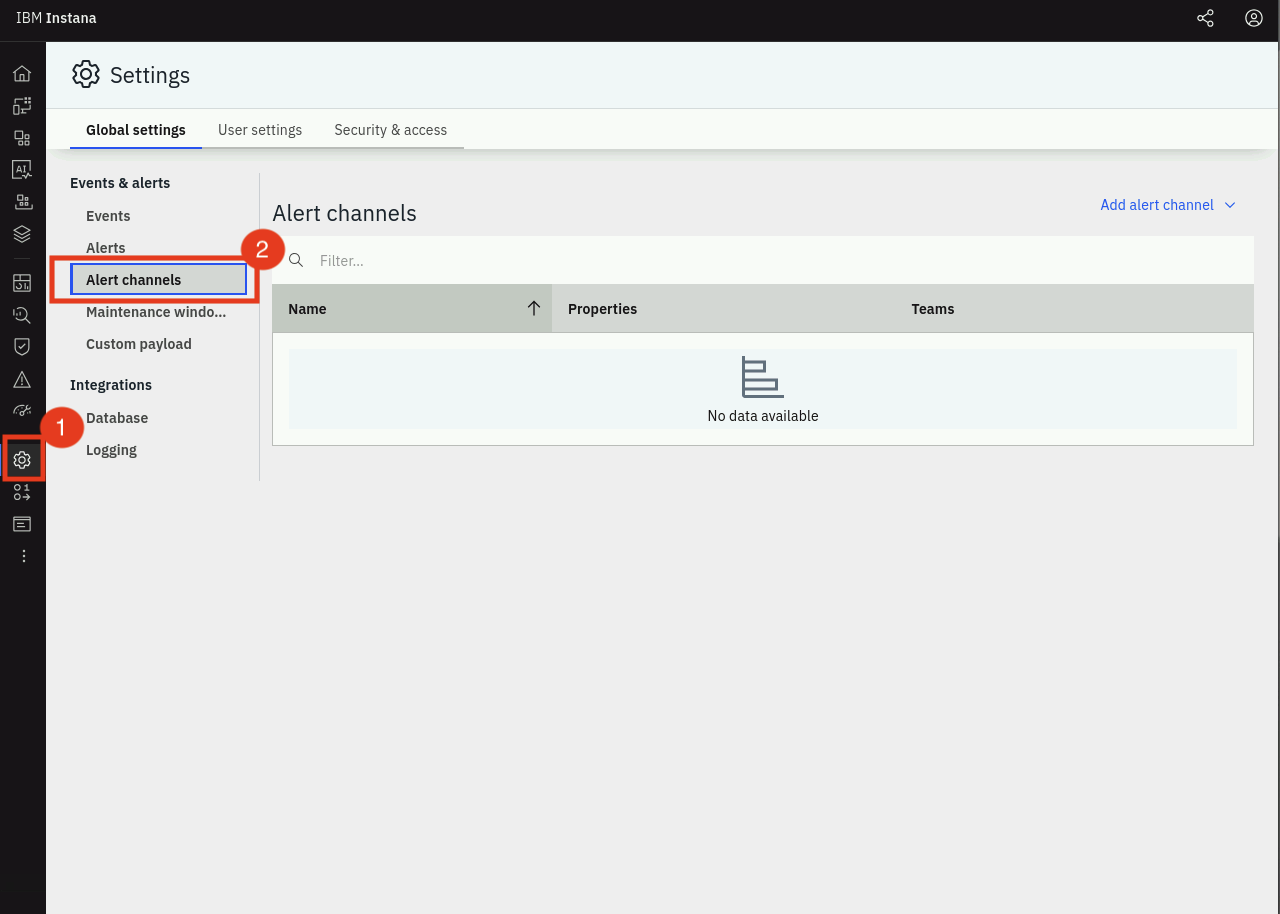
The screen will change to show the Alert Channels. Since this is a new install of Instana, there are no Alert Channels defined.
In the upper right portion of the screen, click on the Add Alert Channel dropdown and select Email
There are several different types of Alert Channels to integrate Events into a variety of solutions. The Generic Webhook is the most flexible and supports integration into an number of tools like ServiceNow that support webhooks.
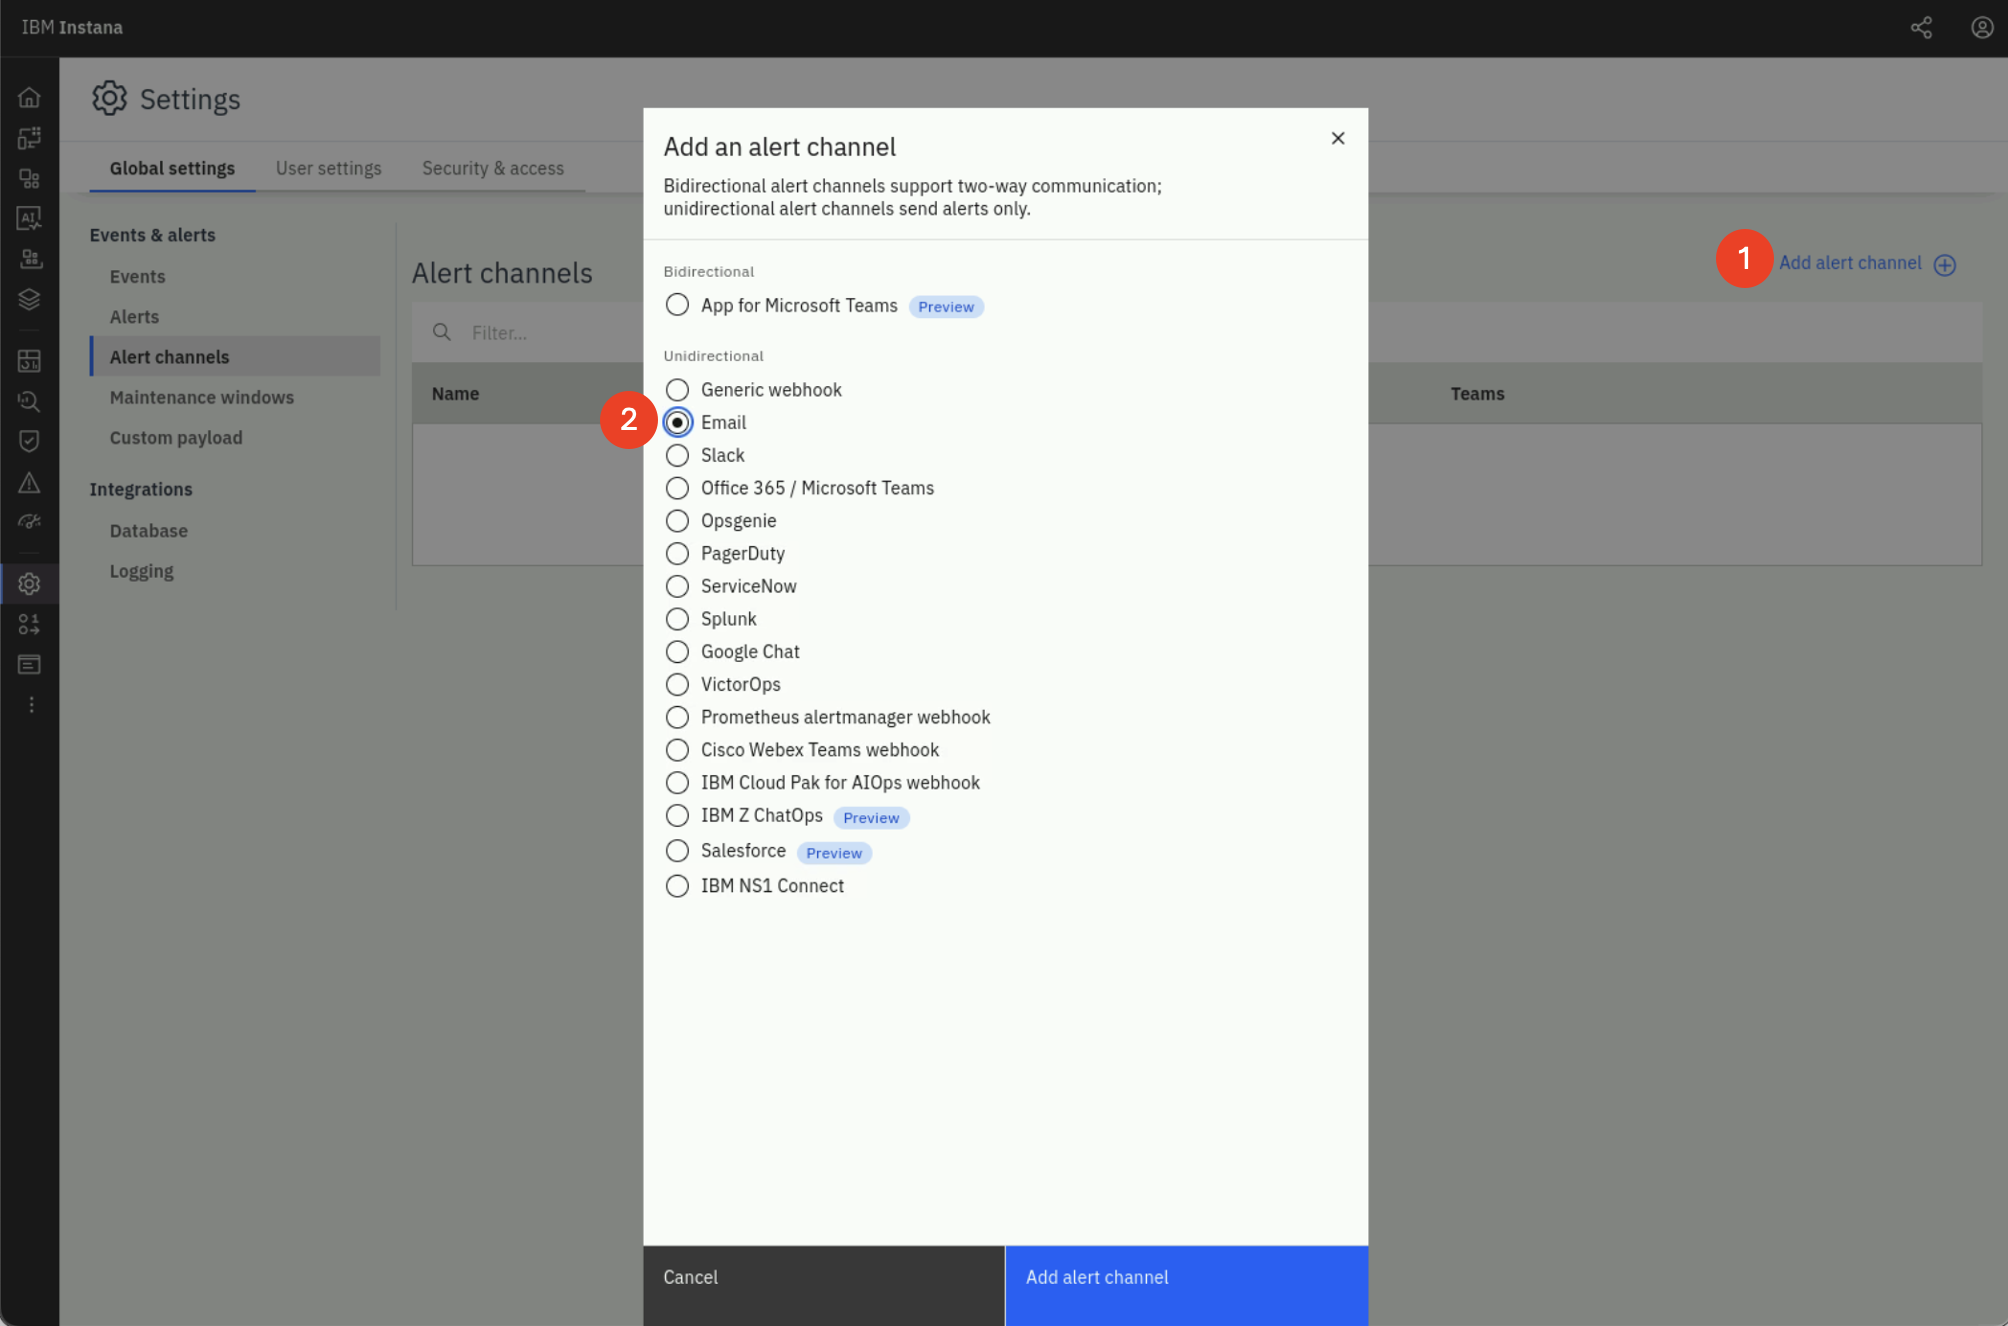
After selecting Email the screen will change to show the fields required to configure the Email Alert Channel. An Alert Channel can be setup to notify specific users or to notify a large group of users. For example, you might want all database related Events to be sent to a database team email alias for the DBAs. Or, you might want to notify a specific line of business or the IT Operations team.
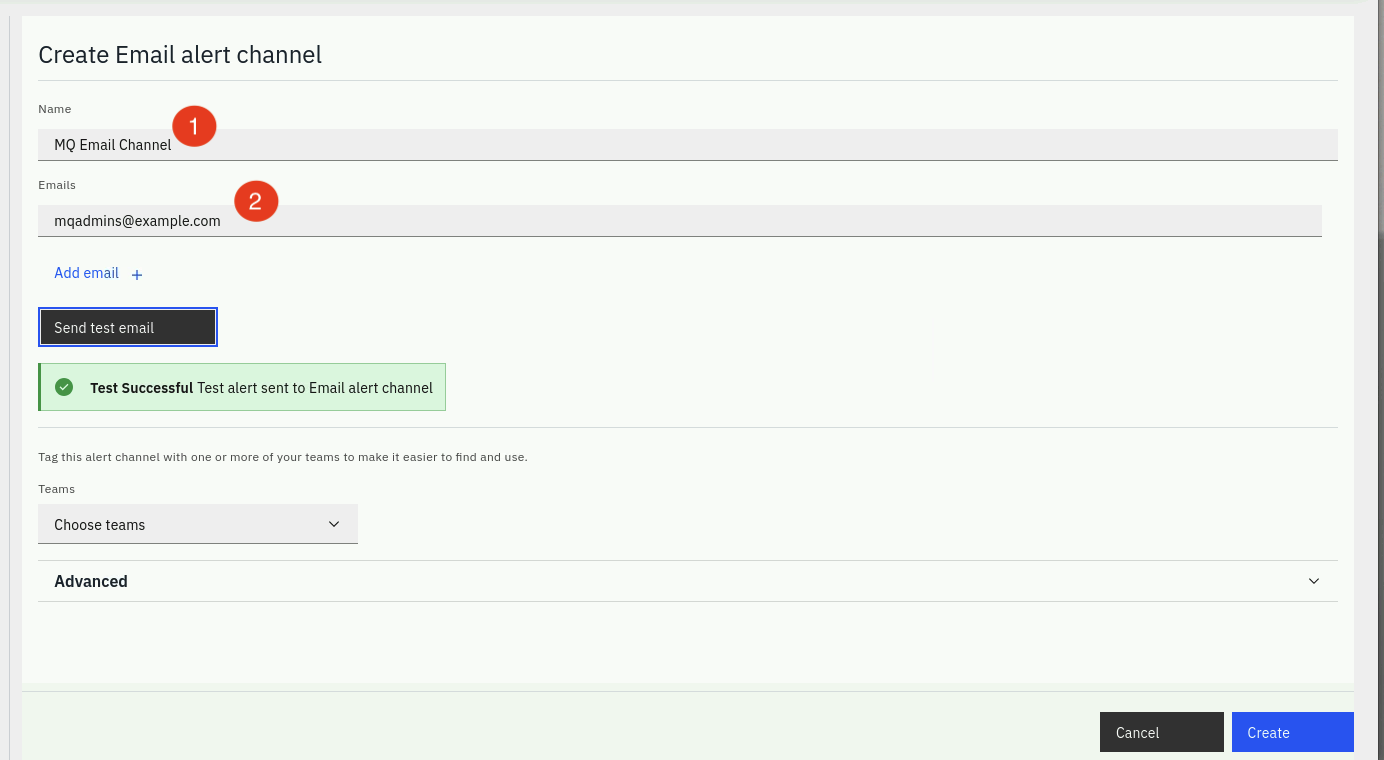
Here are the steps for setting up the Email channel.
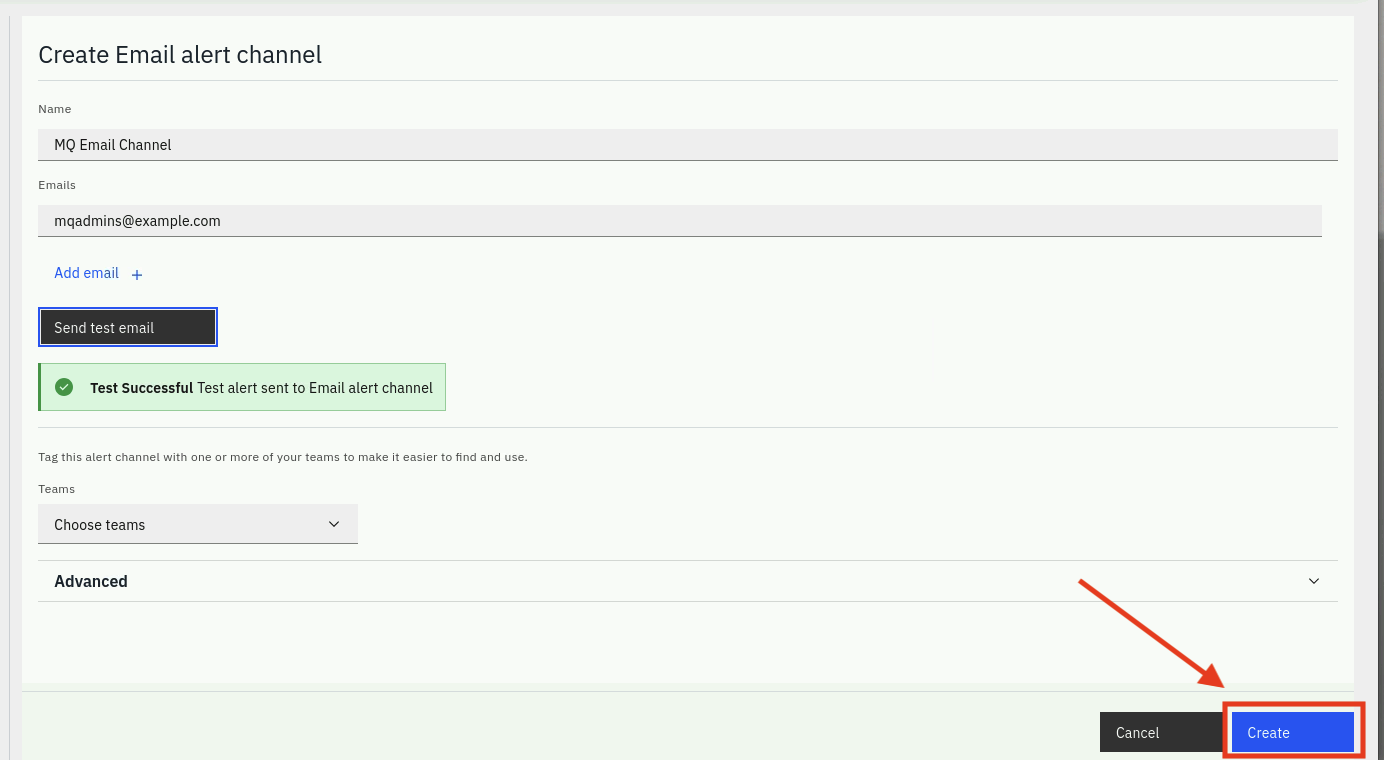
- Enter a name for the Alert Channel. The name can be anything, but should be
meaningful. For example, if the Alert Channel will be used to notify the MQ
admins, like in this case, call it something MQ related such as
MQ Email Channel - Enter the email address to notify. Notice that there is an Add Email link
on the form if you want to add multiple email addresses. For this lab we will
use
mqadmins@example.com.
Next, click the Send Test Email button. This will attempt to send a test email to the address you specified.
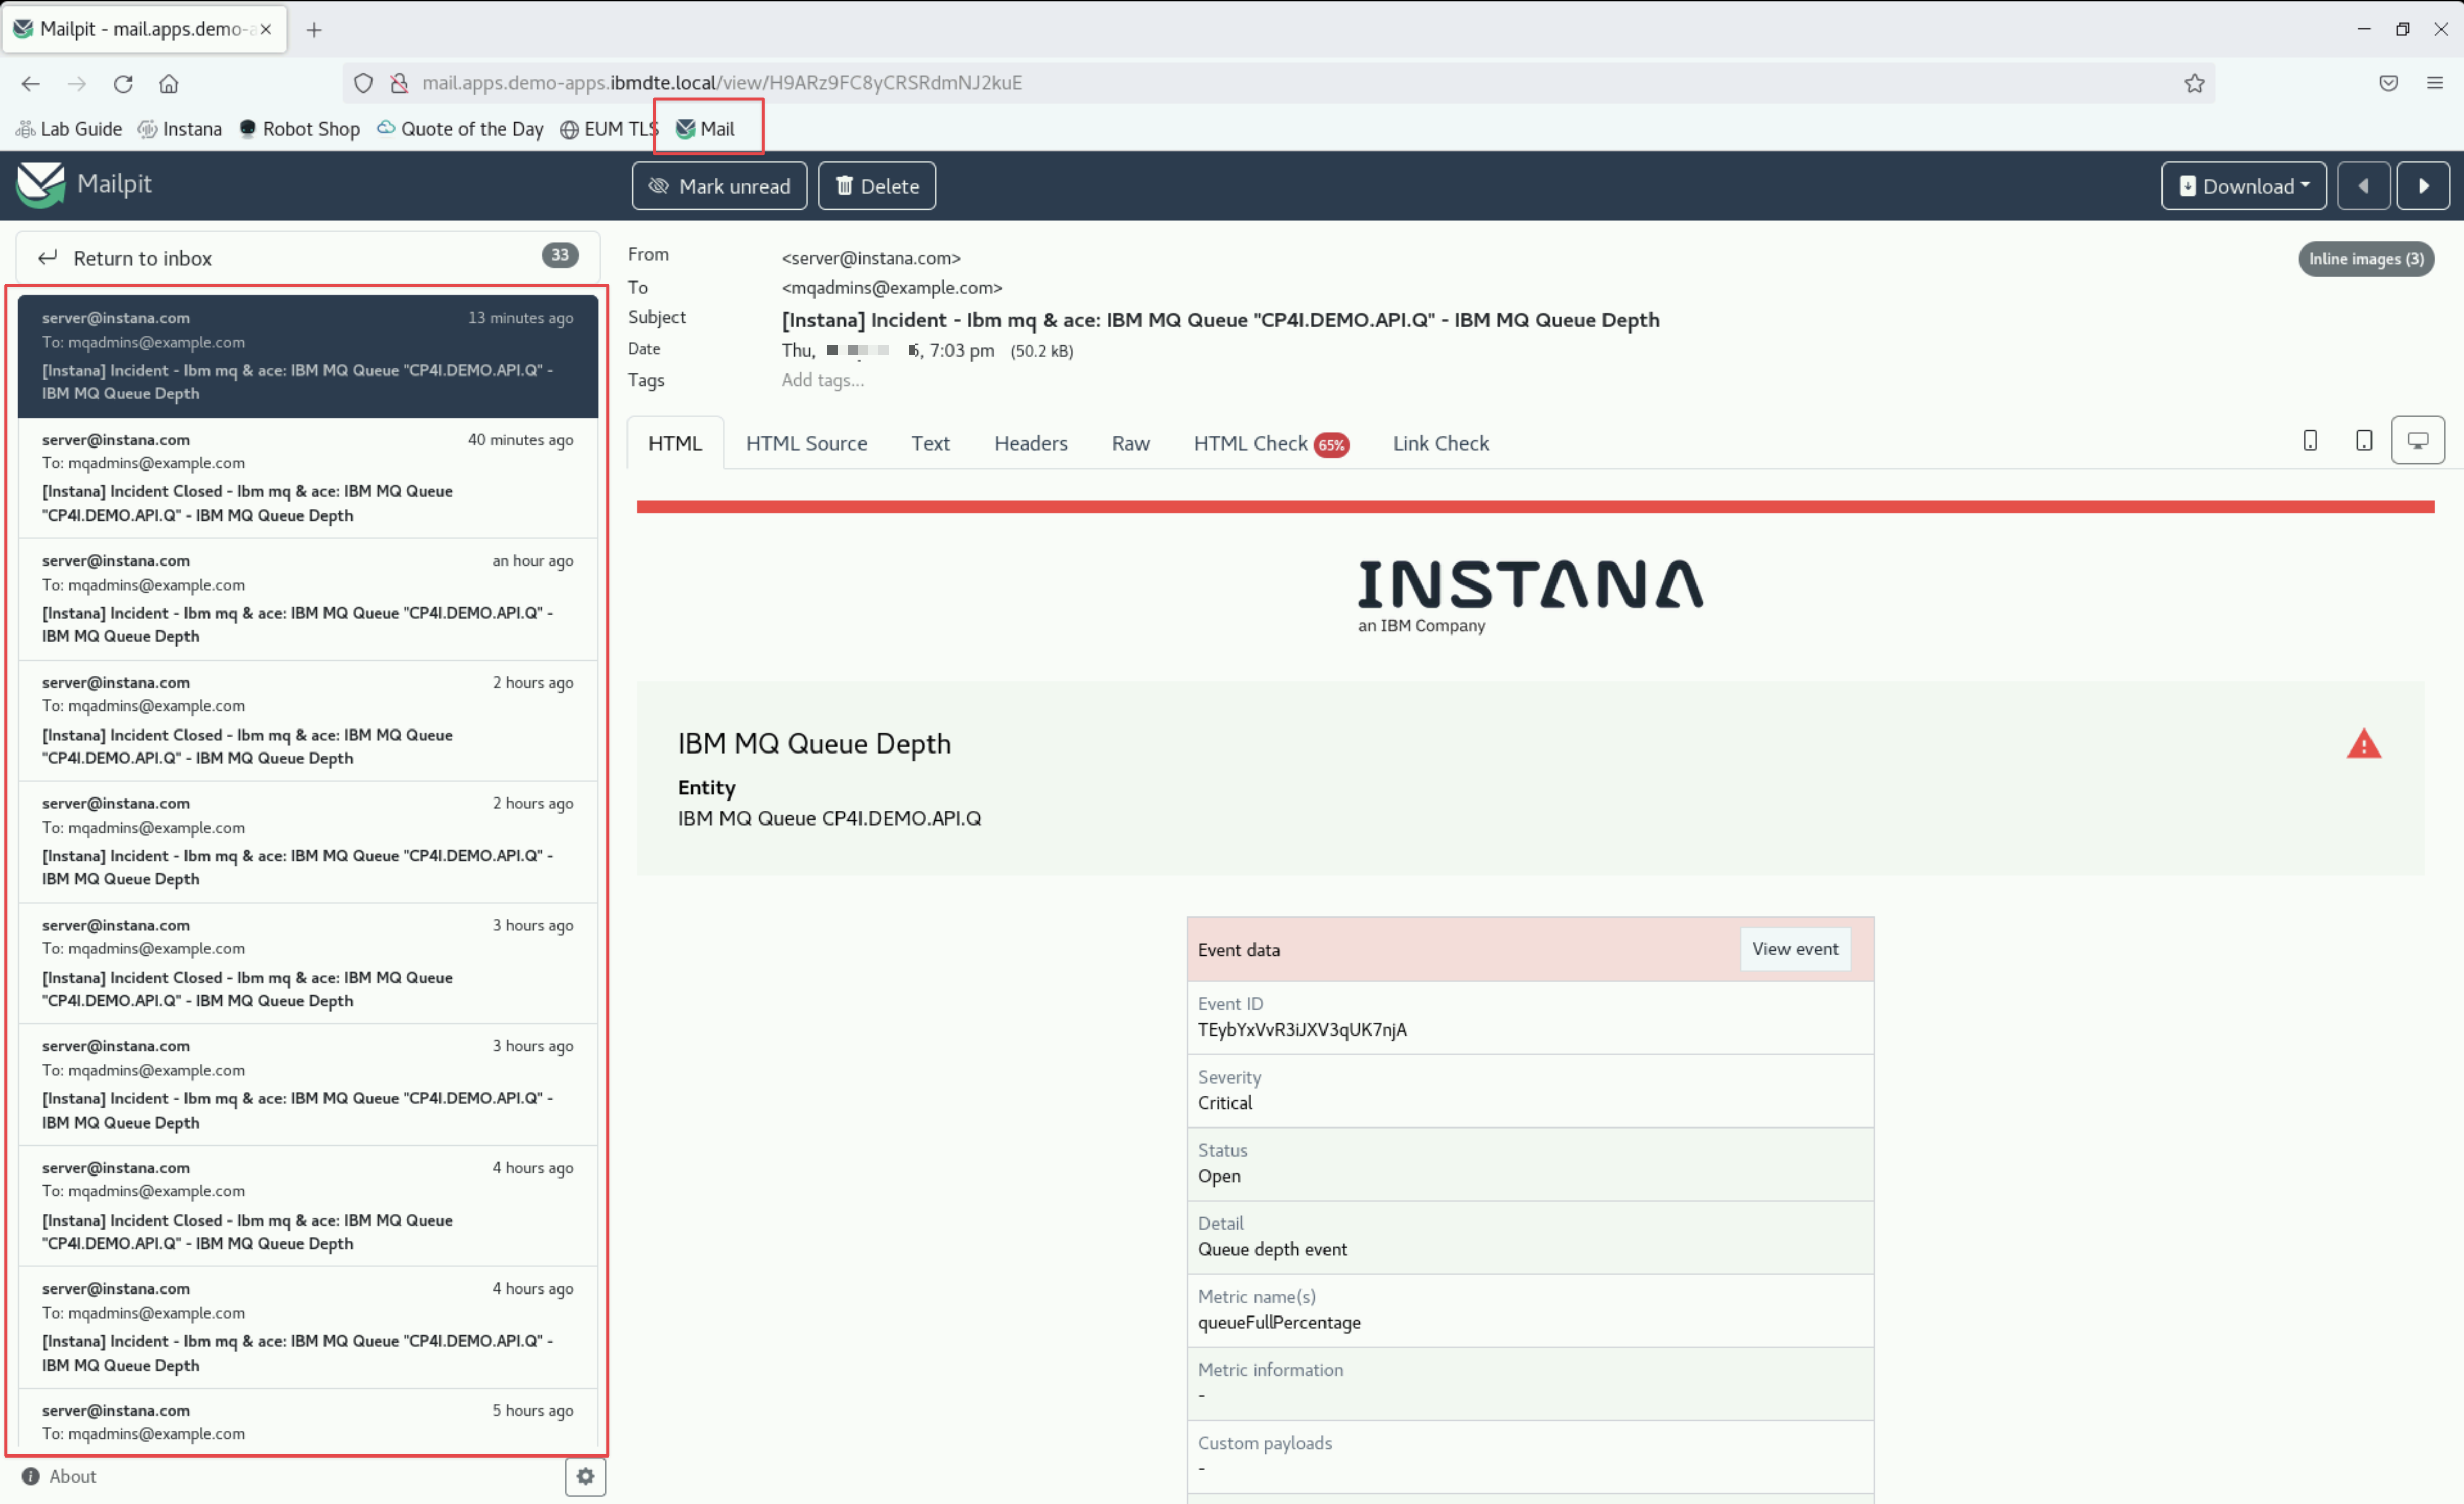
Check for the test email by opening the Firefox bookmark called Mail in a new tab
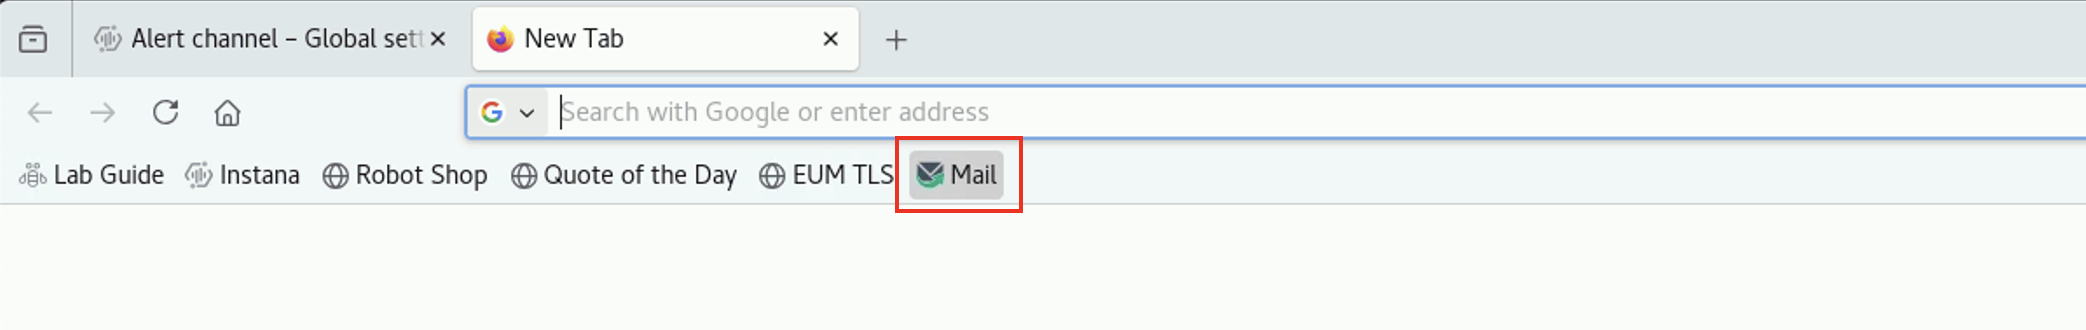
You should see the test email in the Inbox
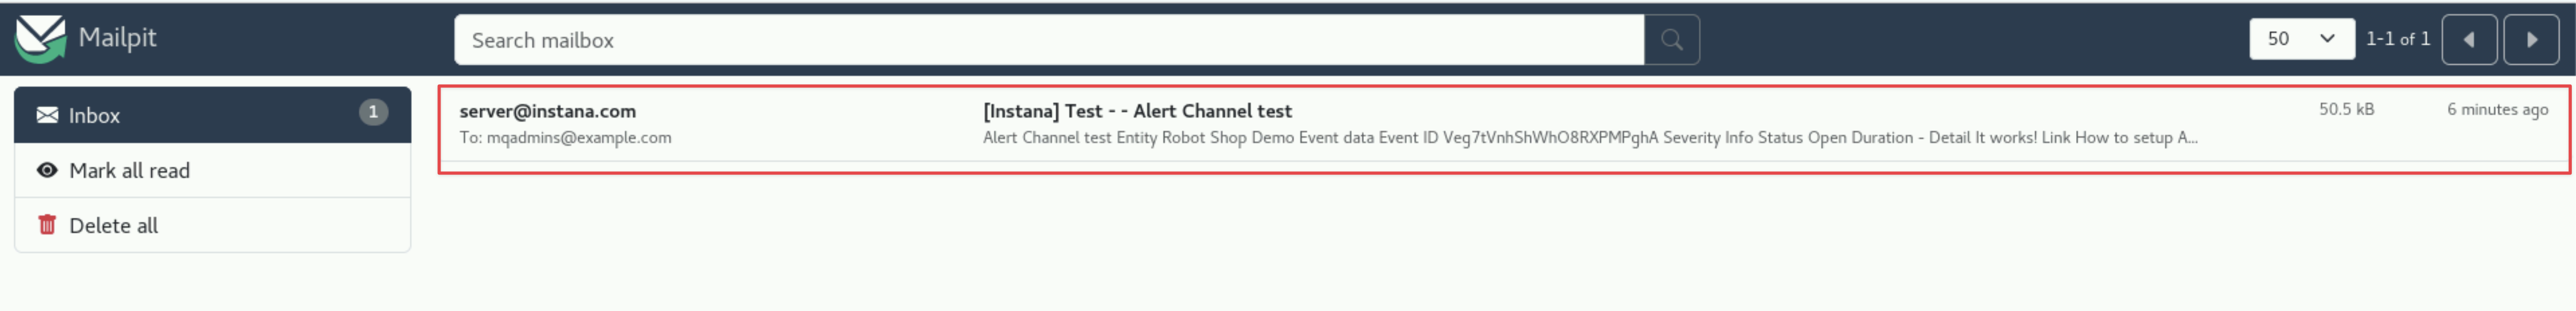
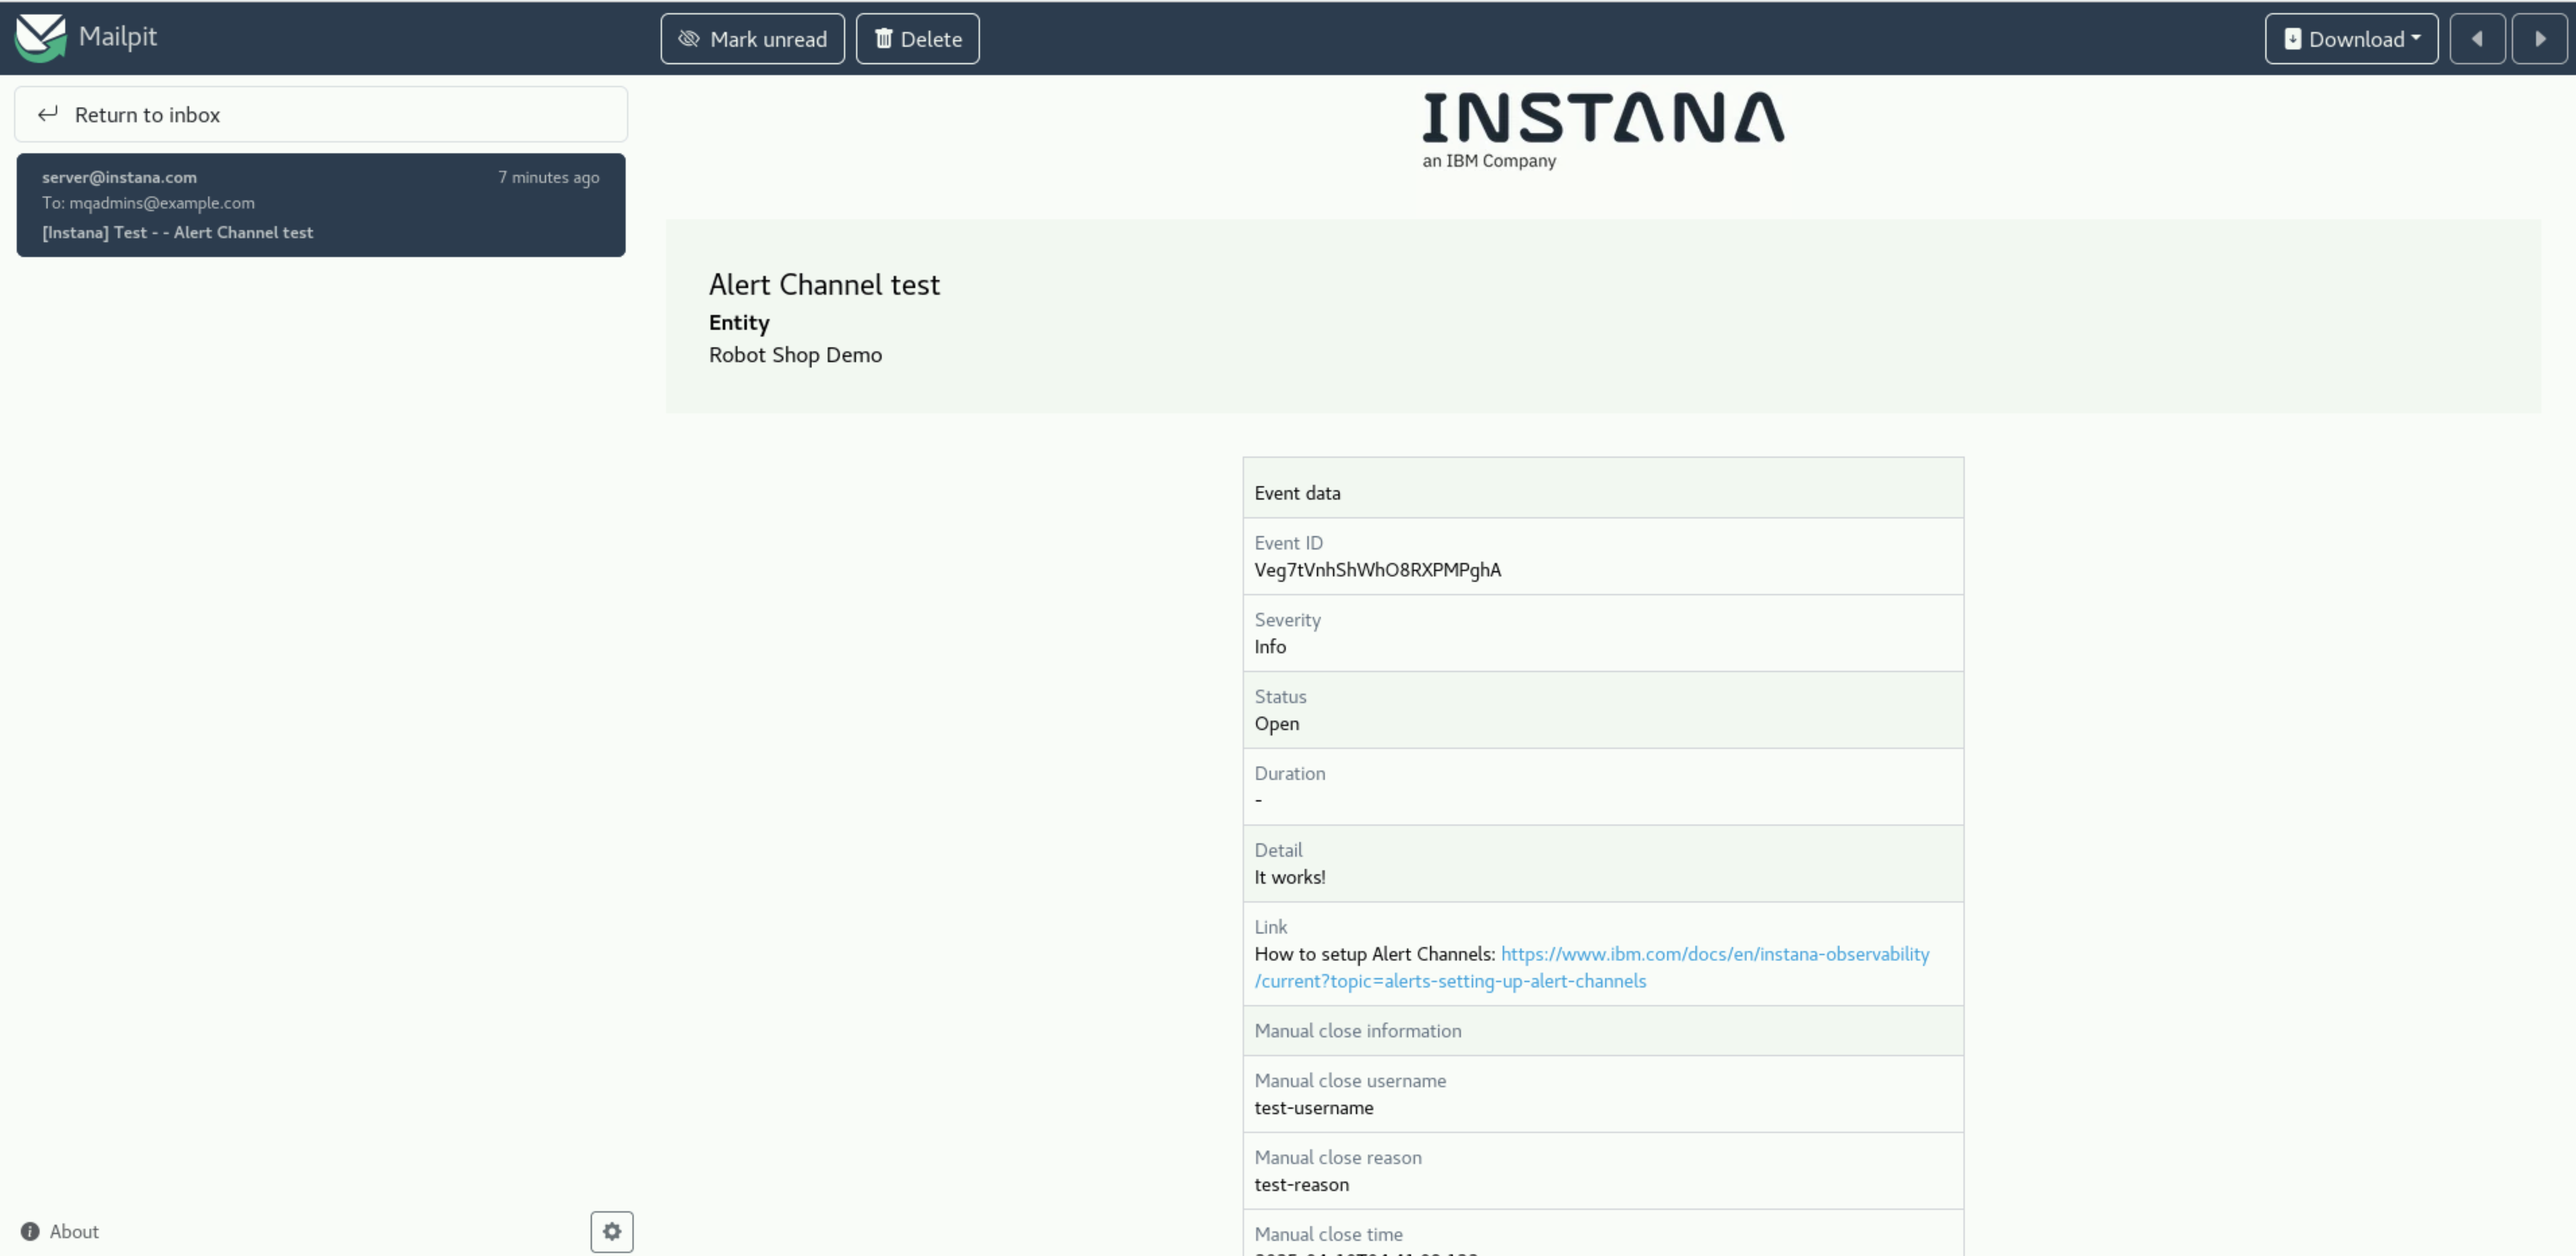
You can select the email for a preview
After successfully testing the Alert Channel, click the Create button to save the Alert Channel
3.2: Create an Analytics Based Smart Alert
In this section, you will create an analytics based Smart Alert to detect abnormal behavior within an application.
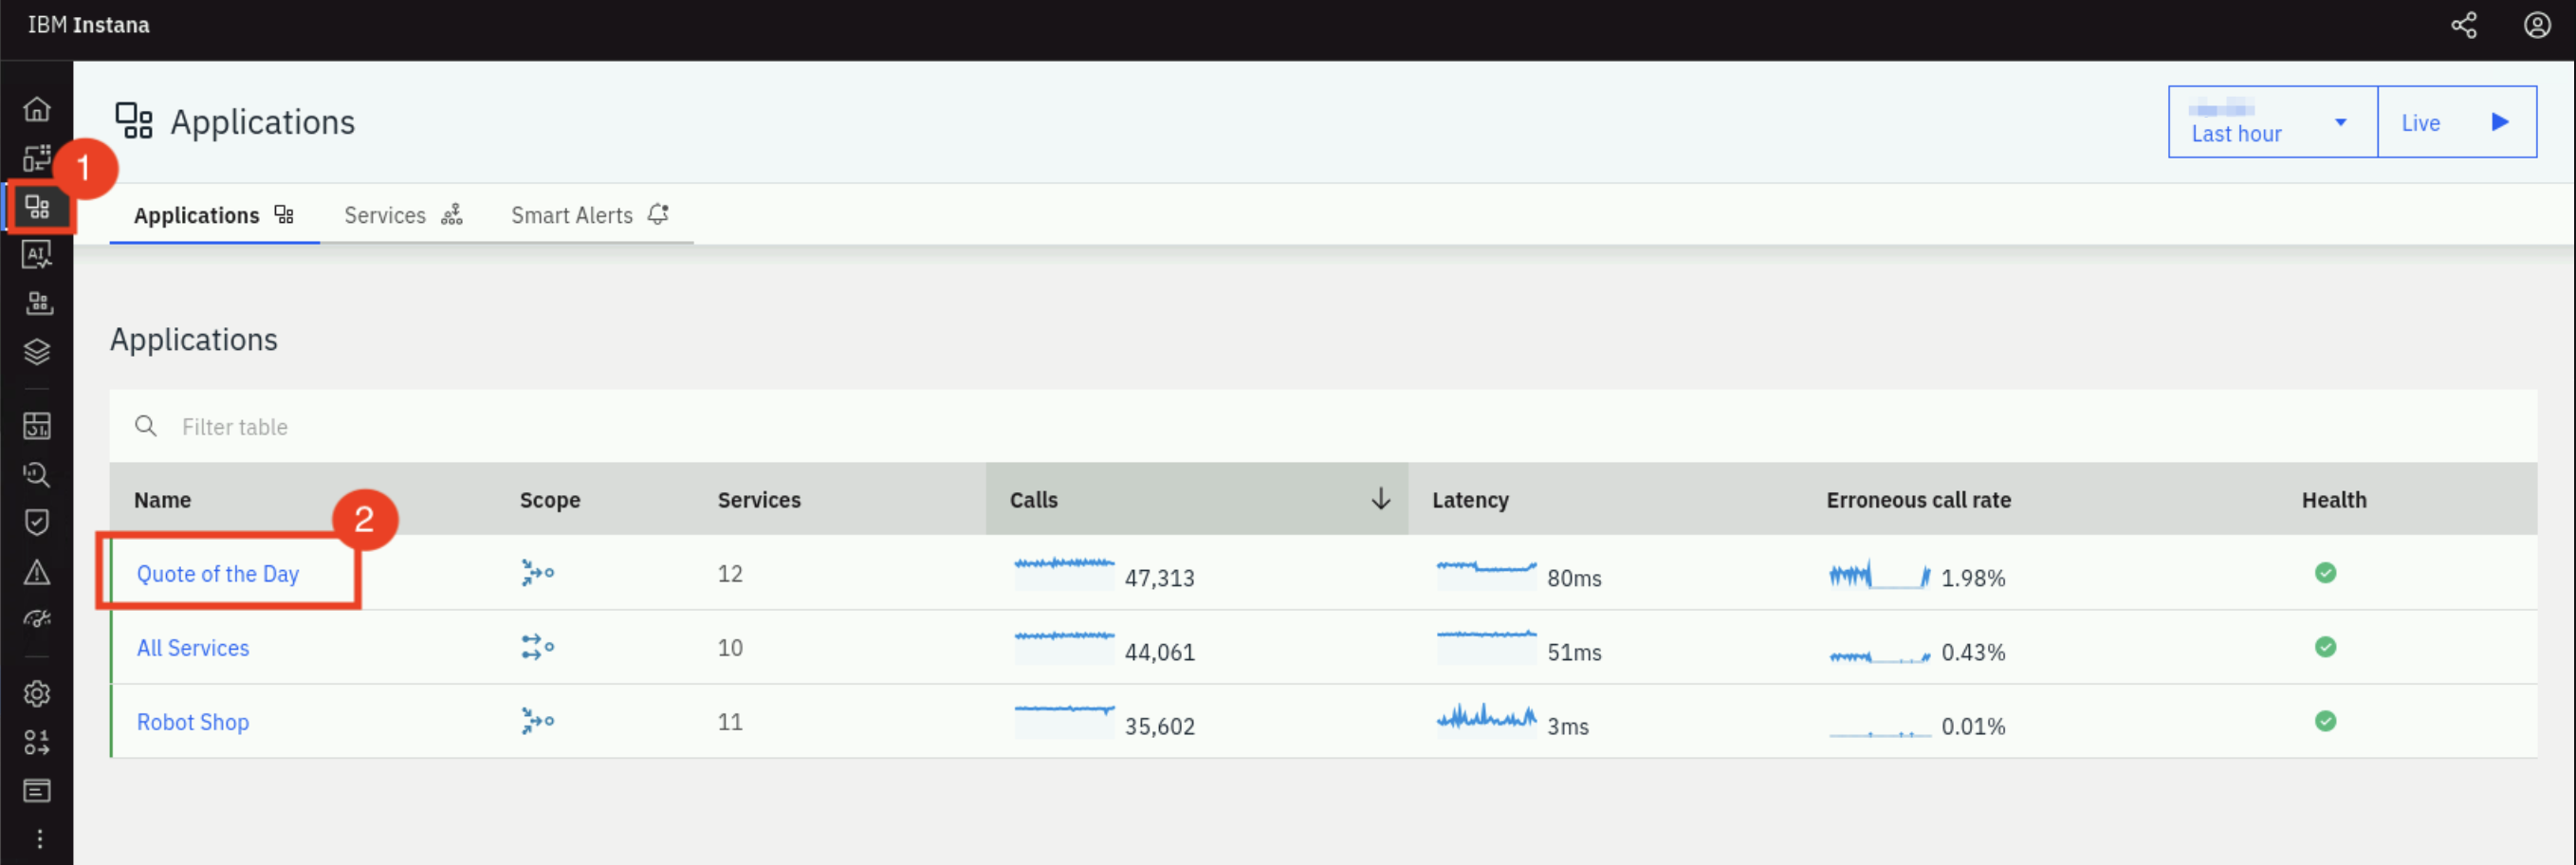
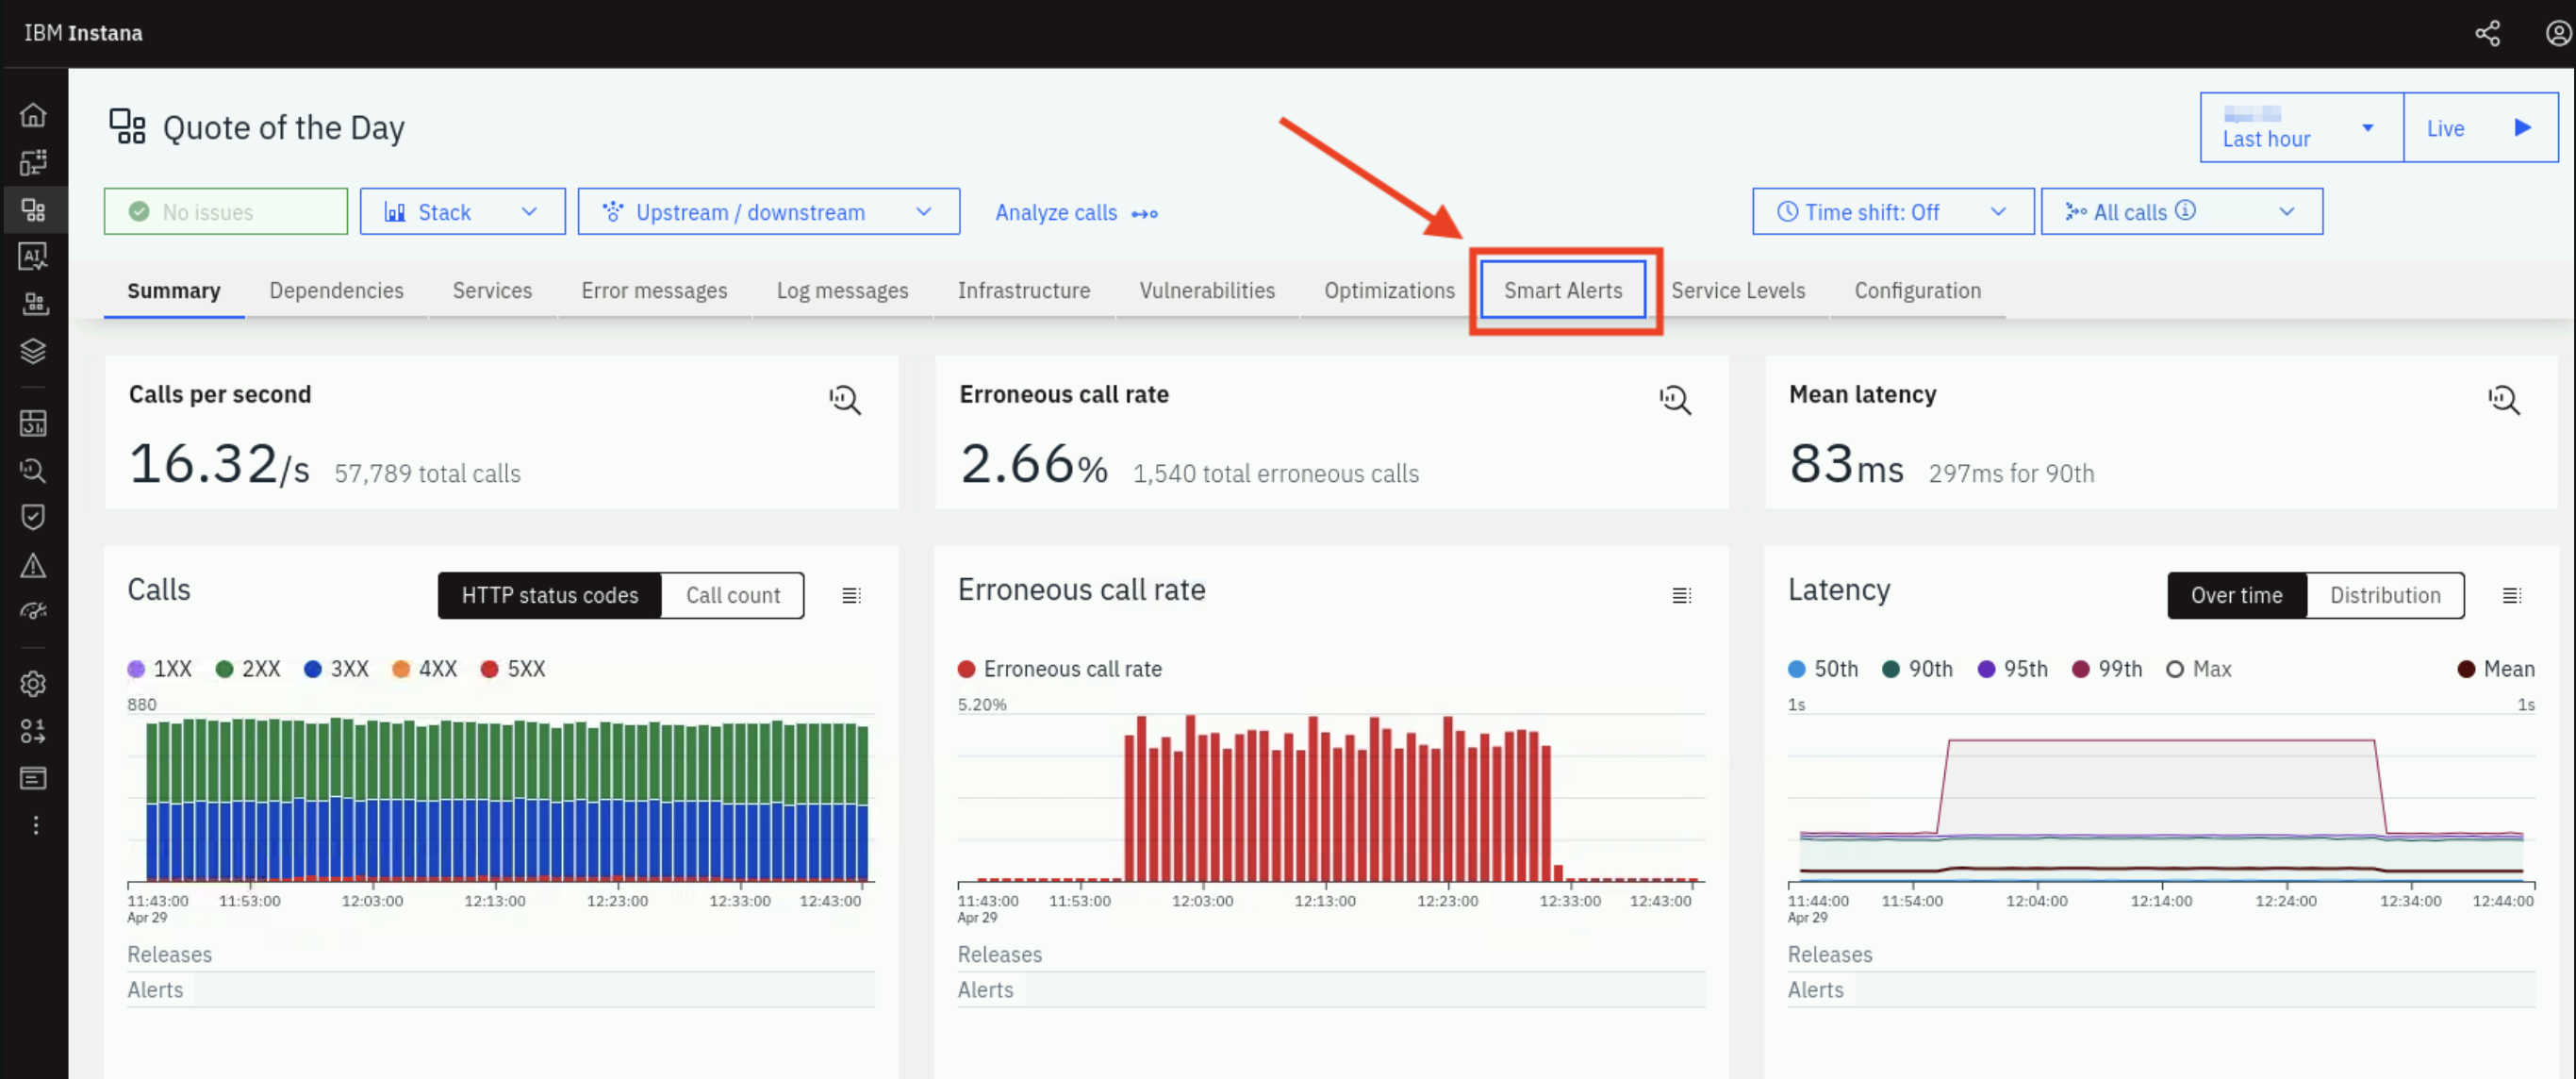
Click on Applications and then, select the Quote of the Day application.
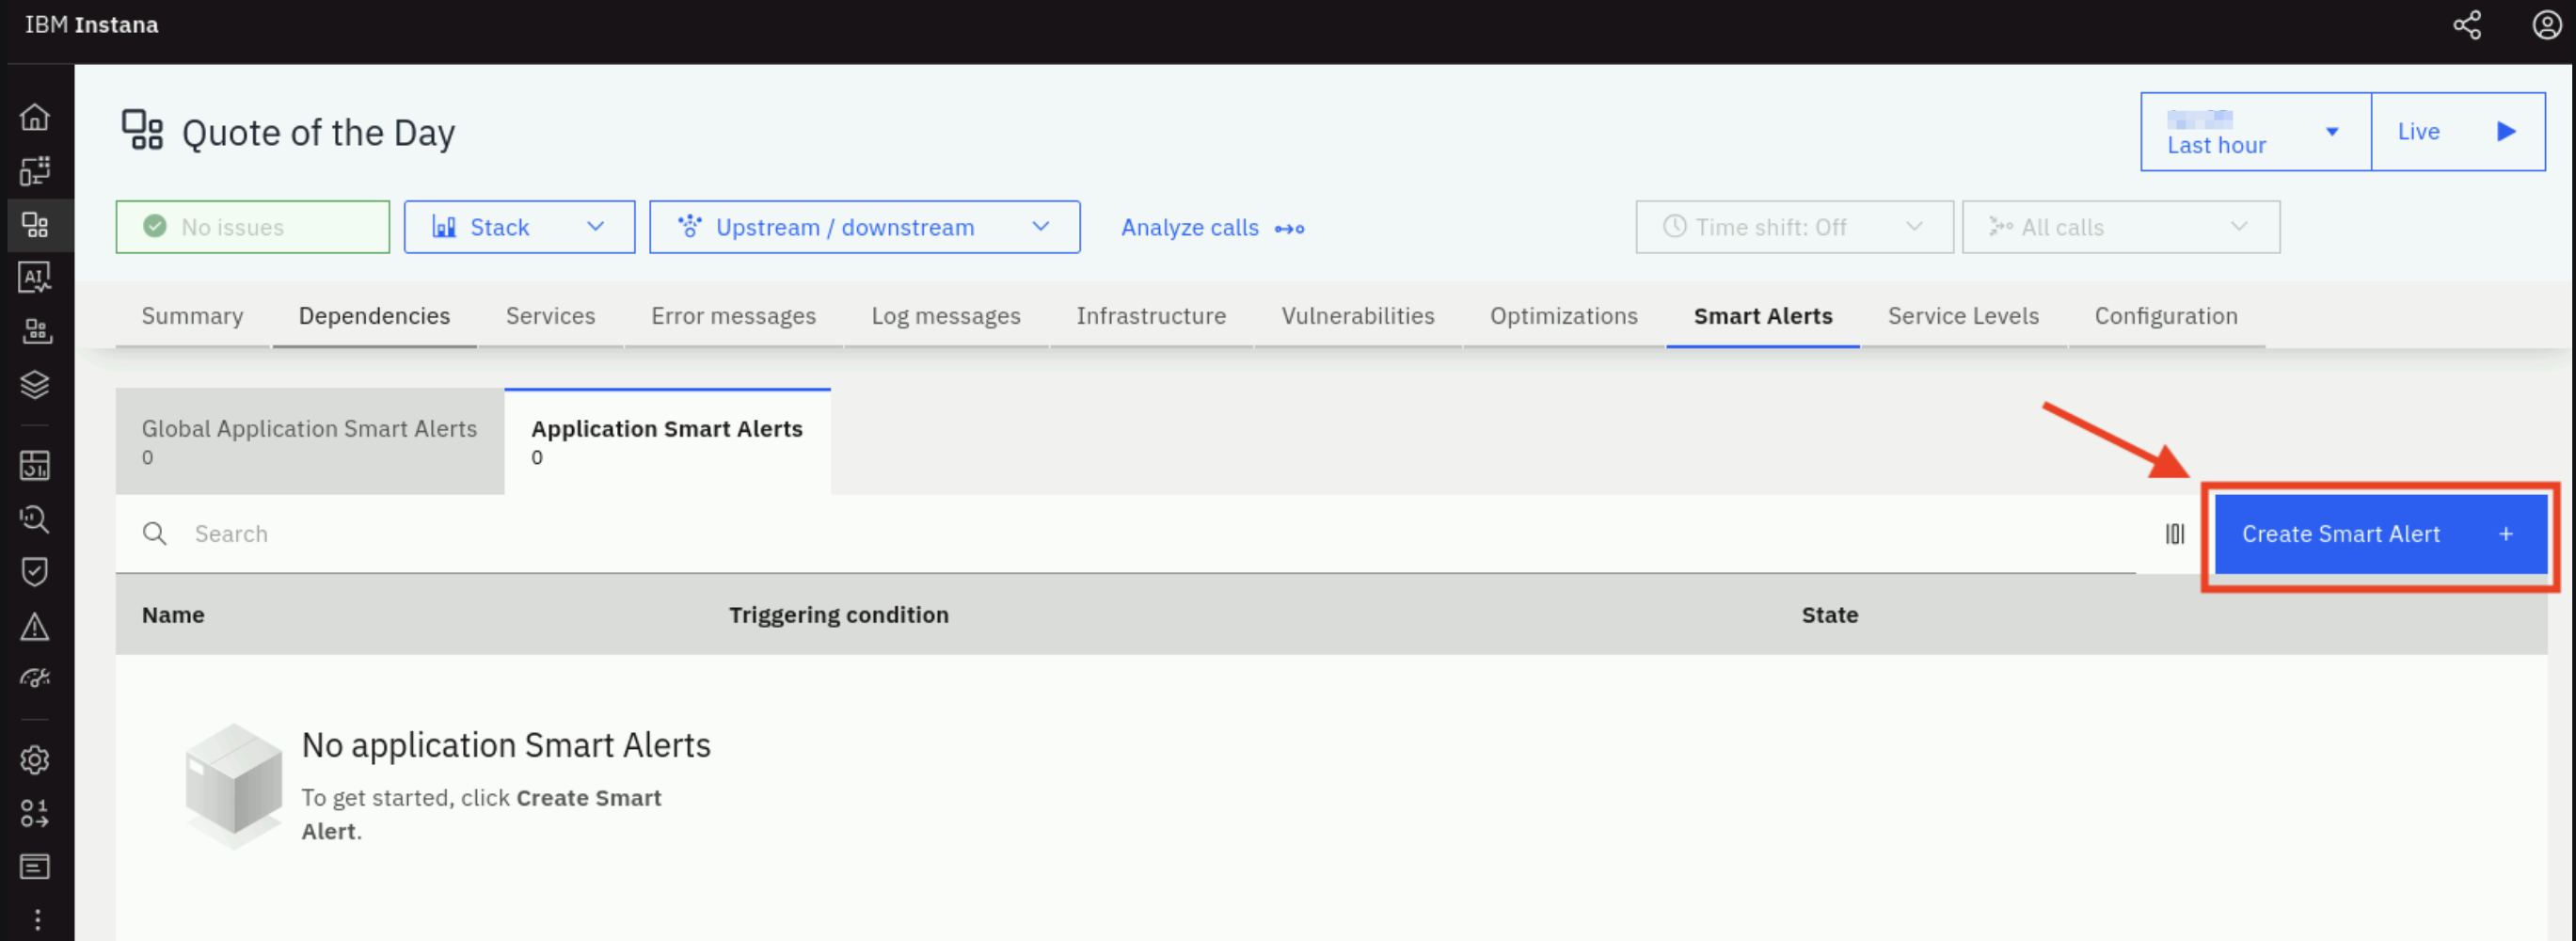
Click on Smart Alerts tab.
Then click on Create Smart Alert button.
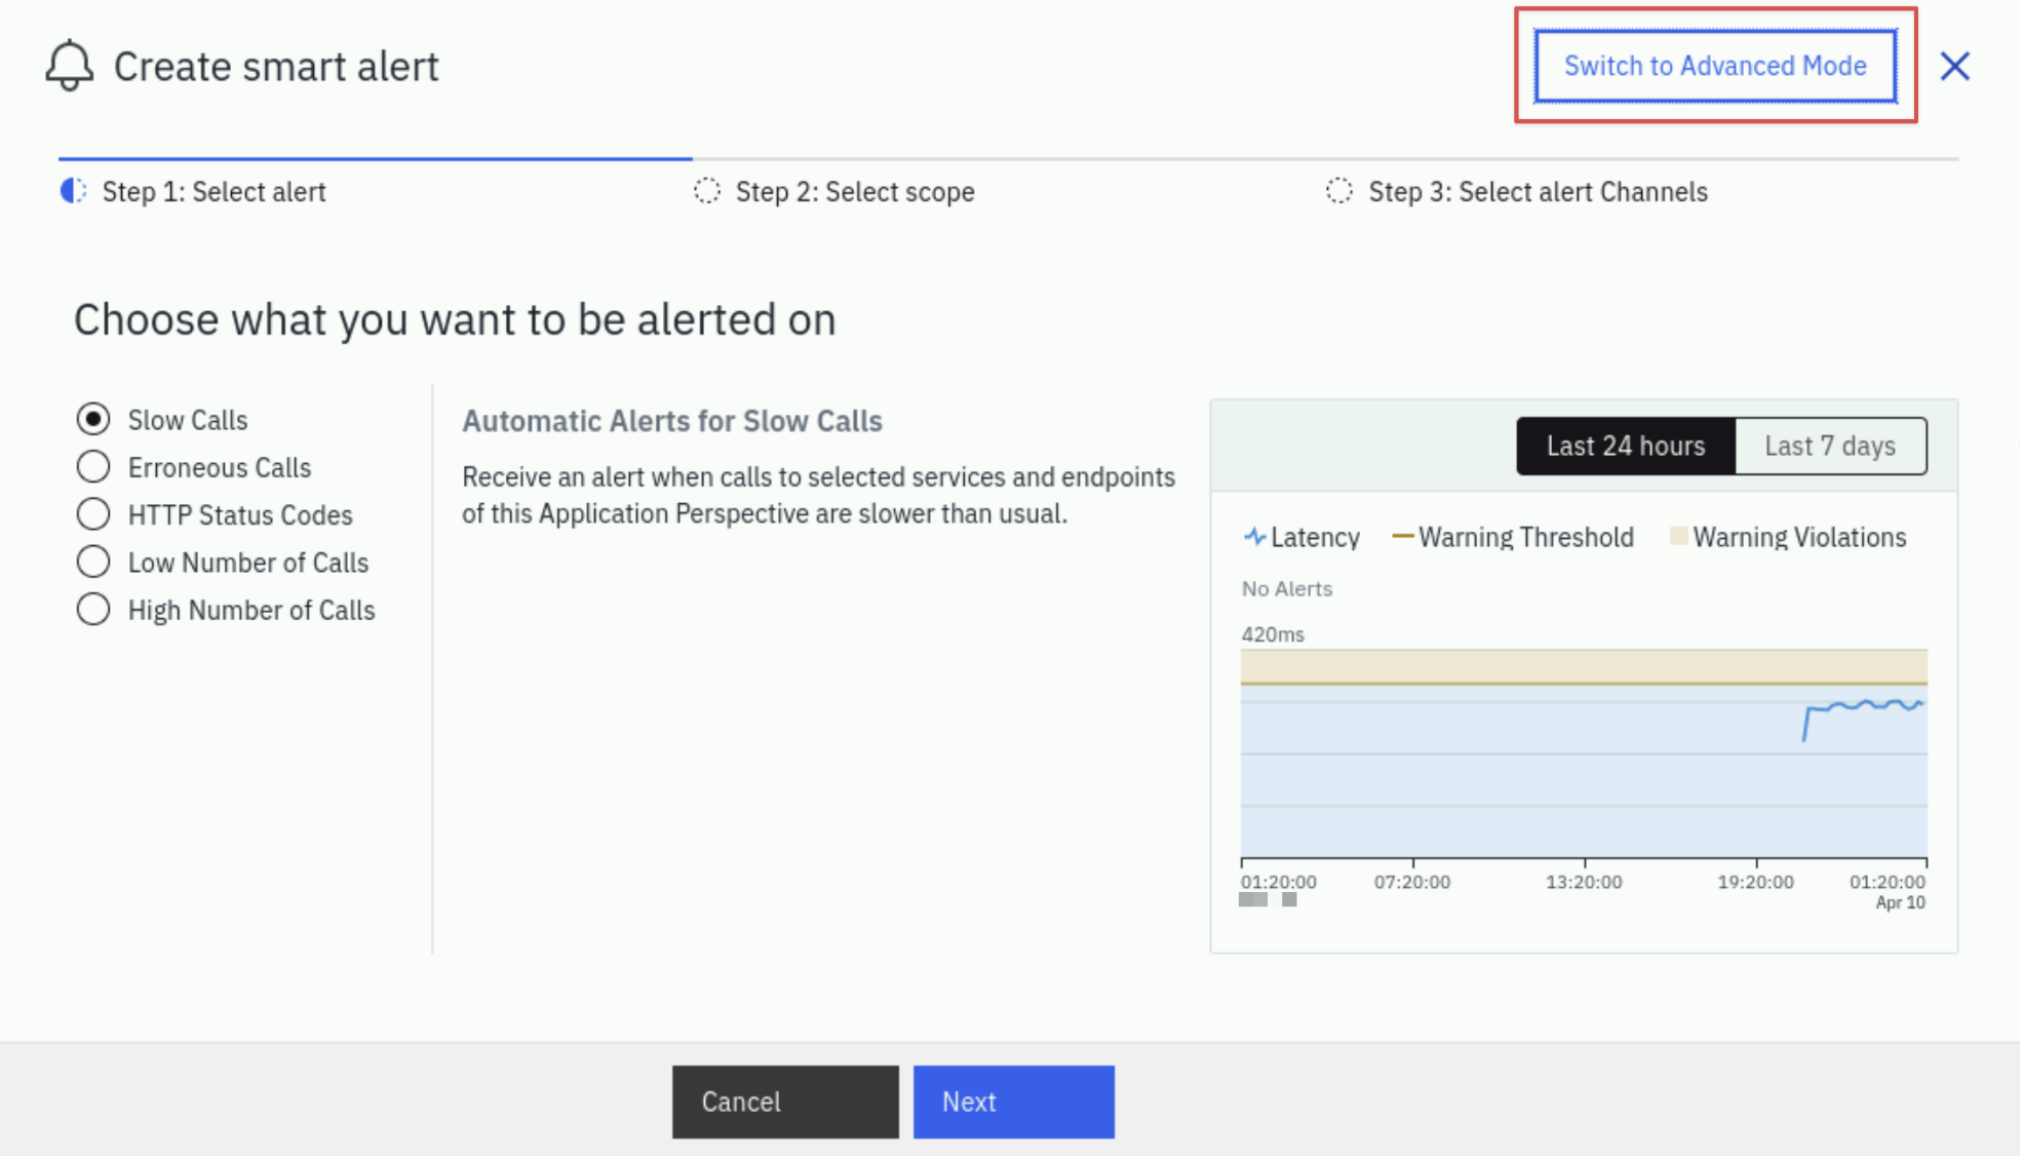
There is a simple and an advanced mode. We'll be using the advanced mode which allows you to see all of the capabilities.
In the upper right corner of the dialog, select Switch to Advanced Mode
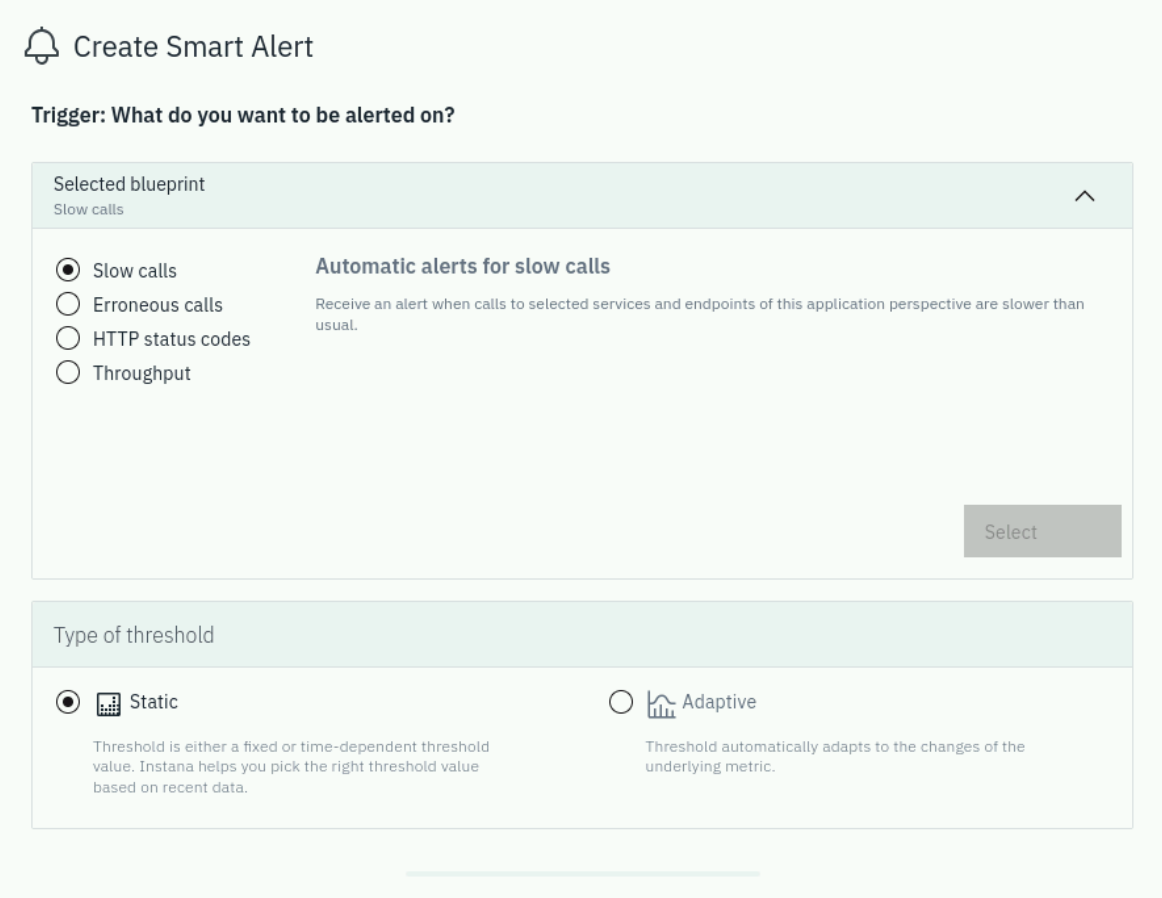
You'll see that there are 4 different Blueprints for the Smart Alert
- Slow Calls
- Erroneous Calls
- HTTP Status Codes
- Throughput (both high and low numbers of calls)
Leave the default of Slow Calls
Leave the default Threshold as Static
During this lab, we will not be using the "Adaptive" Smart Alerts. This is due to the fact that we don't have enough historical data. They require 7 days of historical data.
Scroll down to the Scope section. You'll see that there are number of options to determine which calls you want to analyze.
- You can analyze the calls for this application or you can analyze specific services or endpoints.
- You can analyze Inbound Calls or All Calls
- You can include Internal Calls
- You can include Synthetic Calls
Leave the default settings.
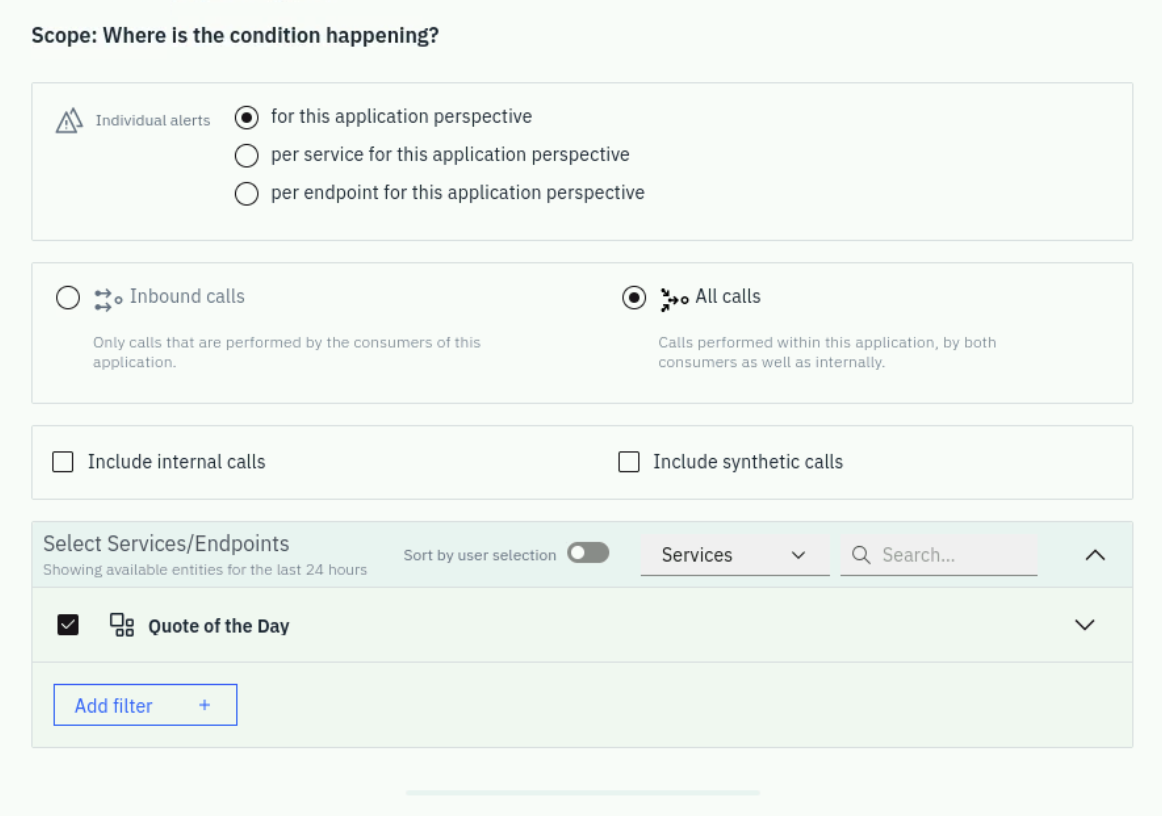
We could select Per Service instead of the default application-level scope. This provides a much more realistic monitoring scenario. Application-level thresholds can be misleading because they aggregate metrics across all services. For example, if "login" represents only 2% of transactions but has really slow response times, it might not trigger an alert if other services are performing well. By monitoring at the service level, you can detect performance issues in individual services that might otherwise be hidden in application-wide averages.
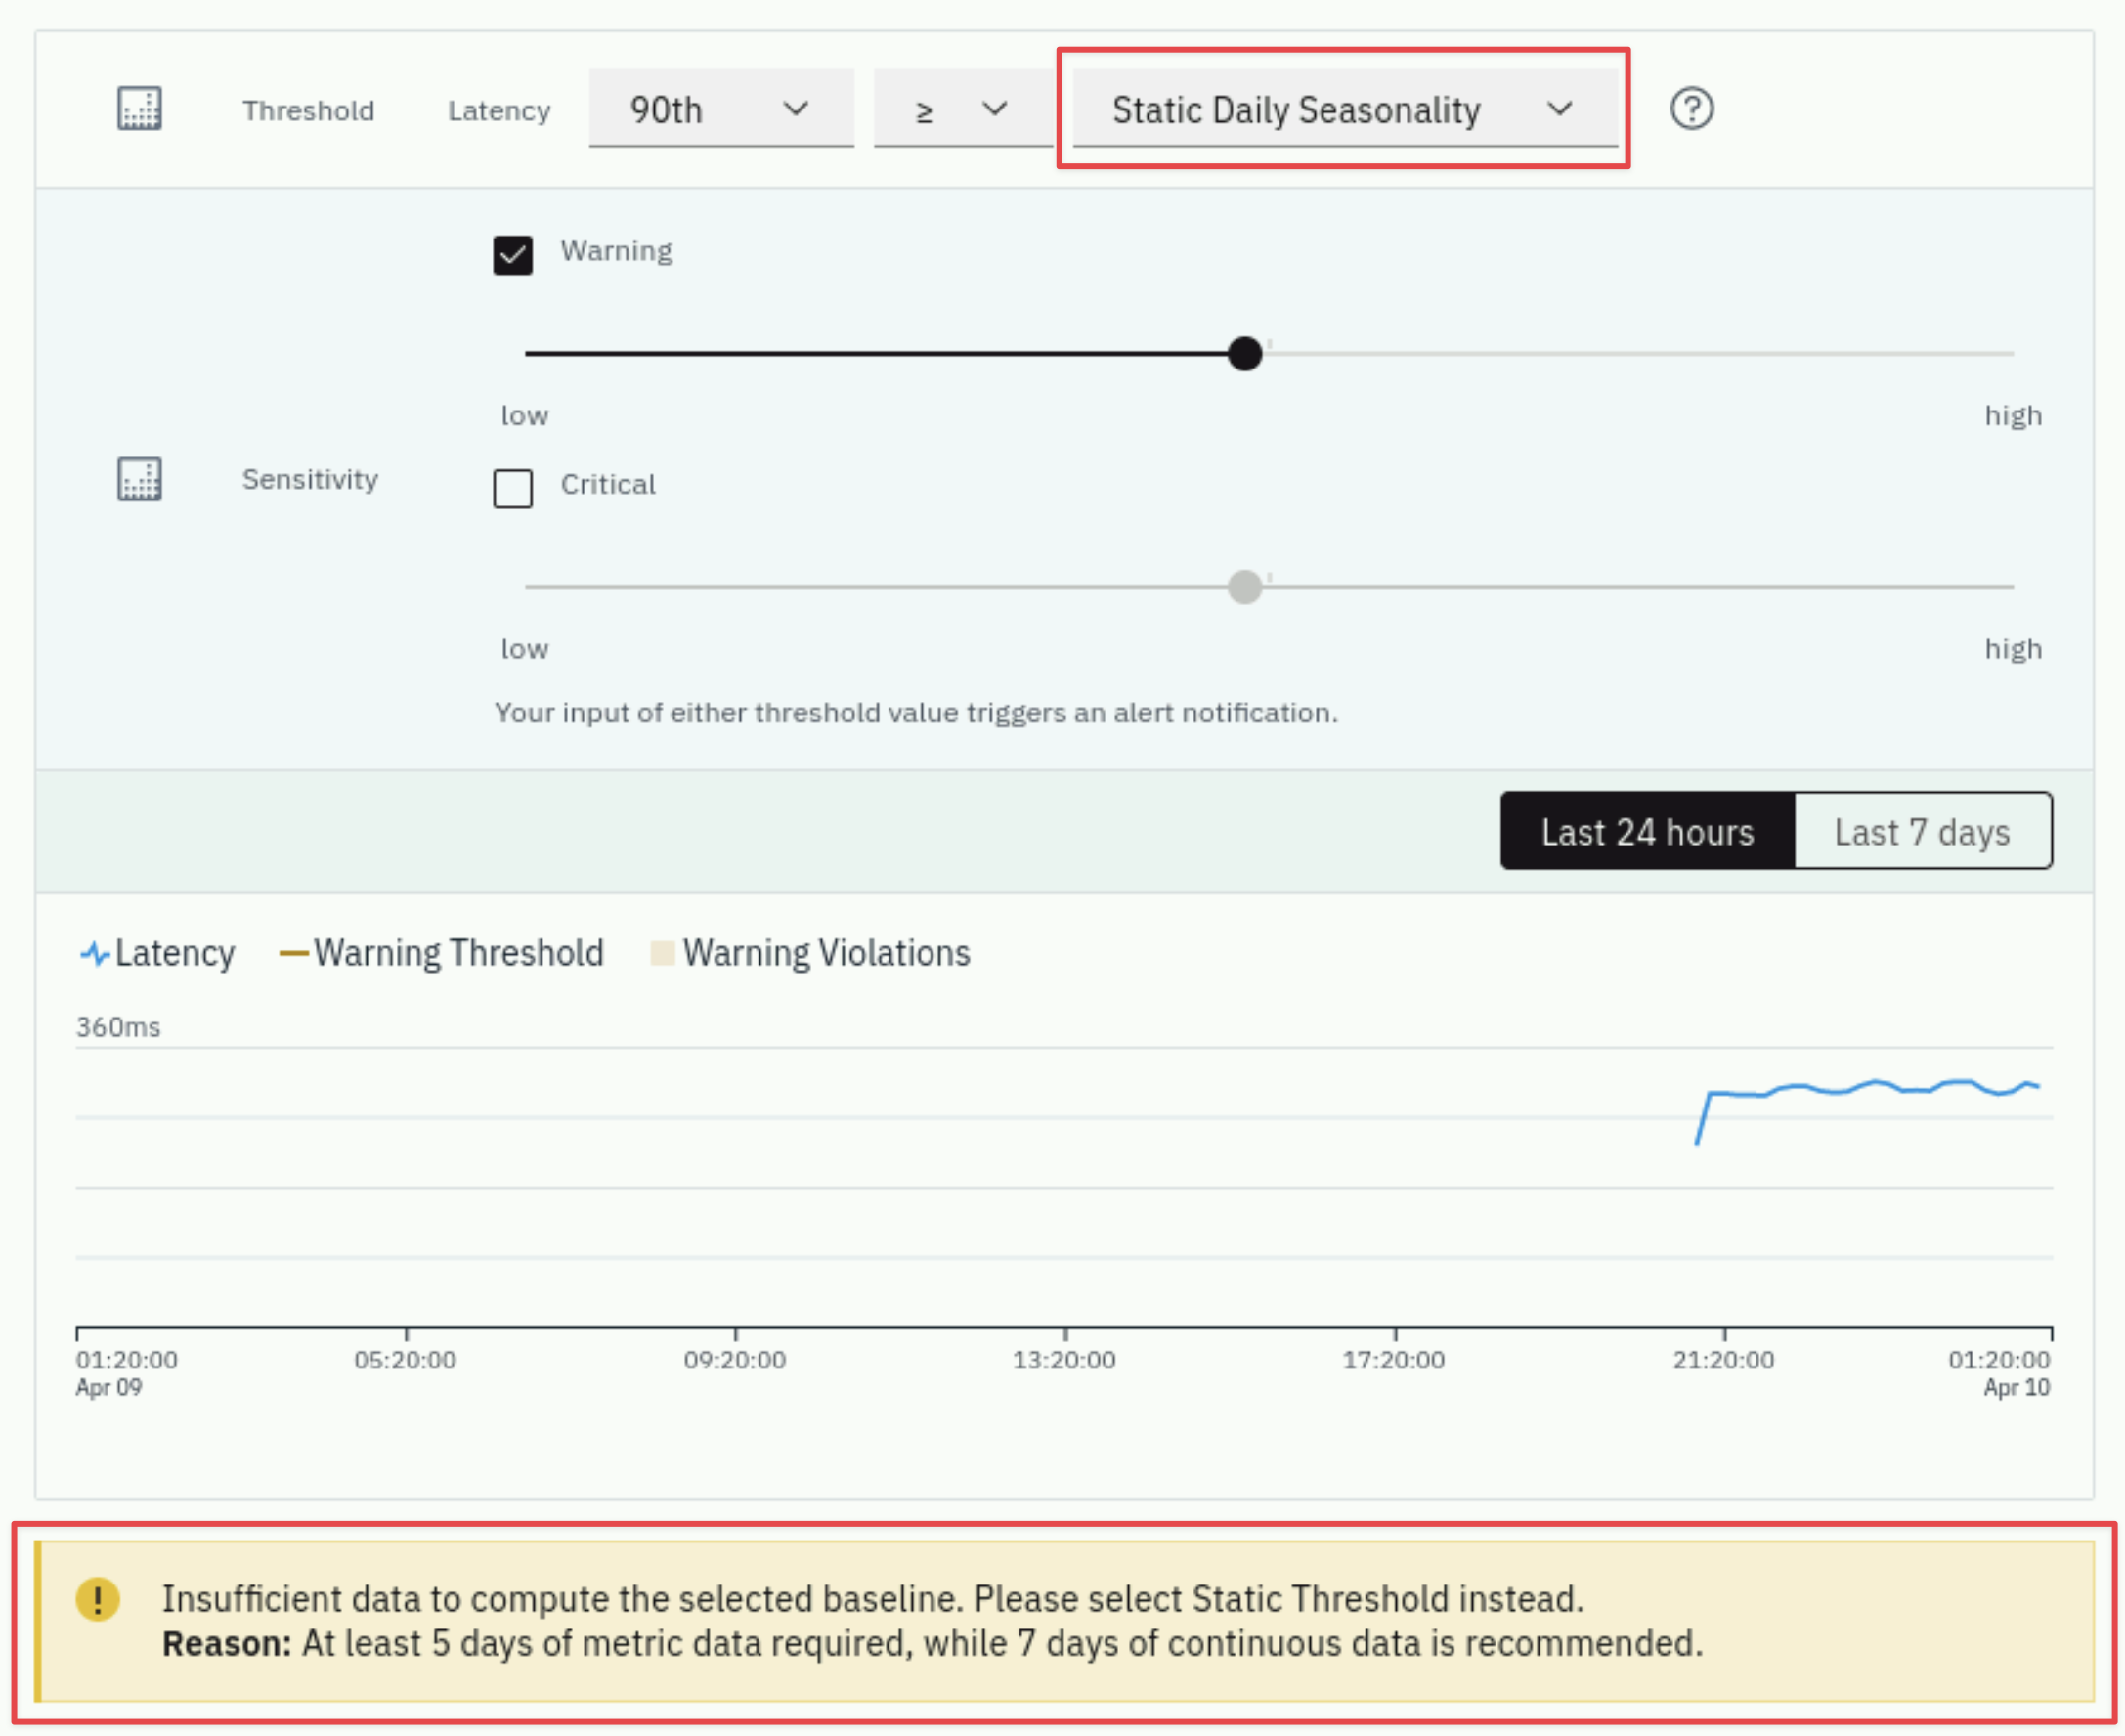
Scroll down further to the Thresholds section.
You'll notice that there are a variety of options including:
- The ability to change the percentile that is used for the evaluation
- The type of seasonality (static, daily, or weekly)
- whether you want to view the last 24 hours or 7 days of historical data
- Sensitivity.
You can try out some of the options, but keep in mind that analytics based thresholds will require 5 days of data and your system has only been running for a few hours. You will see the below warning until you have enough data.
Here is an example from an app that has been running longer. When you adjust the sensitivity, the number of red triangles shown on the screen will change. These red triangles indicate when thresholds would trigger if you had chosen that setting.
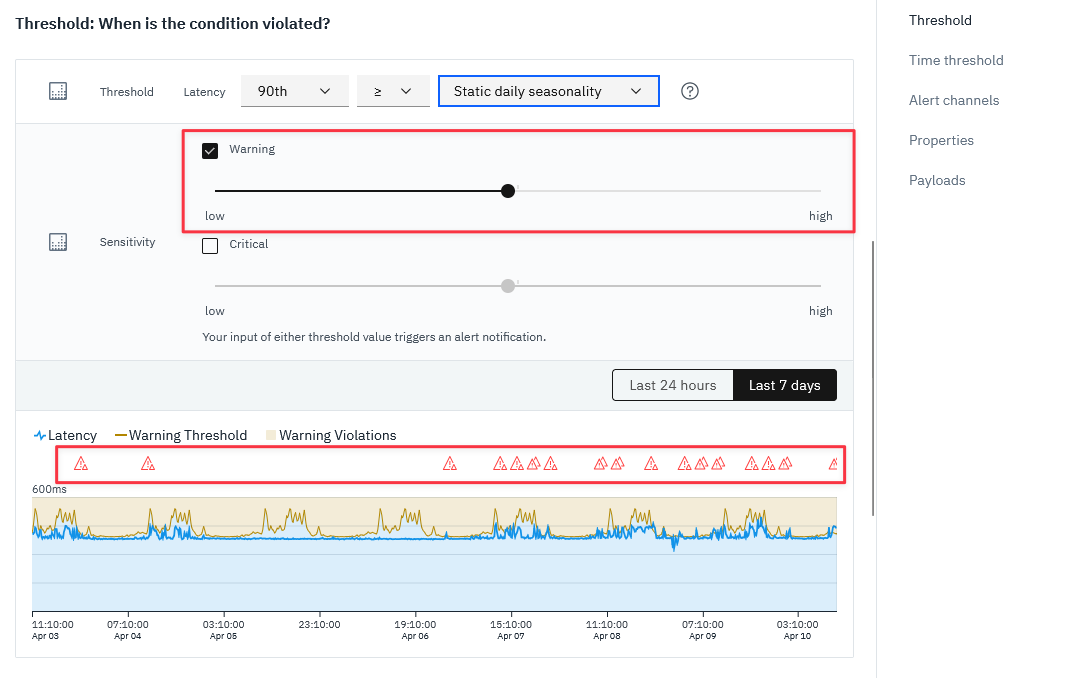
You don't want to receive a lot of alerts by setting the sensitivity too high. Usually, if you see more than 1 or two alerts per day, the sensitivity is probably too high. But, it depends on the historical data that you're looking at and the mission criticality of the application.
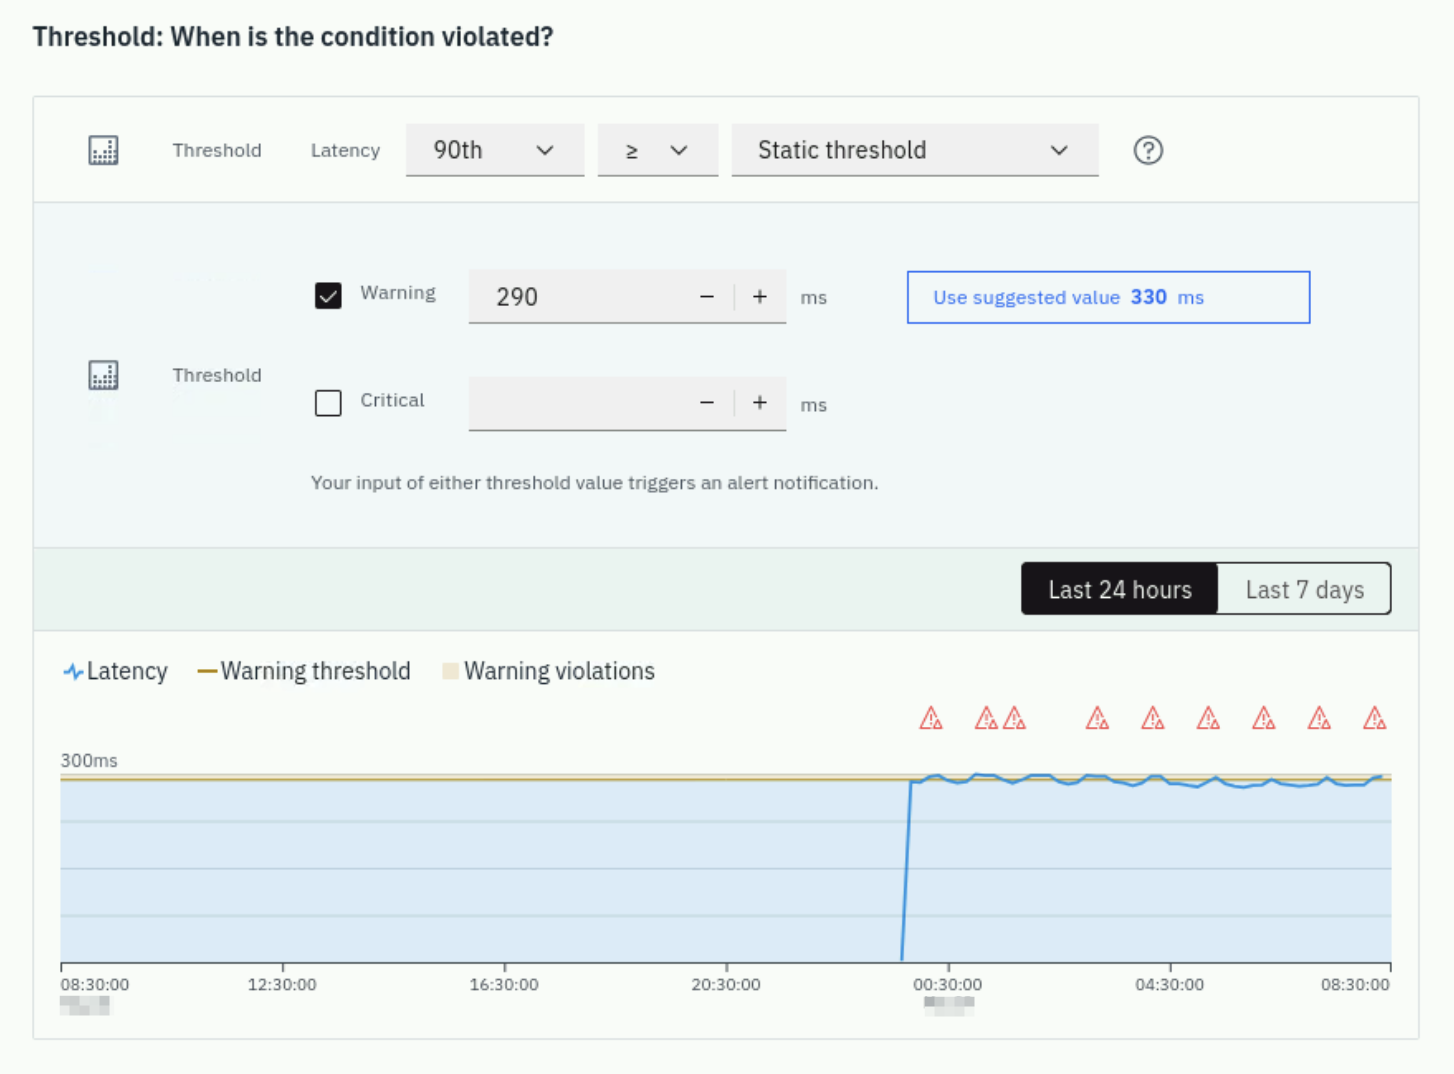
In our case we will leave the default as Static Threshold for this section
as we do not have enough historical data.
Usually, you can set the threshold by clicking on Use suggested value... which provides
the suggested value that is based on the discovered pattern. But for our demo case, to proactively
trigger alerts, let's update the warning threshold value to 290ms as in the screenshot below:
Scroll down further to the Time Threshold options.
You'll see that there are options for persistence over time. This ensures that the conditions trigger for a reasonable length of time before an alert is raised.
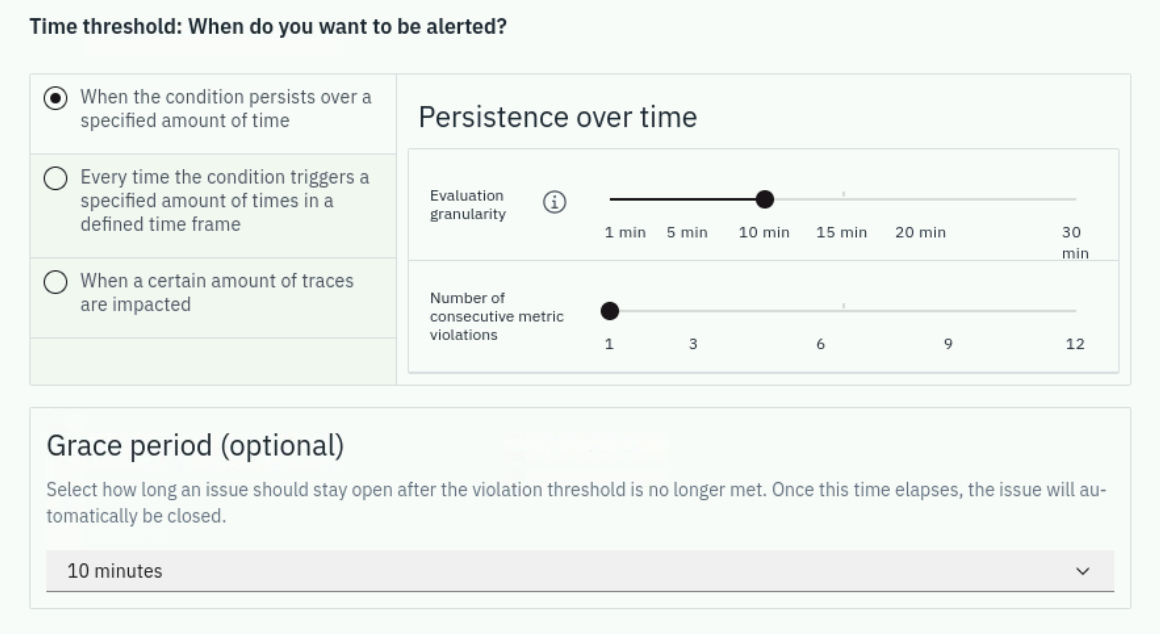
Understanding Grace Period:
The Grace Period is particularly important for dynamic metrics like response time, CPU utilization, and network performance. It prevents alert fatigue by ensuring that transient spikes don't trigger unnecessary alerts.
For example, if response time briefly spikes above the threshold but quickly returns to normal, the Grace Period prevents the issue from being closed and immediately reopened if another spike occurs within the grace period window. This is especially valuable in dynamic environments where metrics can fluctuate frequently.
We can leave this section as default too, let's set the Grace Period to 10 minutes, which means the issue will be automatically closed after the violation threshold is no longer met.
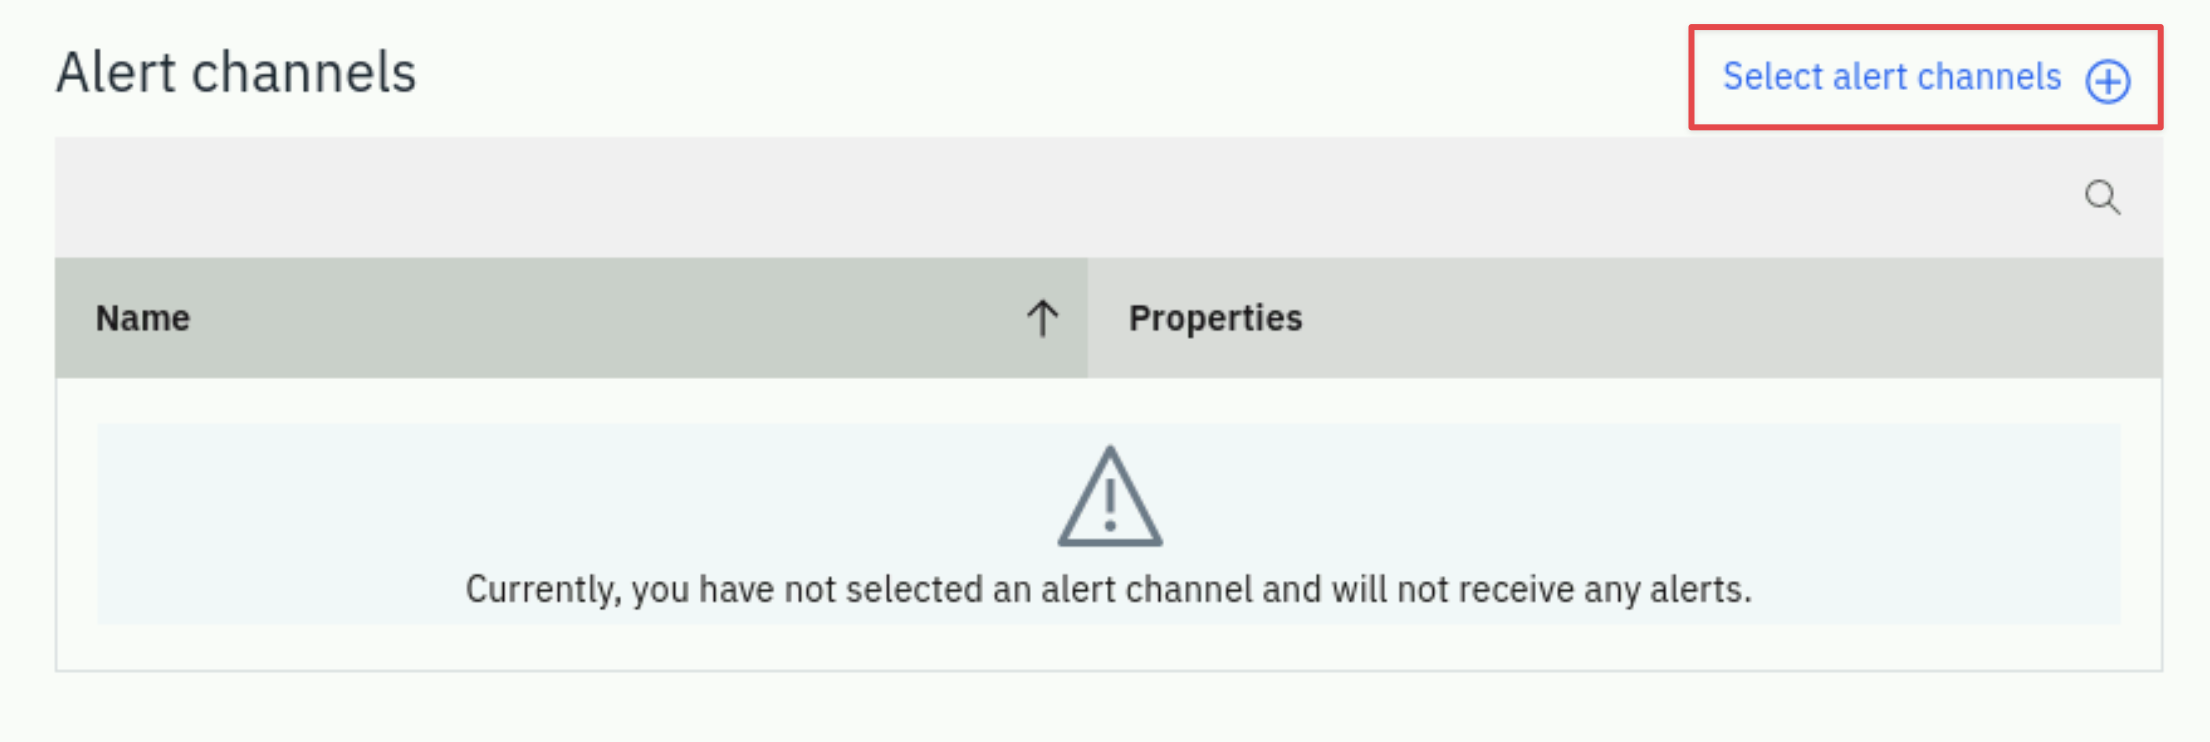
Scroll down further to the Alert Channel. Here we can select the Email Alert Channel that you created in the previous section.
Select the Select Alert Channels button.
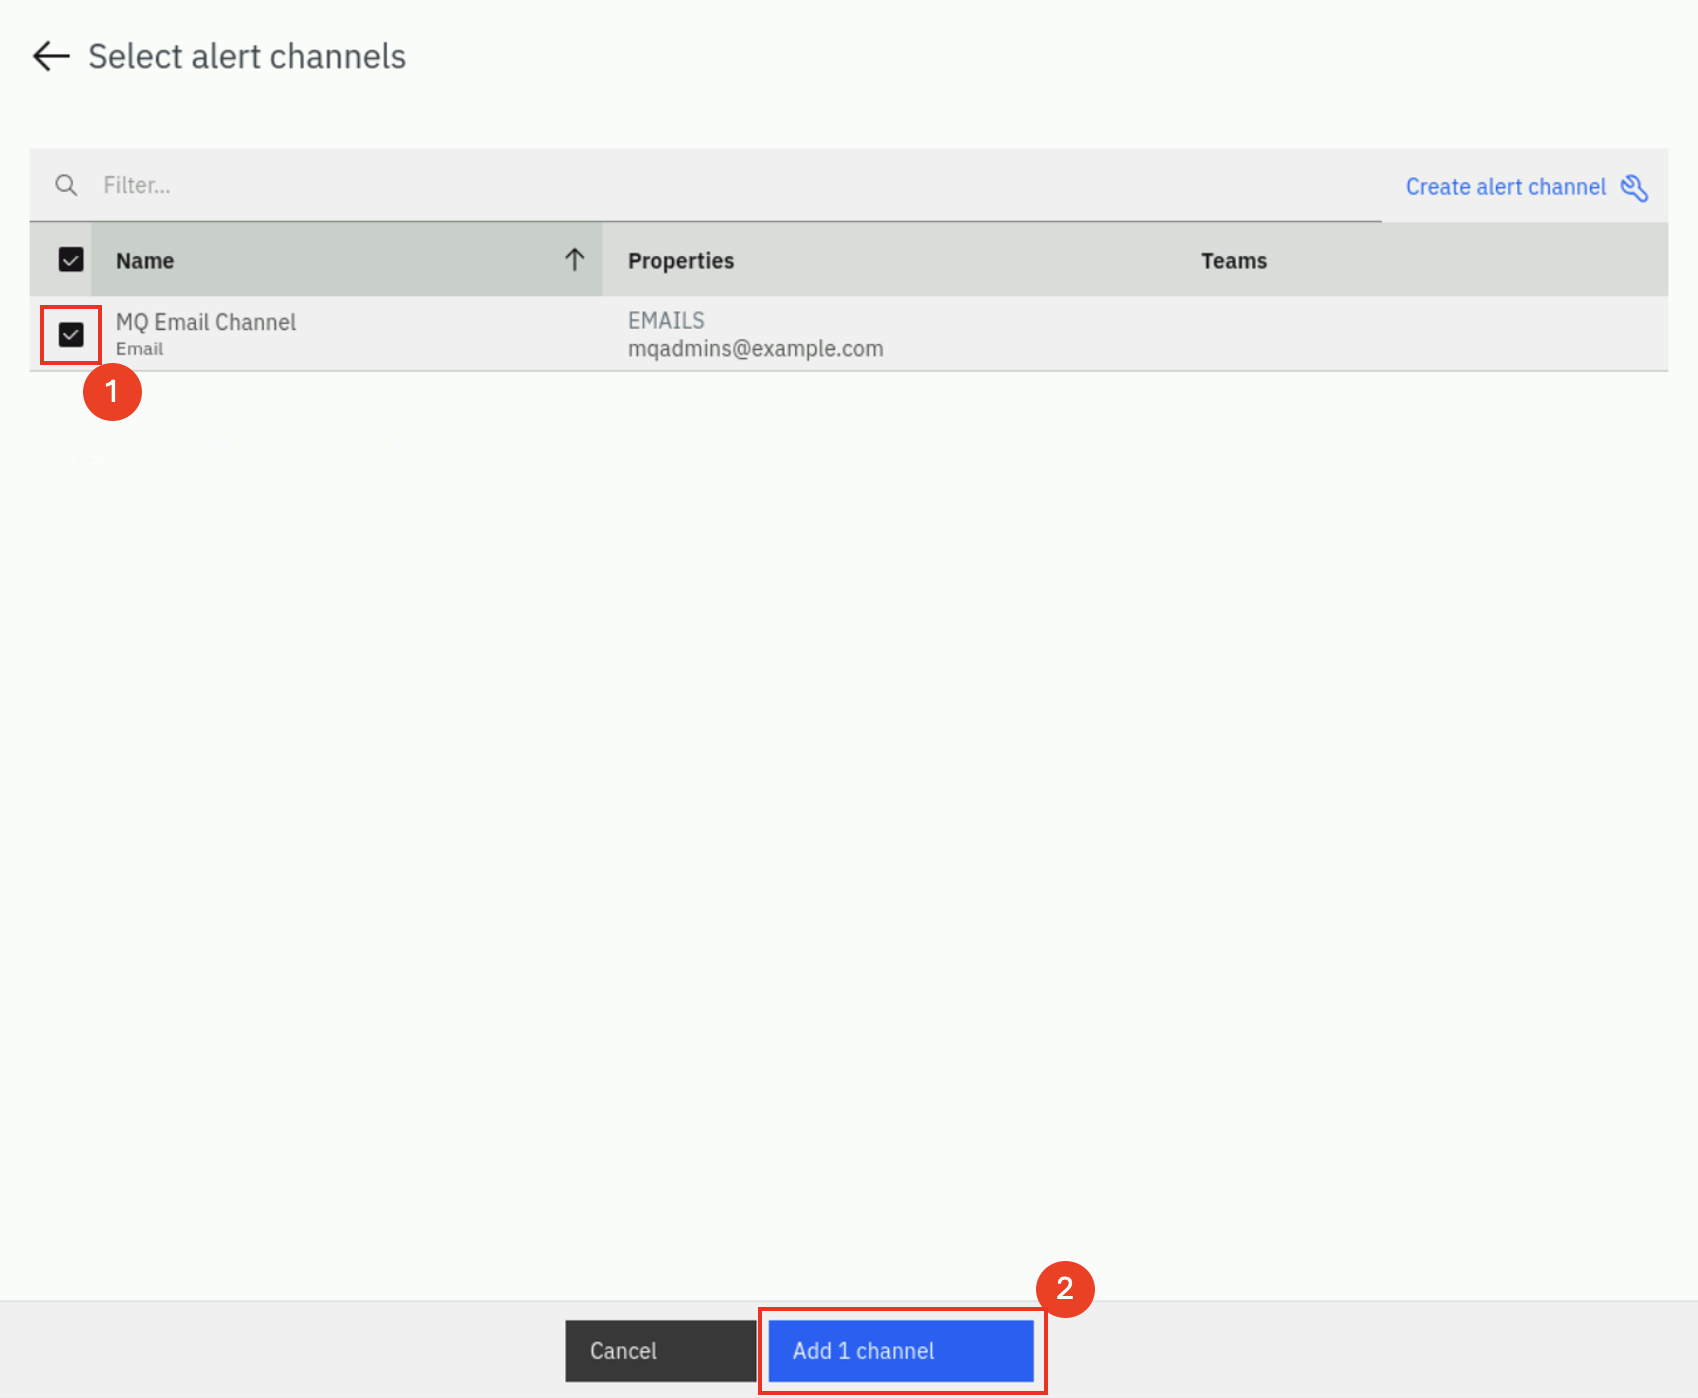
A dialog will open with the Alert Channel that you created earlier. Select the channel we set up earlier in this lab.
It is possible to select multiple Alert Channels. For example, you can notify people via Email and Slack. Or, let's assume there is a database event, you can notify the DBAs and you can notify that line of business that uses the database.
Scroll further down on the page and you'll see a section titled Additional Alert Properties
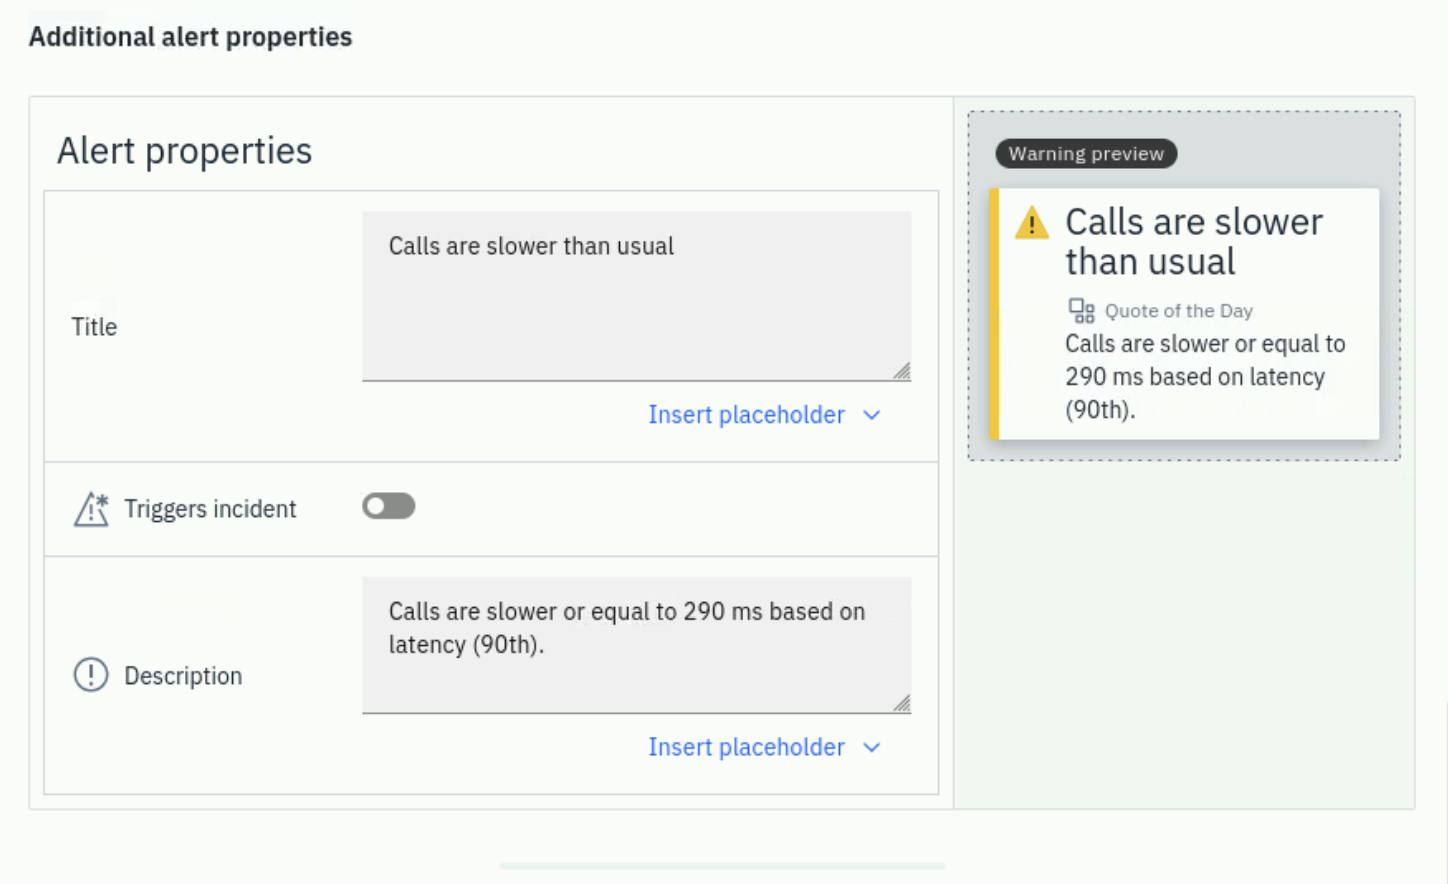
In this section you will notice that there is a default title and description. You can edit those fields and replace them with custom messages. As you type the Title and Description, the upper right corner will update with a sample of what the Event will look like when it triggers. There are other options such as setting the Alert Level and whether or not the Event should be aggregated into an Incident.
Triggering Incidents:
When you enable "Trigger Incident", Instana automatically correlates related Events and Issues into a single Incident. This correlation is based on:
- Host proximity: Events occurring on the same or nearby hosts
- Application relationships: Dependencies that Instana discovers between services and components
This intelligent correlation helps reduce alert noise by grouping related problems together, making it easier to understand the root cause and scope of issues.
Scroll further down on the page and you'll see a section titled Custom Payloads.
Let's add 2 rows of custom payload for this alert:
- A Static type of custom payload with a key of
alert_environmentand a value ofdemo - A Dynamic type of custom payload with a key of
alert_serviceand a value of Service > Name
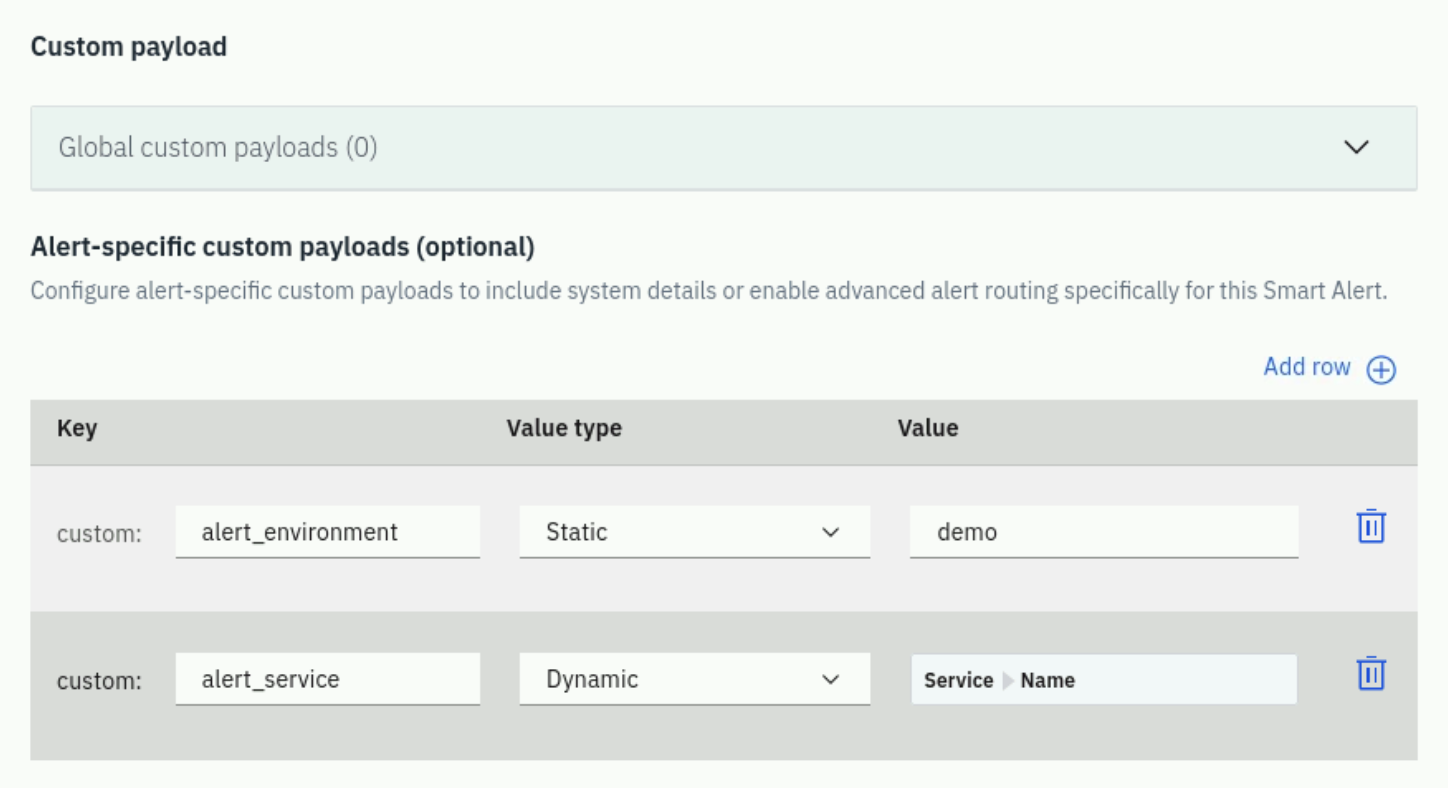
Custom Payloads:
Instana now supports Alert-specific custom payloads that can be configured to enrich the content of your alerts. Custom payloads allow you to include additional context-specific information in alert notifications, such as environment details, team contacts, or runbook links. This makes alerts more actionable by providing responders with the information they need immediately.
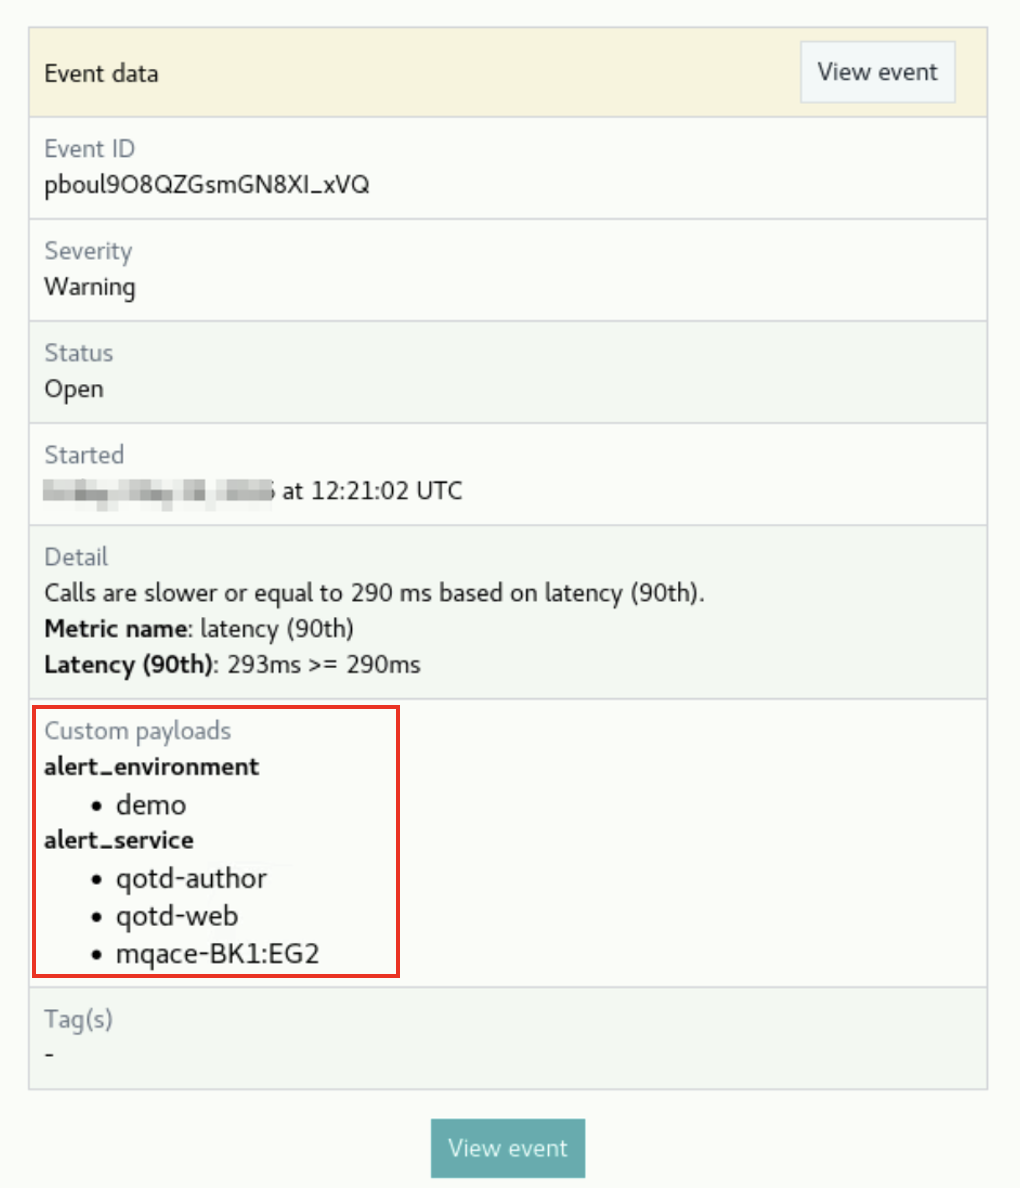
The custom payloads information can be displayed in the alert notification, like you can receive the following information in the email alert:
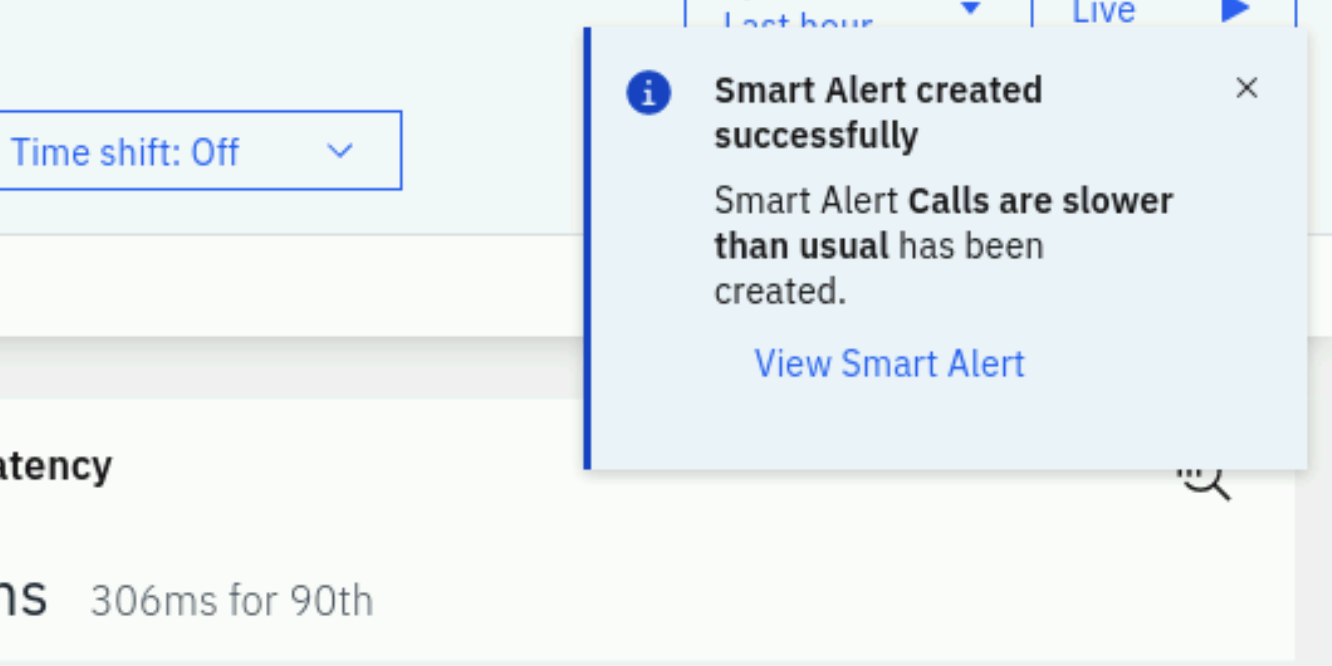
Fill in the fields as you desire. Then, click the Create button to create the Smart Alert
The Smart Alert dialog will close and you'll be back in the context of your application. You'll see a notification letting you know your Smart Alert has been created.
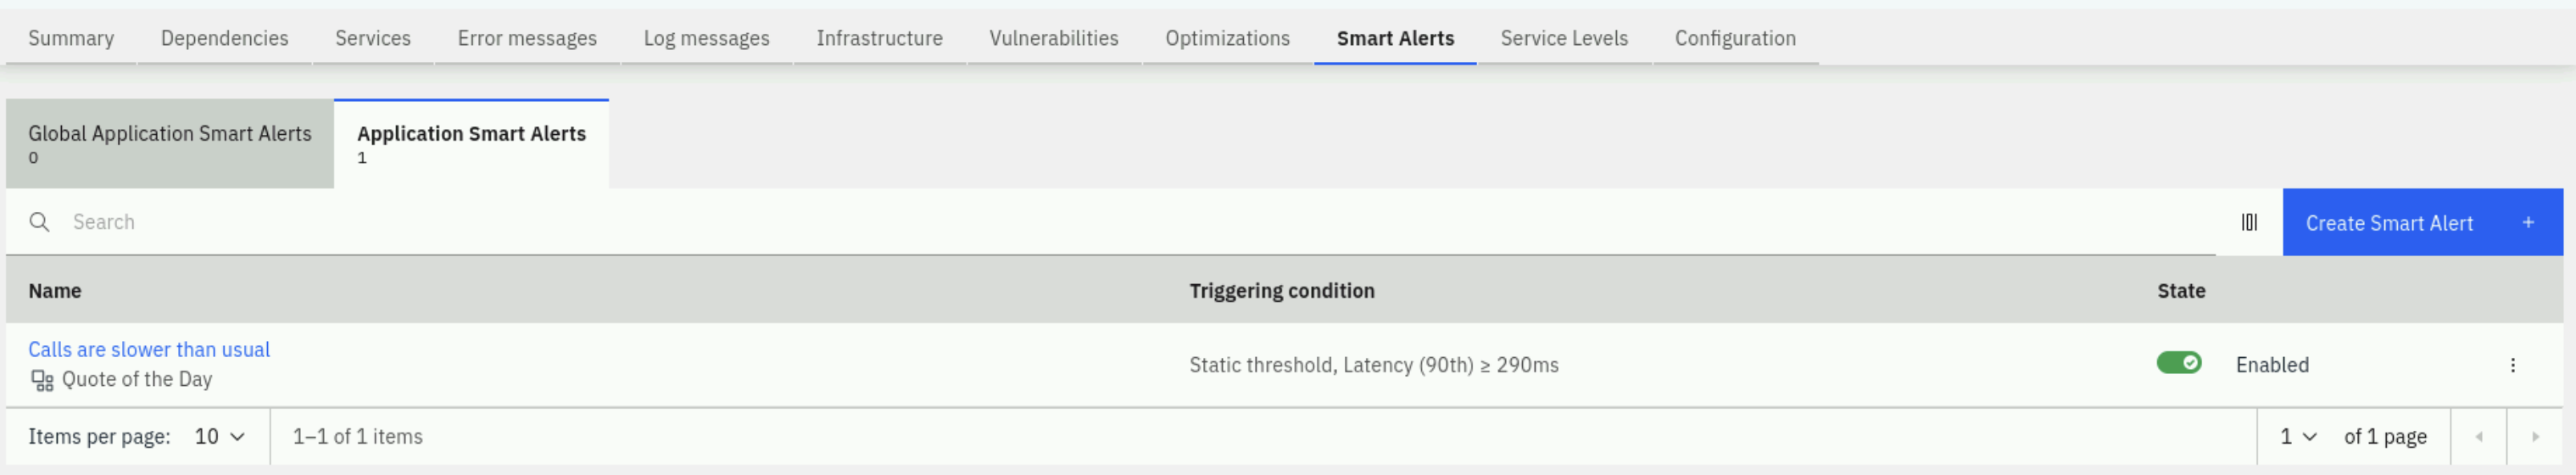
The Smart Alert you just created is now listed.
3.3: Create a Static Threshold (Event)
Now, let's examine how a more traditional threshold is created and used in conjunction with Alert Channels.
On the left side of the screen, select the Settings gear.
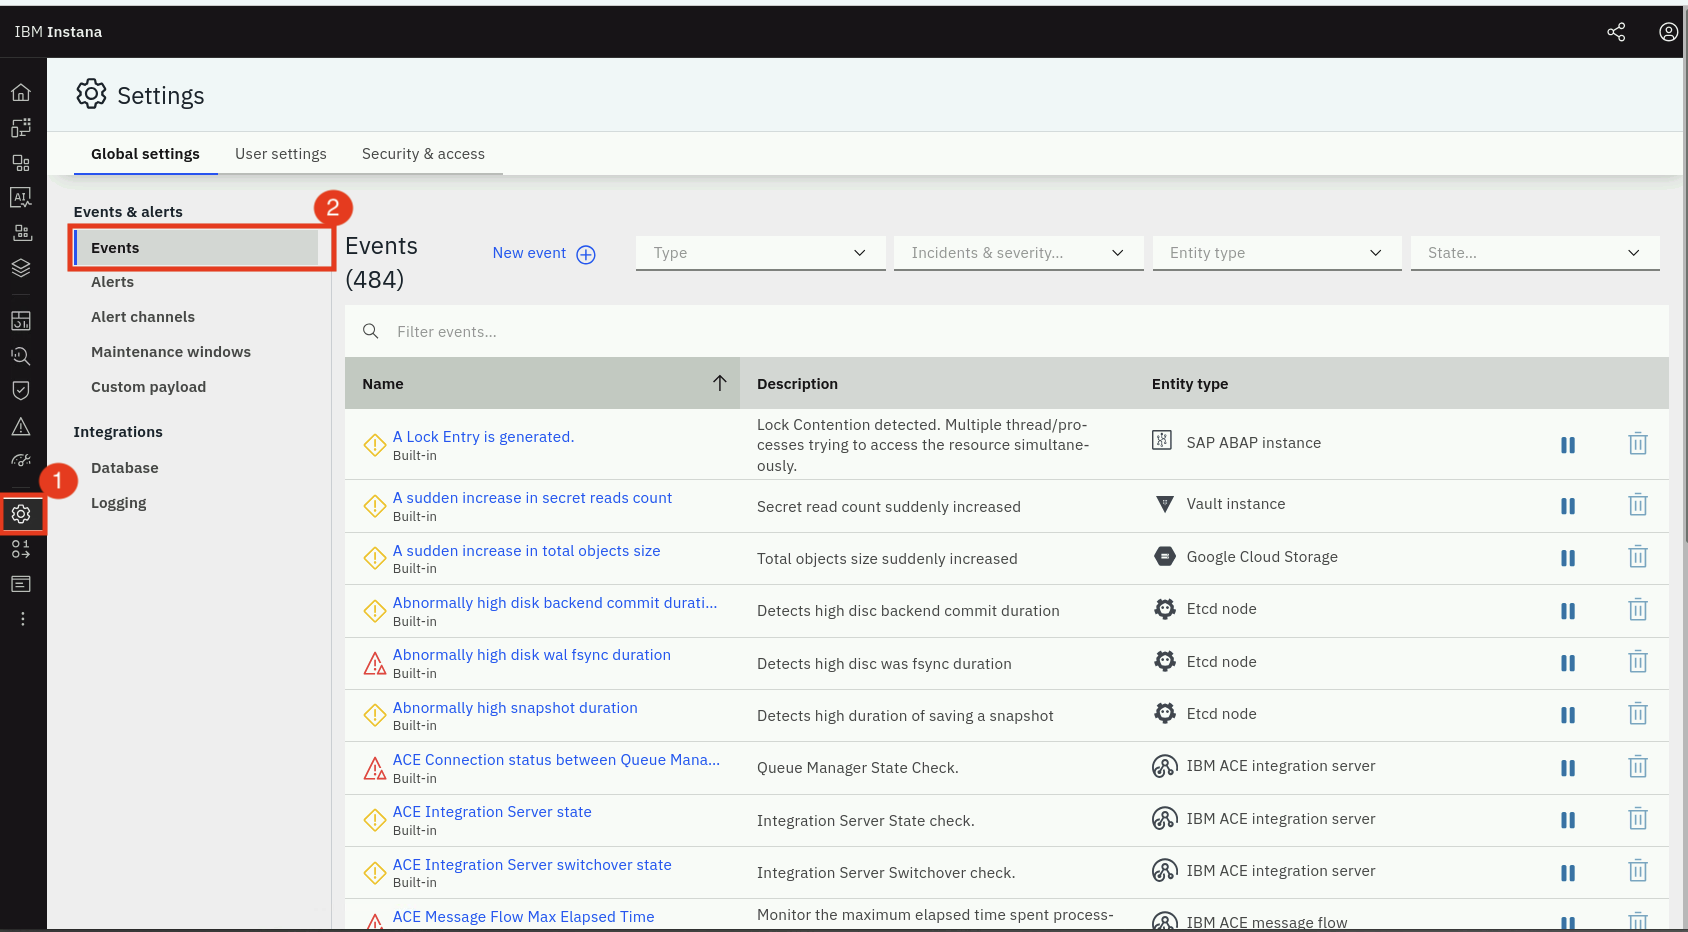
The Settings menu provides access to most of the administrative tasks within Instana. You'll notice menus for Events, Alerts, Alert Channels, API Tokens, Users, Groups, Log Management Integration, and more.
Ensure Events is selected
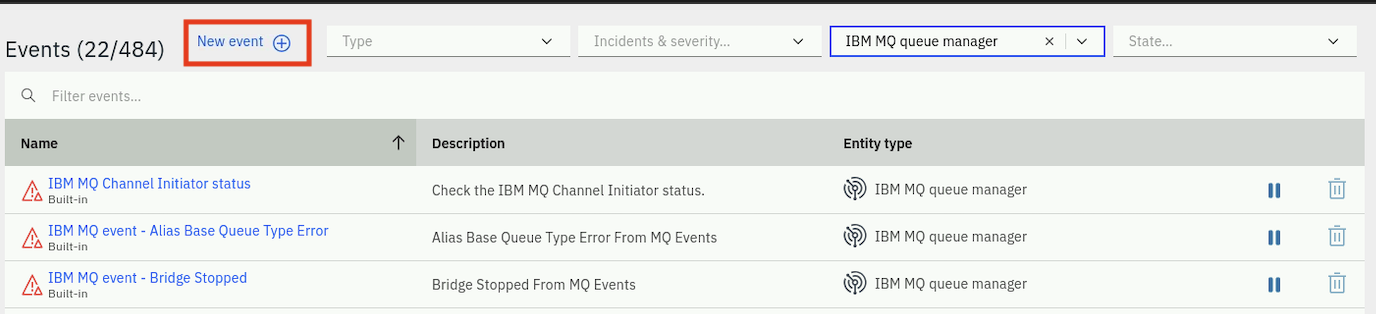
You will see a list of nearly 500 Events that are defined as out of the box thresholds within Instana. If you want to filter the list, you can do that in a number of ways via the drop down lists at the top of the page.
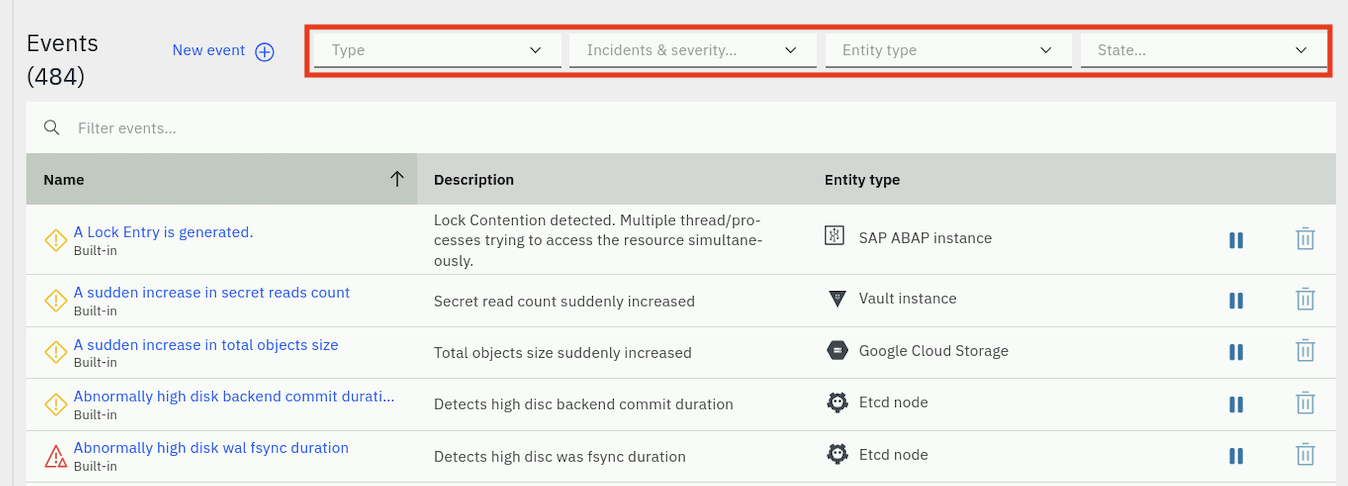
Notice that you can filter based on the Event type, severity, entity type, state, or simply enter a keyword filter.
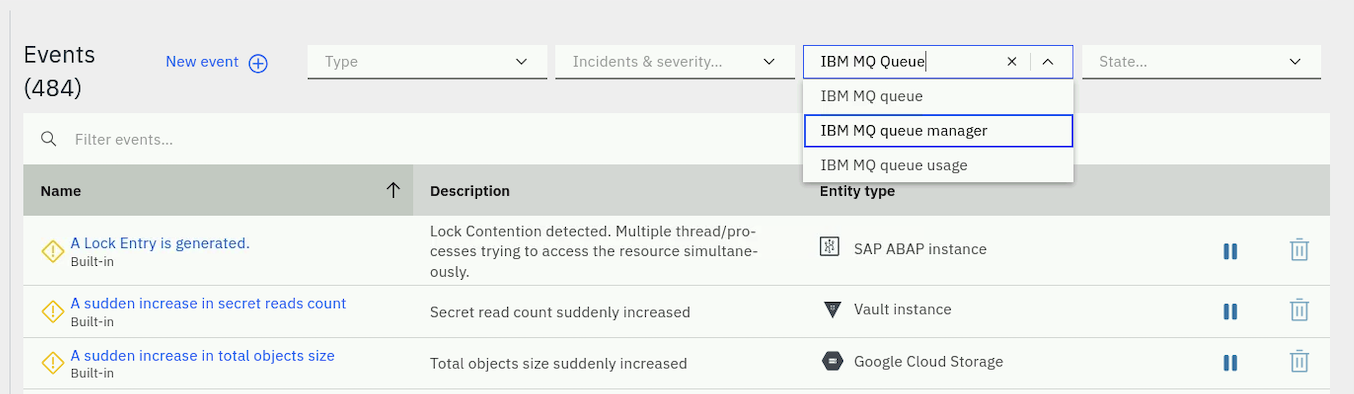
Select the Entity Type dropdown list and type IBM MQ into the field.
You'll notice that a few different options show up. Each of the options is an
Entity Type. You can filter on the Events related to the IBM MQ Queue Manager,
Queue, Channel, etc.
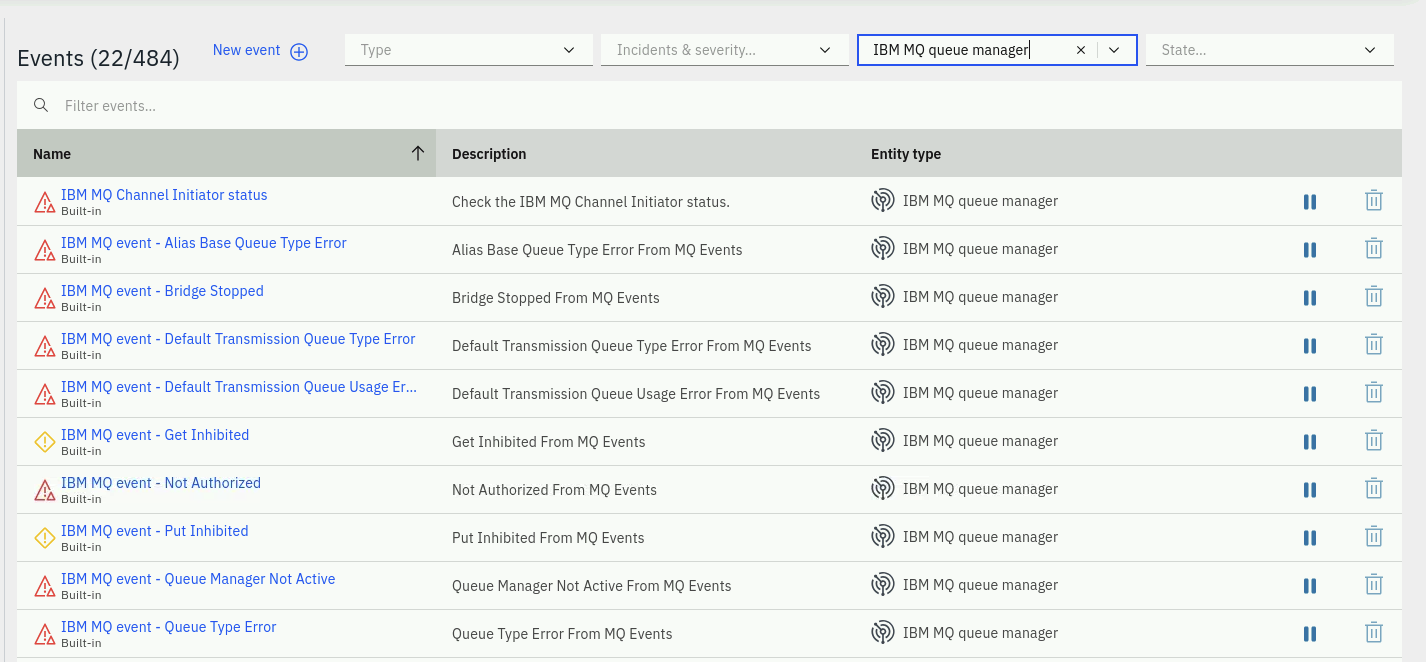
Select IBM MQ Queue Manager from the dropdown list.
This will filter the Events to the list of Events that are written against the IBM MQ Queue Manager entity type. There are several out of the box threshold Events that will detect things like channel initiator status, queue manager status, publish/subscribe engine status, and more.
Let's create a new Event now.
At the top of the page, select the New Event button.
Fill in the following information for the new Event Event Details section:
- Give your Event a name, for example,
IBM MQ Queue Depth - Enter a description for the Event, for example,
Queue depth event - Select Critical severity
- Select the option of whether you want your Event to get correlated into Incidents
- Select a Grace Period.
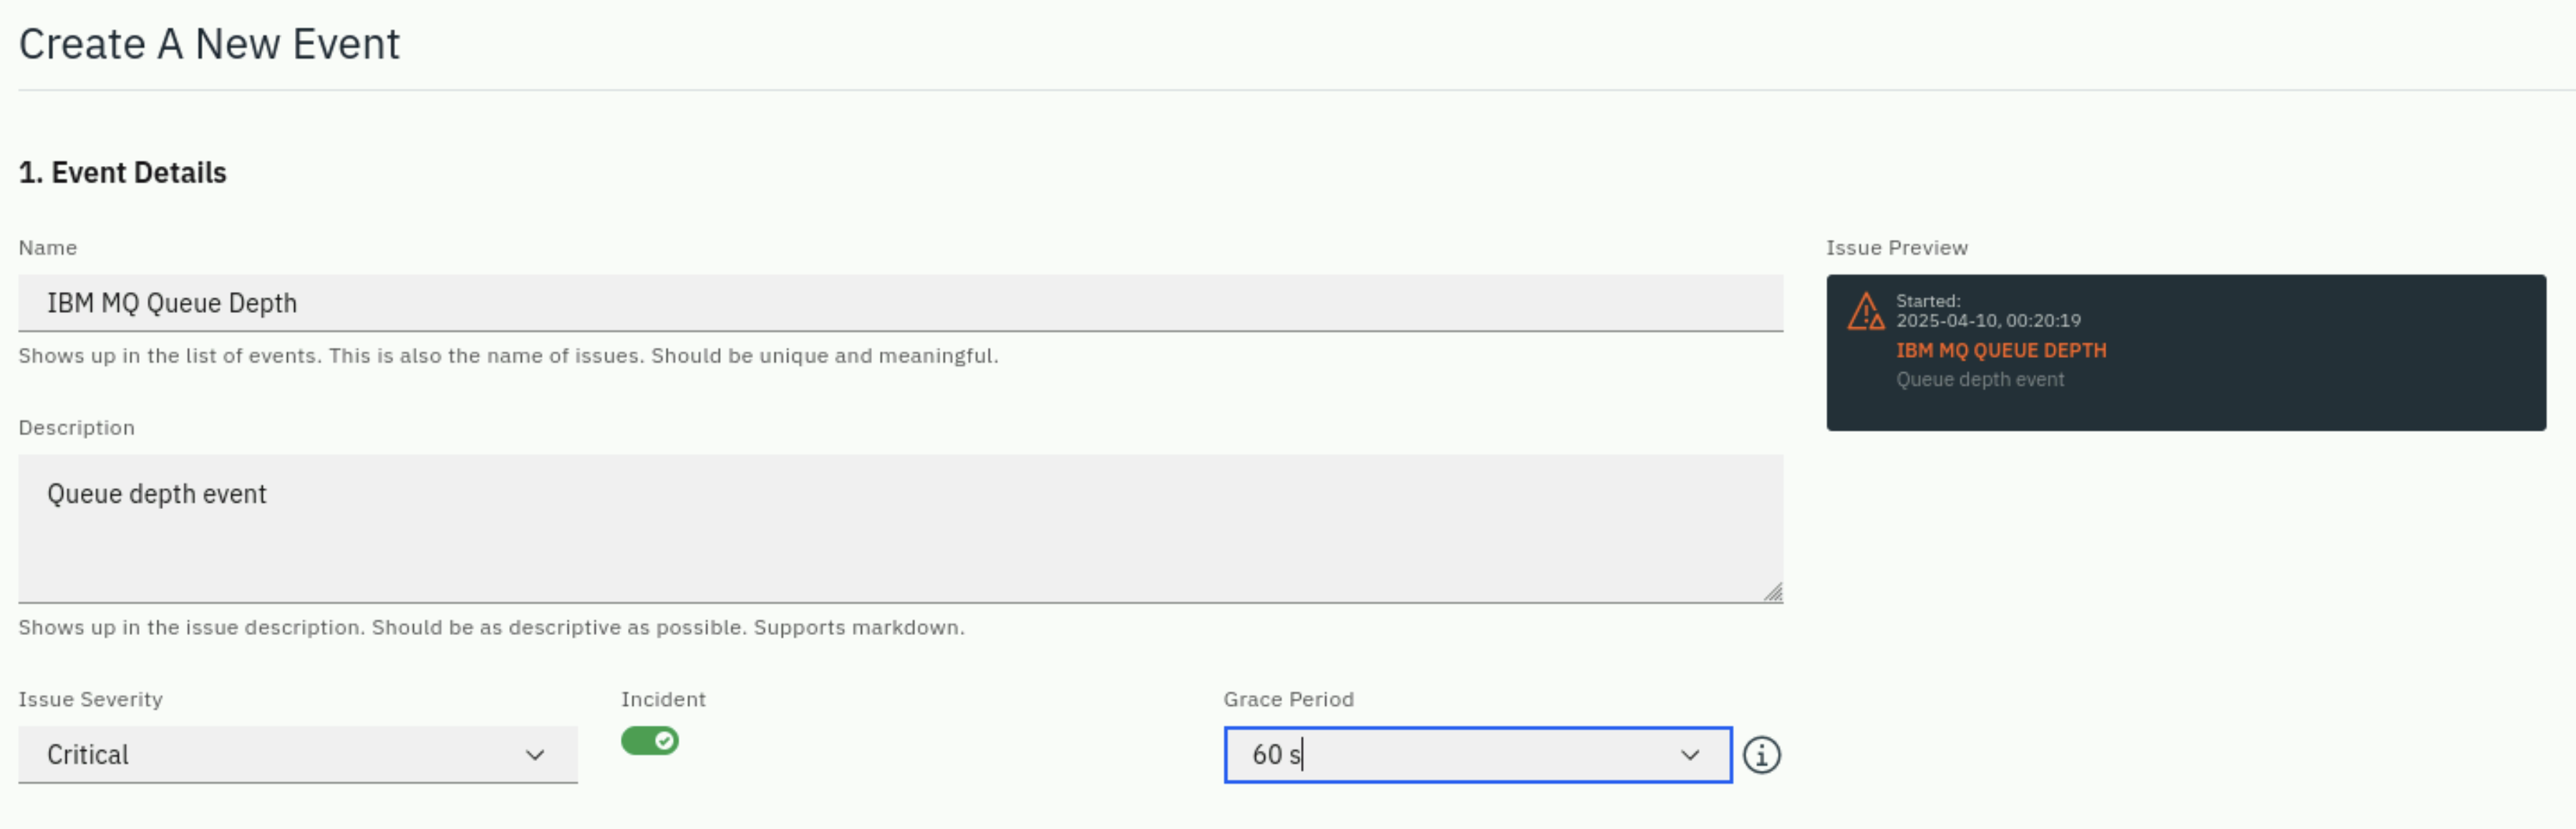
The Grace Period is a capability that delays the closing of an issue. If a server's CPU goes High (triggering an issue) and then drops back to normal, Instana waits for the duration of the Grace Period before resolving it. If the CPU goes High again within this period, the original issue remains open, preventing it from being closed and immediately reopened as a new alert.
Fill in the following information for the Condition section:
Select the dropdown and choose Built-in Metrics. Most of your thresholds will be written against these Built-in Metrics.
The choice of Custom metrics usually applies to custom metrics that are being fed into Instana via OpenTelemetry, Prometheus, or StatsD etc. These are common methods for ingesting application-specific or business metrics that aren't automatically collected by Instana's sensors. The System Rules are a specialized set of rules for doing things like detecting that an entity is offline.
Once you select Built-in Metrics another dropdown list will appear. The new dropdown list is asking for the Entity type that you are going to write your threshold against.
In the Entity type dropdown, select IBM MQ Queue. Notice that you can
type in letters such as IBM MQ to filter the list. The Time Window is the
duration that you want to monitor and evaluate, set this to 60 s.
After specifying an Entity type, a new dropdown appears with a list of available Metrics. Select the Metric dropdown and choose Depth > Queue Depth Percentage.
After selecting the Metric some new dropdowns appear on the screen looking for the following information:
- Aggregation: Since Instana captures data at a high interval, you can use
Min, Max, Avg, Sum as part of your evaluation.
- Relative Difference: Compares the current value to a baseline (e.g., 20% higher than normal)
- Absolute Difference: Compares the absolute change in value (e.g., increased by 100ms)
- Operator: What type of evaluation do you want to do (greater than, less than, equals, etc.)
- Percentage: This field is actually different depending on the metric you are evaluating. In this case, you are evaluating a metric that is a percentage.
Set the following:
- Aggregation: max
- Operator: >
- Percentage: 90.
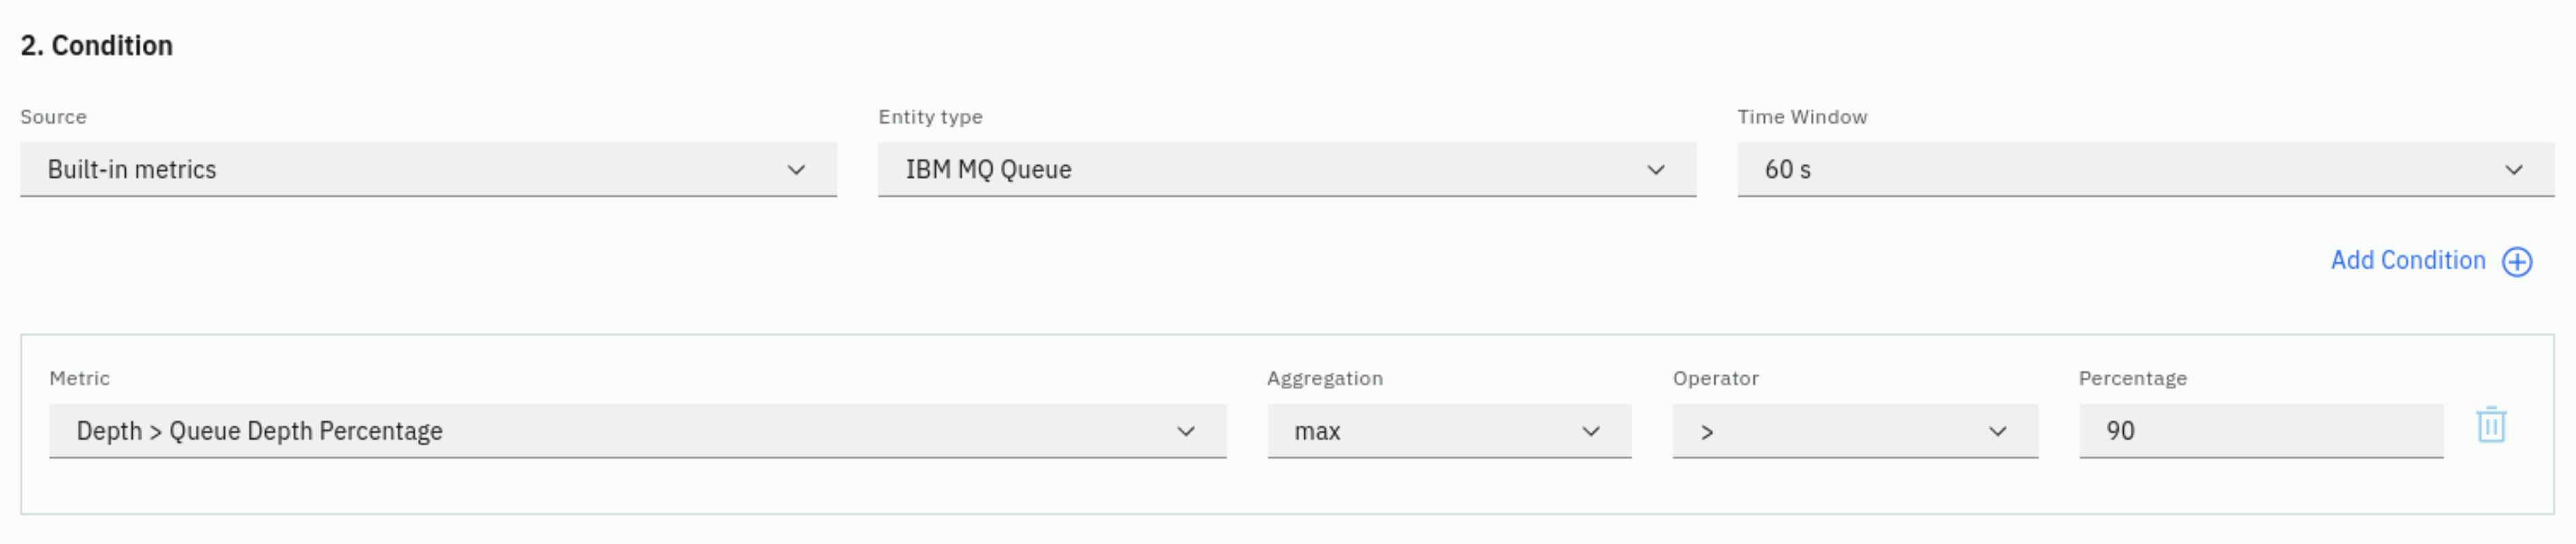
These settings will cause the threshold to evaluate the Queue Depth Percent for 60 seconds and determine whether the maximum value during that interval exceeded 90%. If it did exceed 90%, then the Event will trigger.
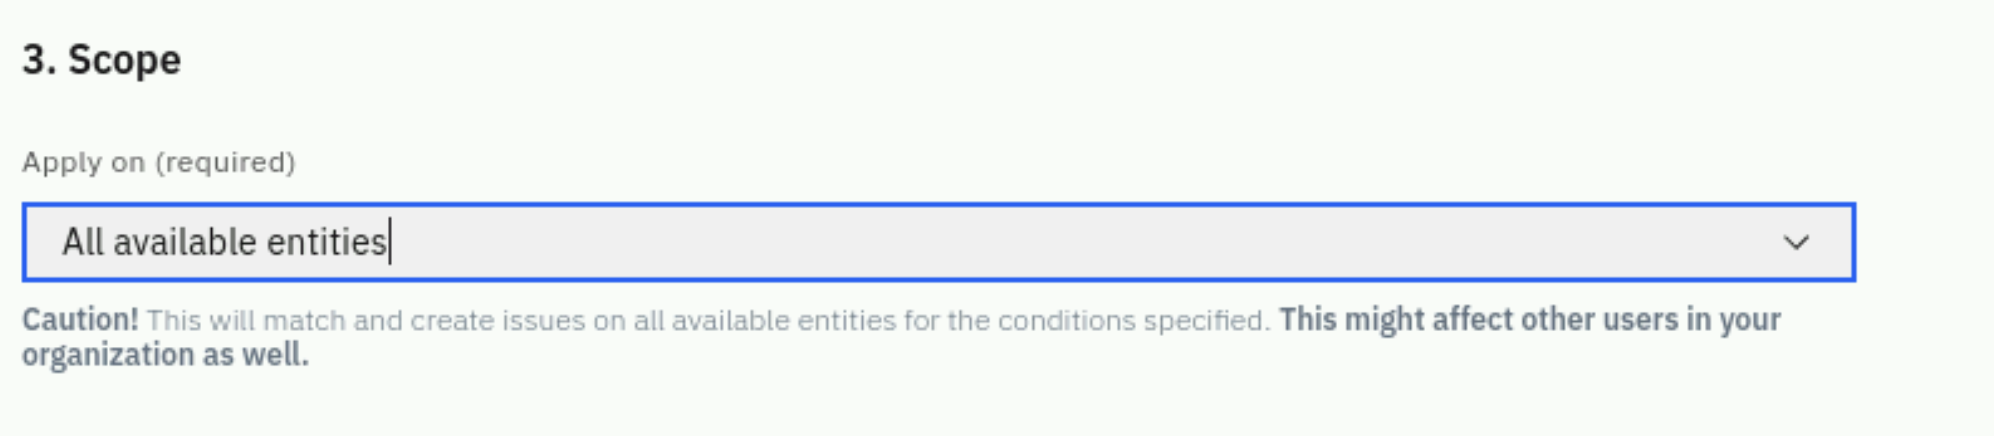
Finally, you now have to select the Scope that this threshold will apply to.
Select the dropdown list. In the dropdown list, you'll see the following options:
- You have the option of applying this threshold to an Application Perspective. This would limit the scope of the threshold to a specific application.
- You can use a Dynamic Focus Query to filter to a specific list of MQ Queues.
- Or, you can have your threshold apply to All Available Entities.
Let's make this a global Event and choose the All Available Entities option.
You can configure transient events during the definition of the event. Transient Events is a noise reduction feature. Instead of alerting you immediately for every blip, Instana uses historical data to predict if an issue will self-resolve quickly. If it predicts the issue is short-lived, it suppresses the alert notification to prevent mailbox fatigue.
We'll disable Transient Events for this Event so that you can see the alert trigger immediately when the threshold is breached.
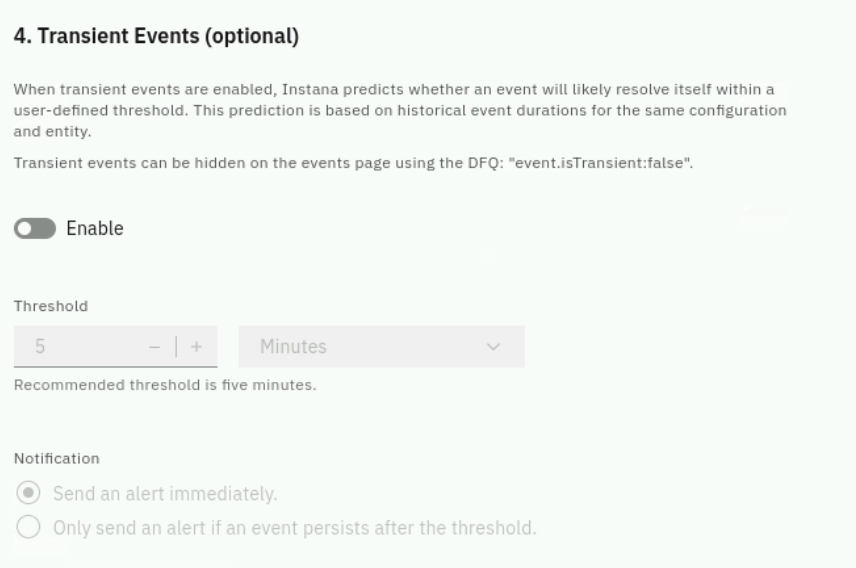
Following section provides instructions on how to configure and use Transient Events for noise reduction.
How to Configure and Use Transient Events
1. Enable the Feature
- Action: Turn on the feature toggle (enabled by default).
- What it does: Instana will start analyzing newly triggered events against historical patterns and label them as Transient if they are predicted to be short-lived. (Note: Simply enabling this will not stop alerts, it only labels them).
2. Set the Transient Threshold
- Action: Define a time window (e.g., 5 minutes or 10 minutes).
- Rule of thumb: Set this to the maximum amount of time you are willing to wait before an issue genuinely requires human intervention. If an event is predicted to last less than this threshold, it is treated as a transient event.
3. Choose Notification Behavior
To effectively eliminate noise, change the default notification behavior:
- Select:
Only send an alert if an event persists after the threshold - How it works:
- If an event triggers but Instana predicts it will self-resolve within 5 minutes -> Instana holds back (suppresses) the notification.
- If it self-resolves within 5 minutes -> No alert is ever sent. (Noise reduced!)
- If it outlasts the 5-minute threshold -> Instana fires the alert because it is a real persistent issue.
Click the Create button to save your new Event.
Dynamic Focus Queries (DFQ):
A Dynamic Focus Query allows you to filter the distribution down to a subset of target resources. For example, you could specify:
- Specific queues or queue managers
- Specific hosts or clusters
- Resources with custom tags
- Any combination using AND, OR, NOT operators
If you wanted to apply your Event to a subset of the MQ Queues, you would specify a Dynamic Focus Query. The query would look something like this:
entity.ibmmq.queue.name:abc* OR entity.ibmmq.queue.name:*xyz
The Event UI now provides guided assistance in building DFQs, making it easier to construct complex queries without needing to manually type Lucene syntax.
A Dynamic Focus Query can be a complex expression using AND, OR, NOT, etc. to filter to a subset of the entities. These queries are built using the Lucene query language. For more information on the Lucene query language, see the project documentation: Lucene's Query Language
3.4: Setting up an Offline Event
A common monitoring scenario is to setup an Offline Event to detect an Entity going offline. We're going to create an Event that will detect when an IBM MQ Queue Manager goes offline.
To do this, select New Event again.
Enter the name Queue Manager Offline.
Enter the description An IBM MQ Queue Manager has gone offline.
Select a Grace Period of 10s.
Select System Rules as the Source under 2. Condition. Then, select Offline event detection for the System Rule
Next, select the scope. Choose Selected Entities Only (Dynamic Focus Query).
In the Dynamic Focus Query, you are going to specify a filter for IBM MQ Queue Managers. We want to detect when any Queue Manager goes offline. Enter the following query:
entity.selfType:ibmmq.qm
We use entity.selfType instead of entity.type because the former filters only the specific entity type without including child entities. This ensures we're monitoring only the Queue Manager itself, not all the queues, channels, and other entities associated with it.
Your Offline Event should look like this:
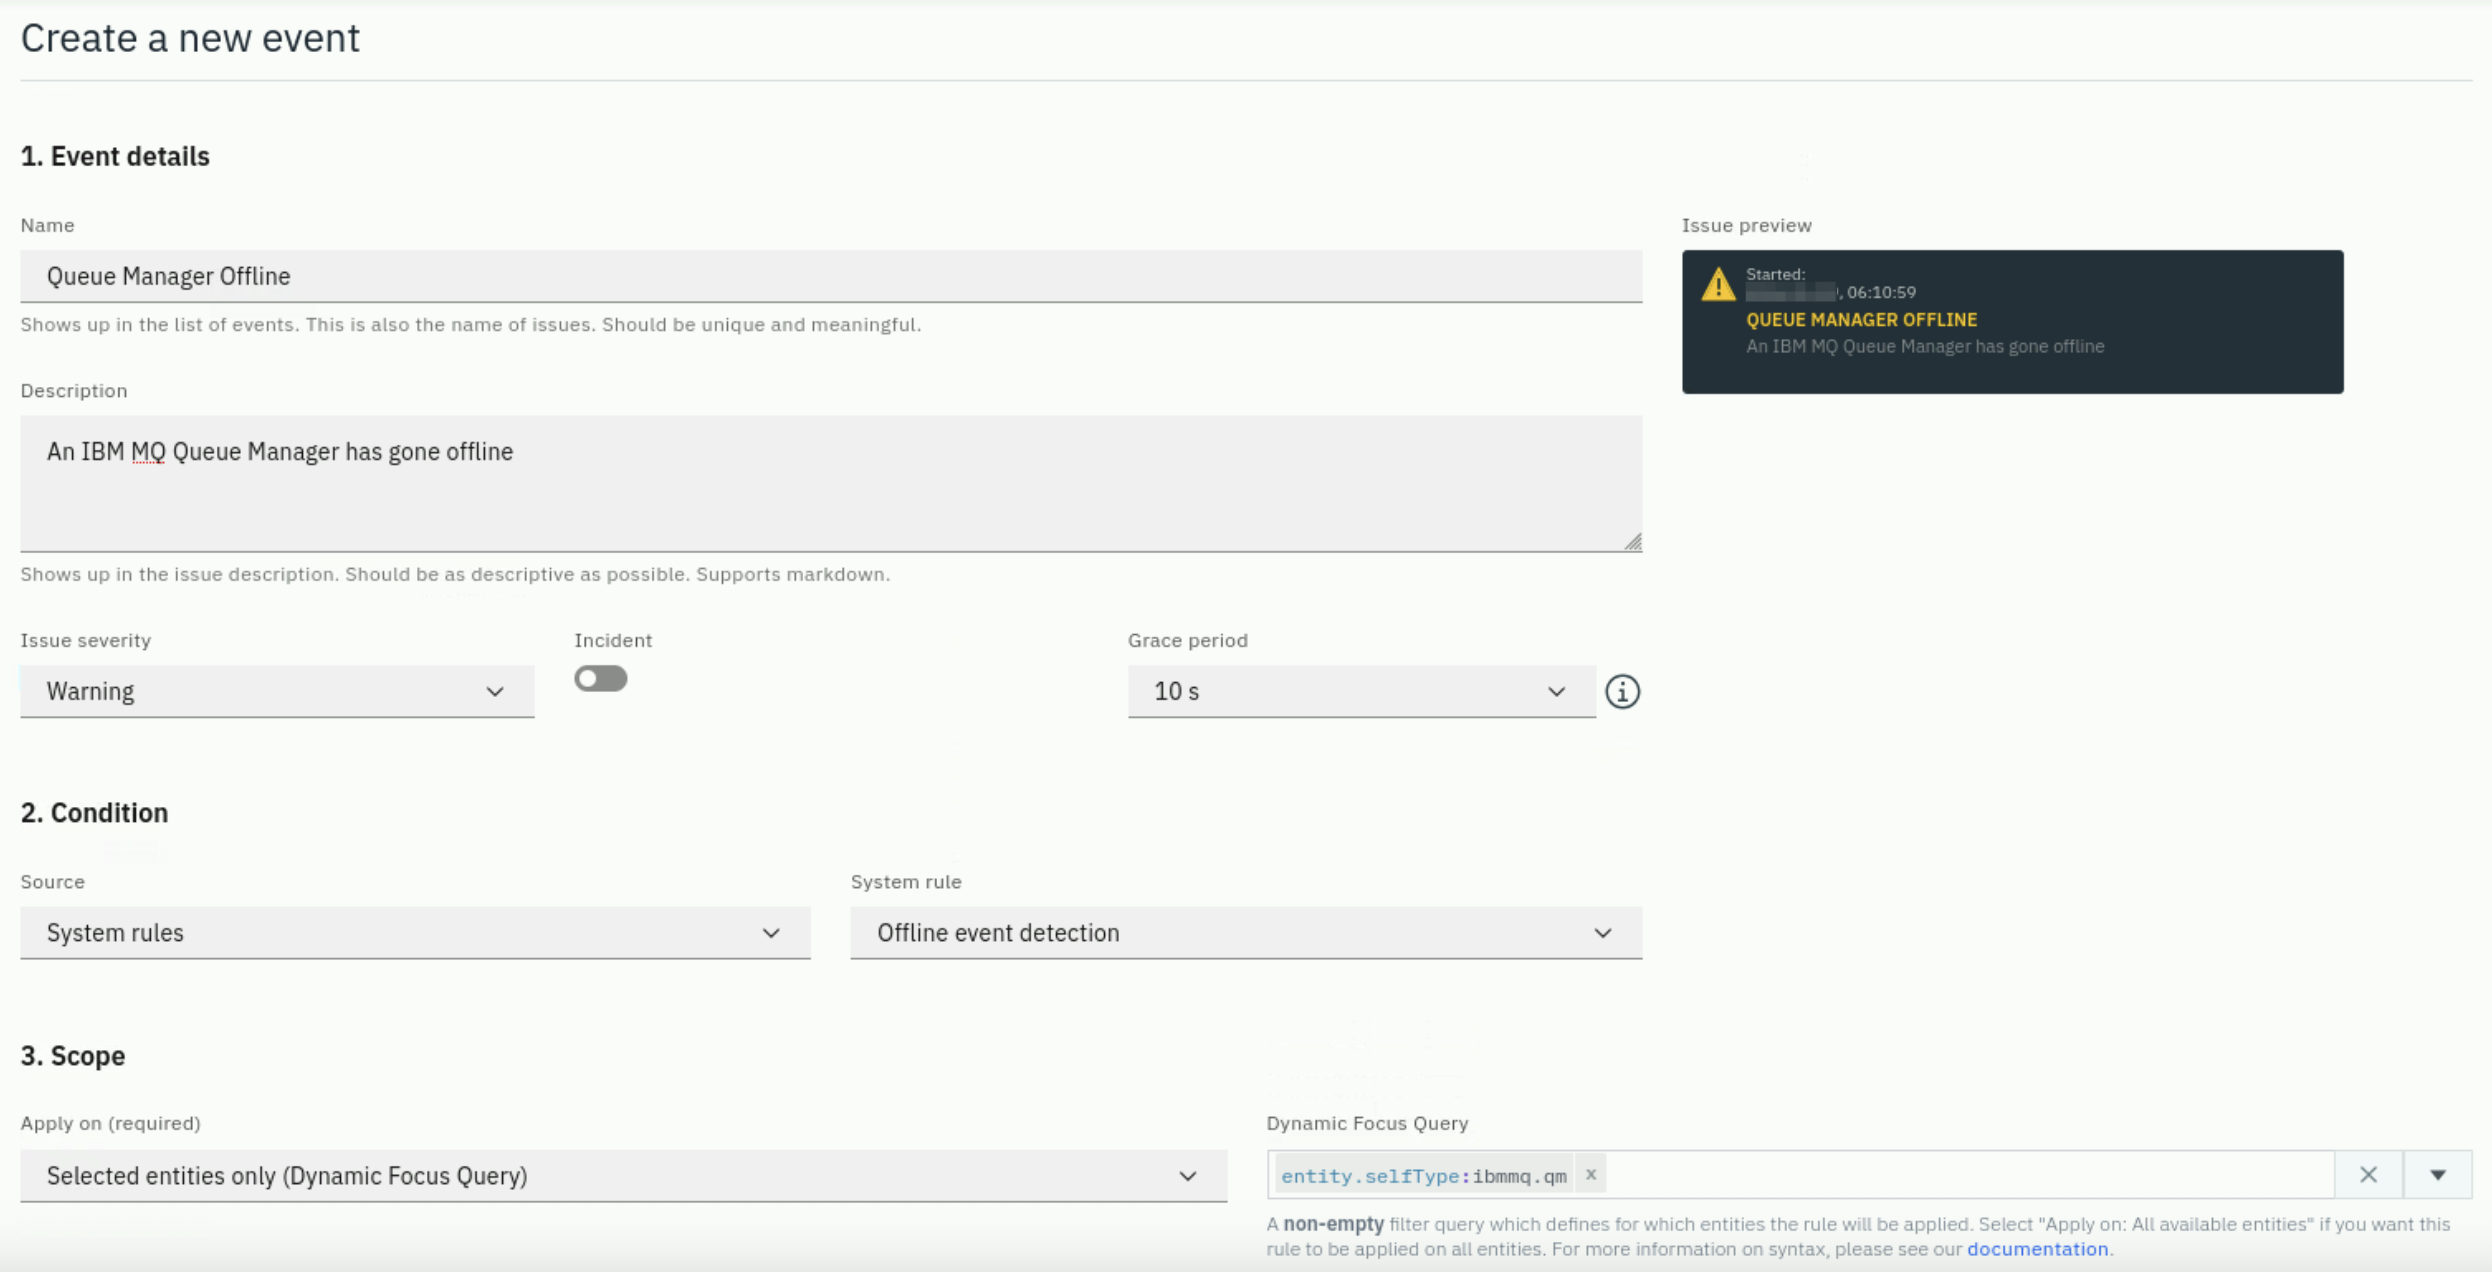
Click the Create button to save your Event.
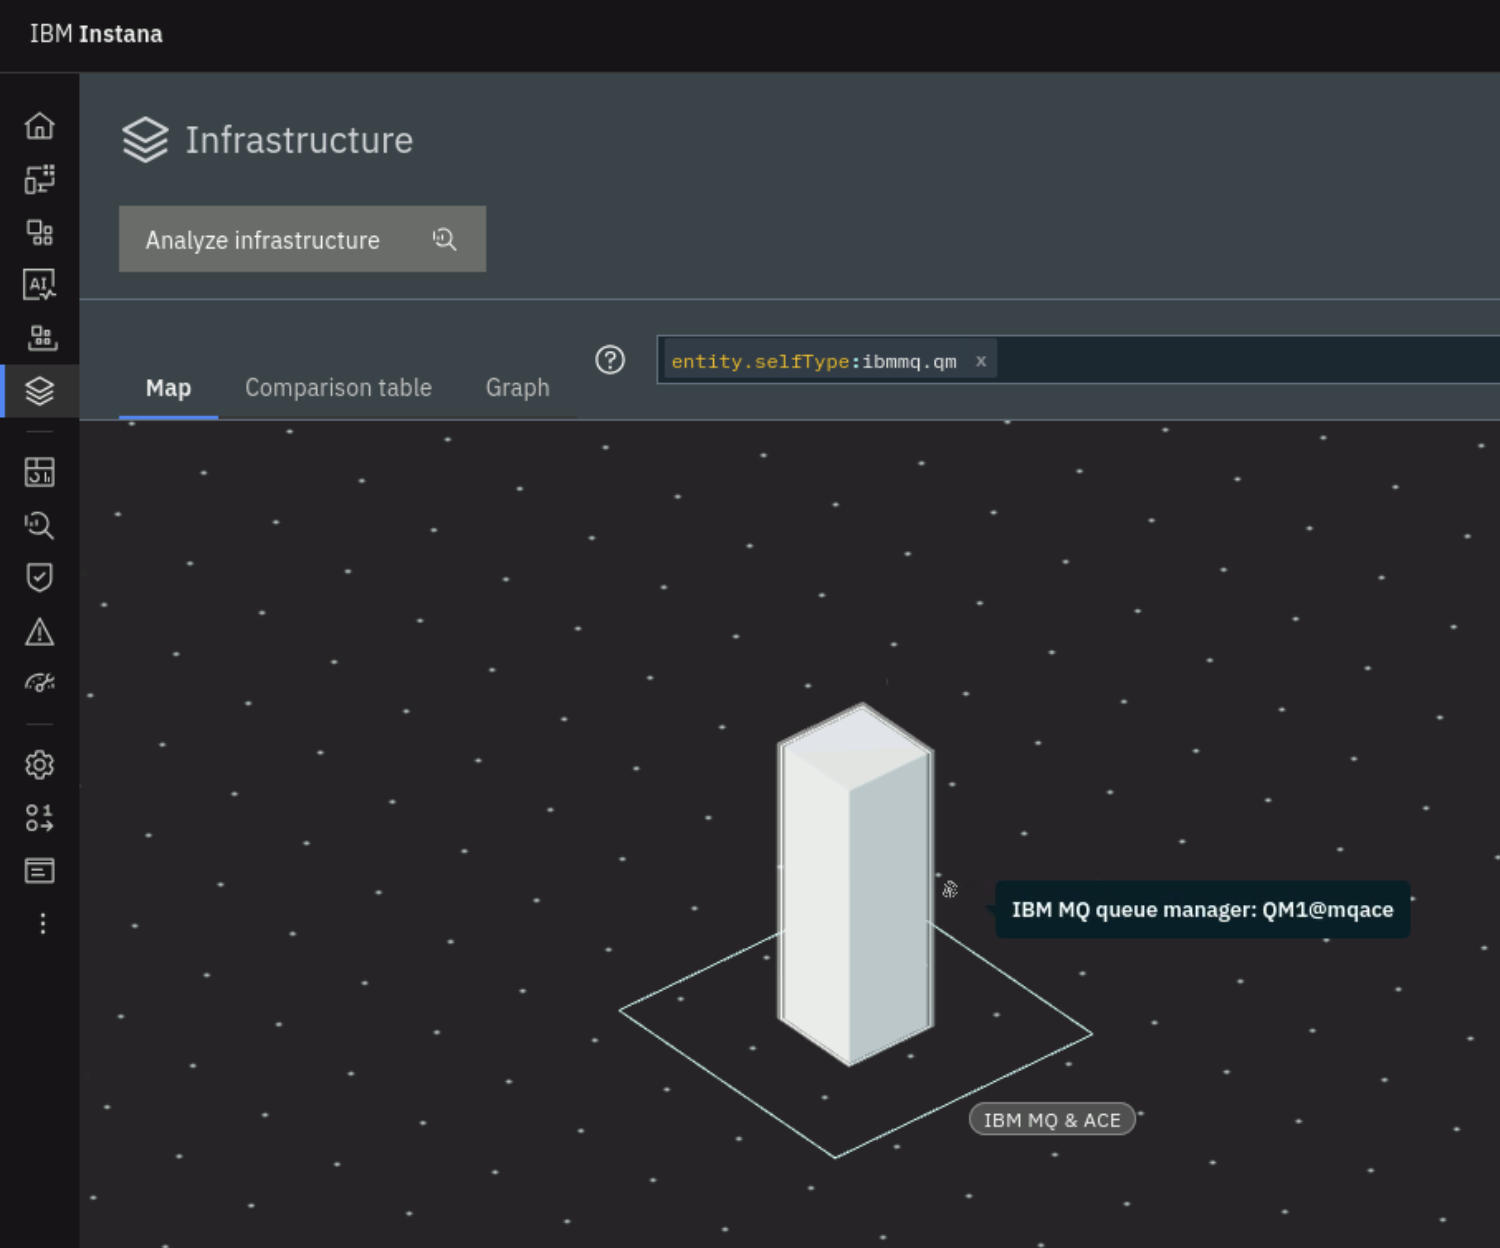
If you want to see how entity.type vs. entity.selfType behaves, you can open the Infrastructure view and add the queries into the search bar and see the results. When you use selfType, you'll notice that the entity towers do not contain the child entities (represented as pizza boxes) that are associated with the parent entity.
3.5: Setup an Alert for the New Event
Now that you have a new Event defined, you need to define an Alert.
Alerts are used to notify people and teams via various Alert Channels. You previously reviewed the options for Alert Channels. The Alerts will be sent to one or more Alert Channels that you select.
Select Settings on the left side navigation. Then select Alerts
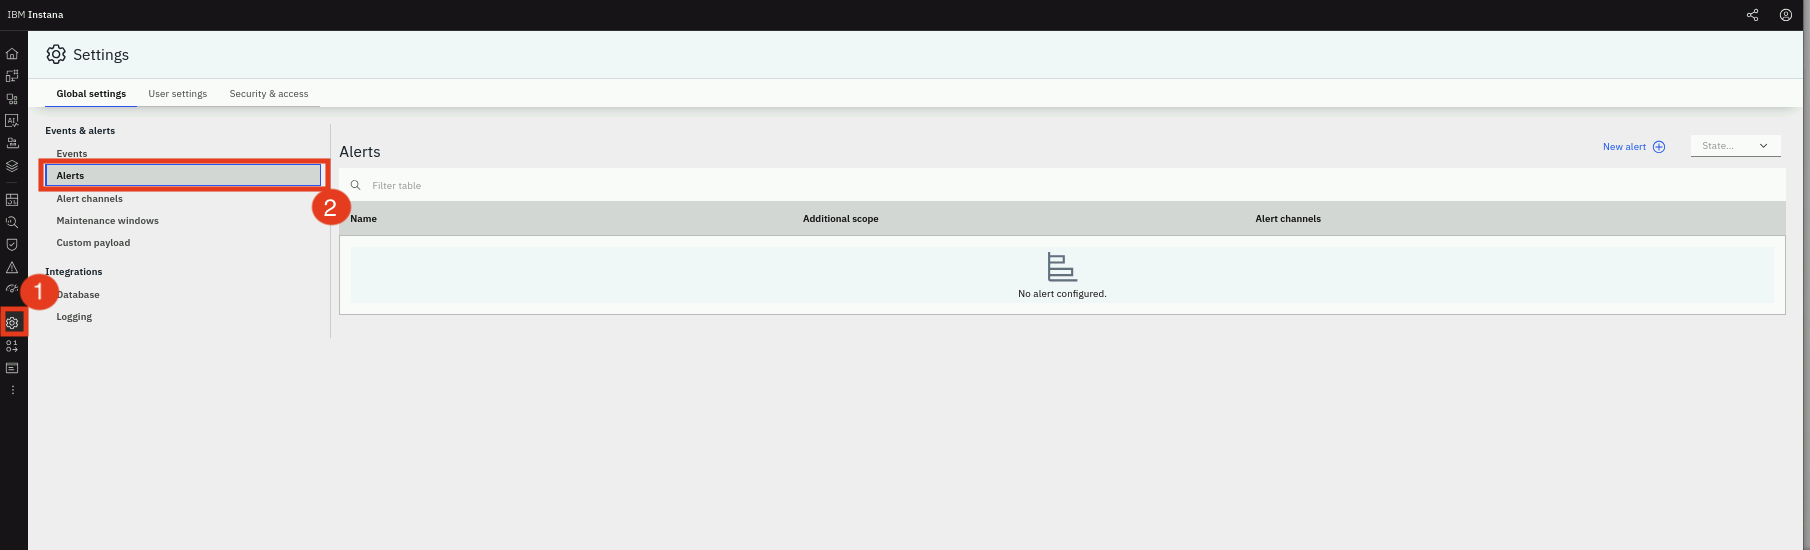
Click on the New Alert button
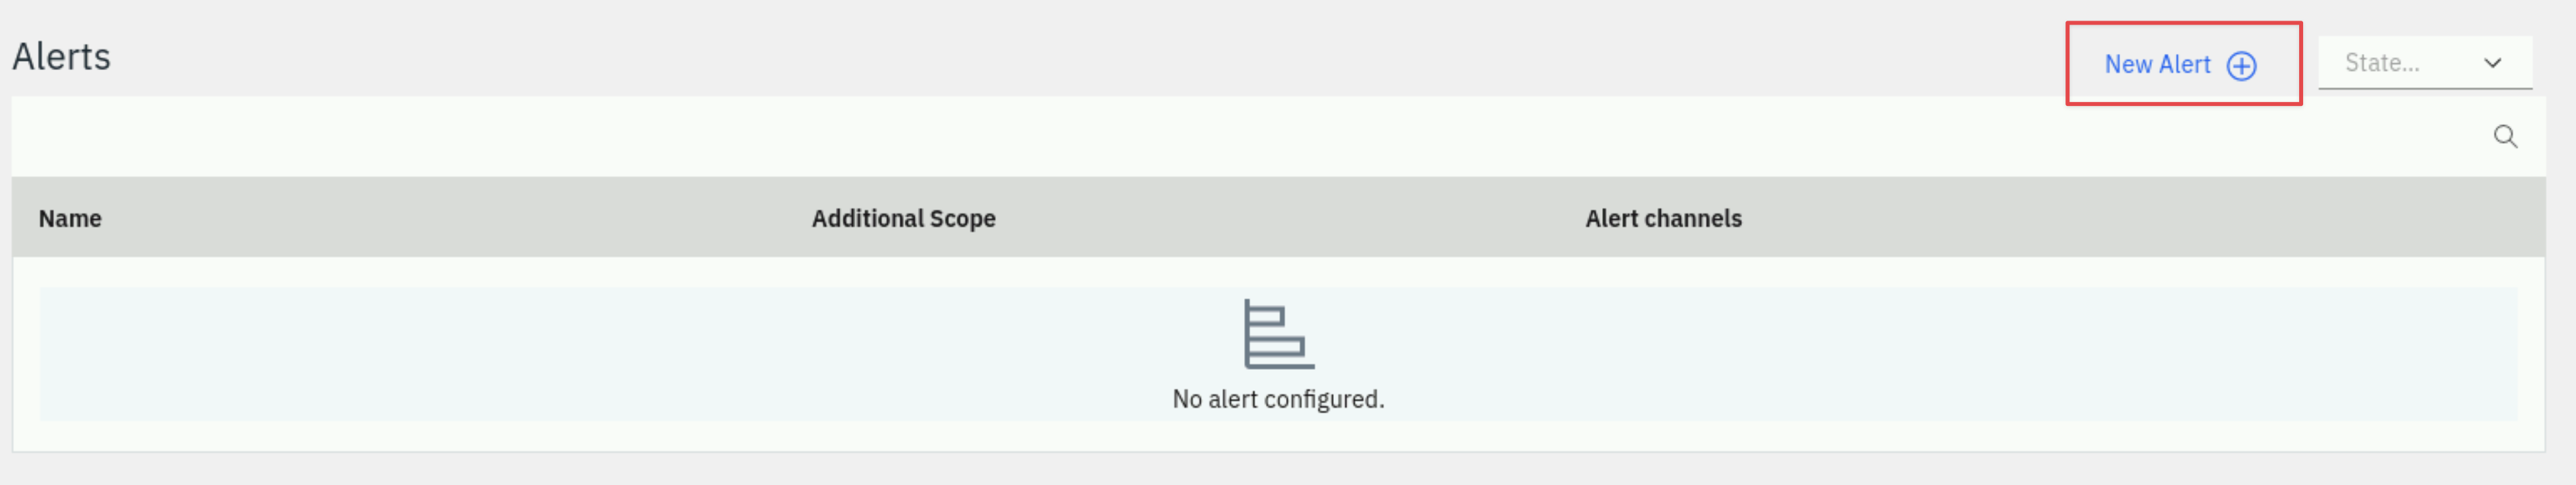
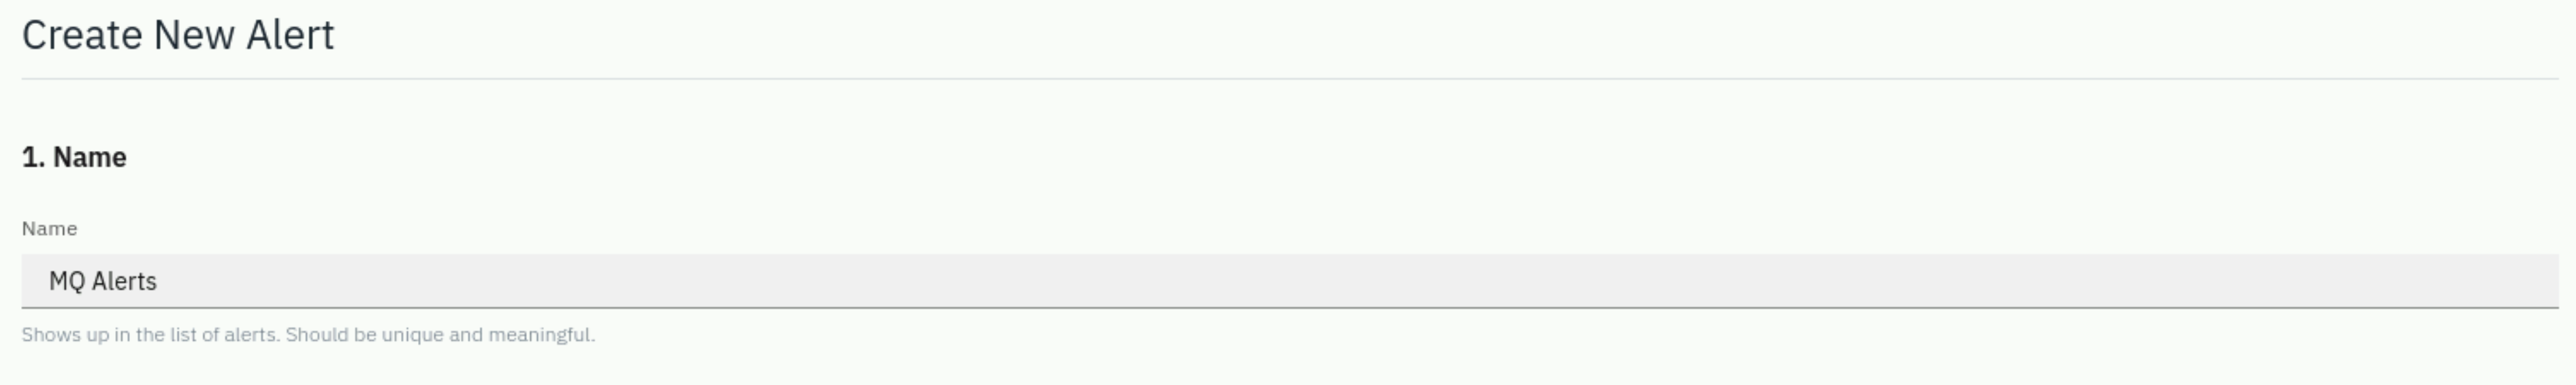
Give the new Alert a name. Normally, the Alert name is something meaningful to indicate who will be notified and the type of events being sent. For example, MQ Alerts
Under Events you will see that there are multiple options. You can setup an Alert for a particular Entity Type. For example, you might setup an Alert for all Oracle Database Events.
Select Alert on Event(s) from the dropdown. This option allows you to select a specific list of Events to forward to an Alert Channel(s).
Alternative Alert Configuration:
Another way to define Alerts is to select Alert on Event Types and then use a Dynamic
Focus Query (DFQ) to filter it down to certain entity types. For example, MQ administrators
could receive all Events for MQ entity types by filtering on entity.type:ibmmq*. This
approach is useful when you want to capture all events for a specific technology or team
responsibility area without having to select individual events.
Select the Add Events button.
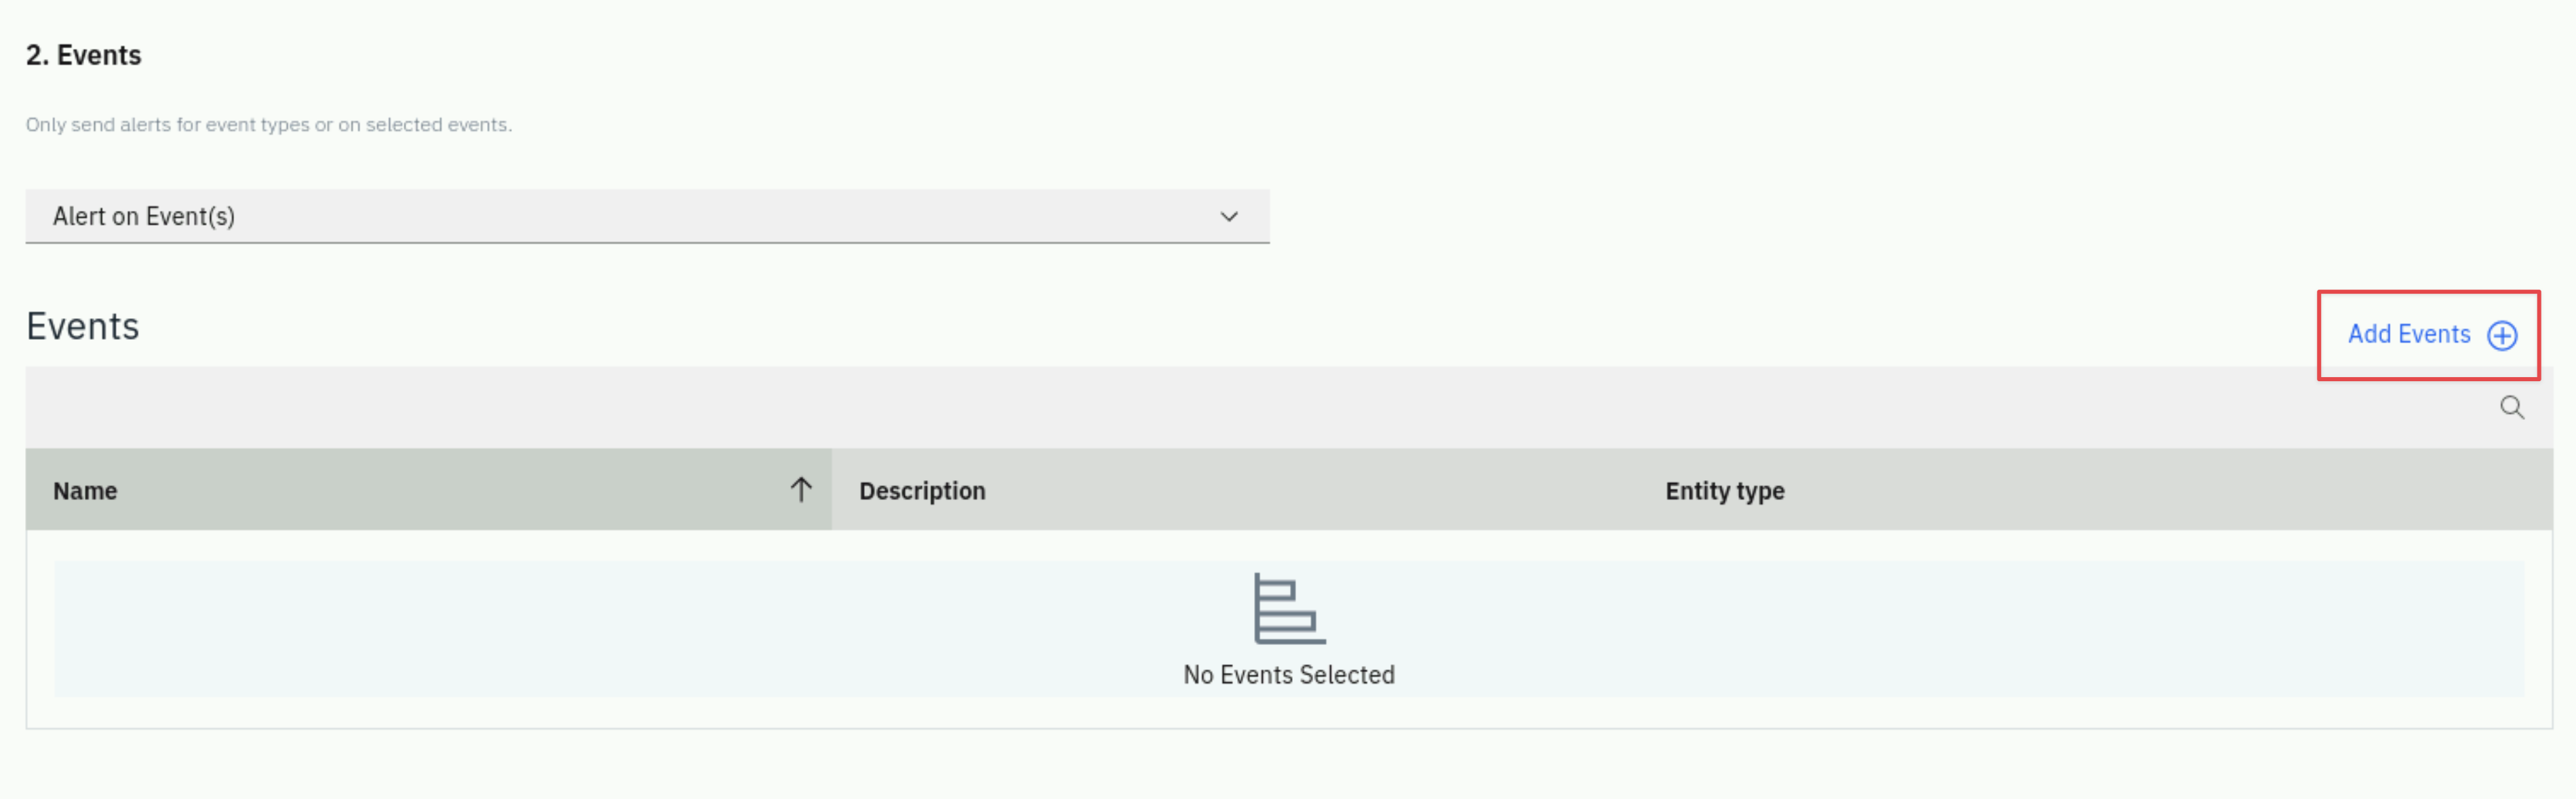
Initially, you will see a list of all Events.
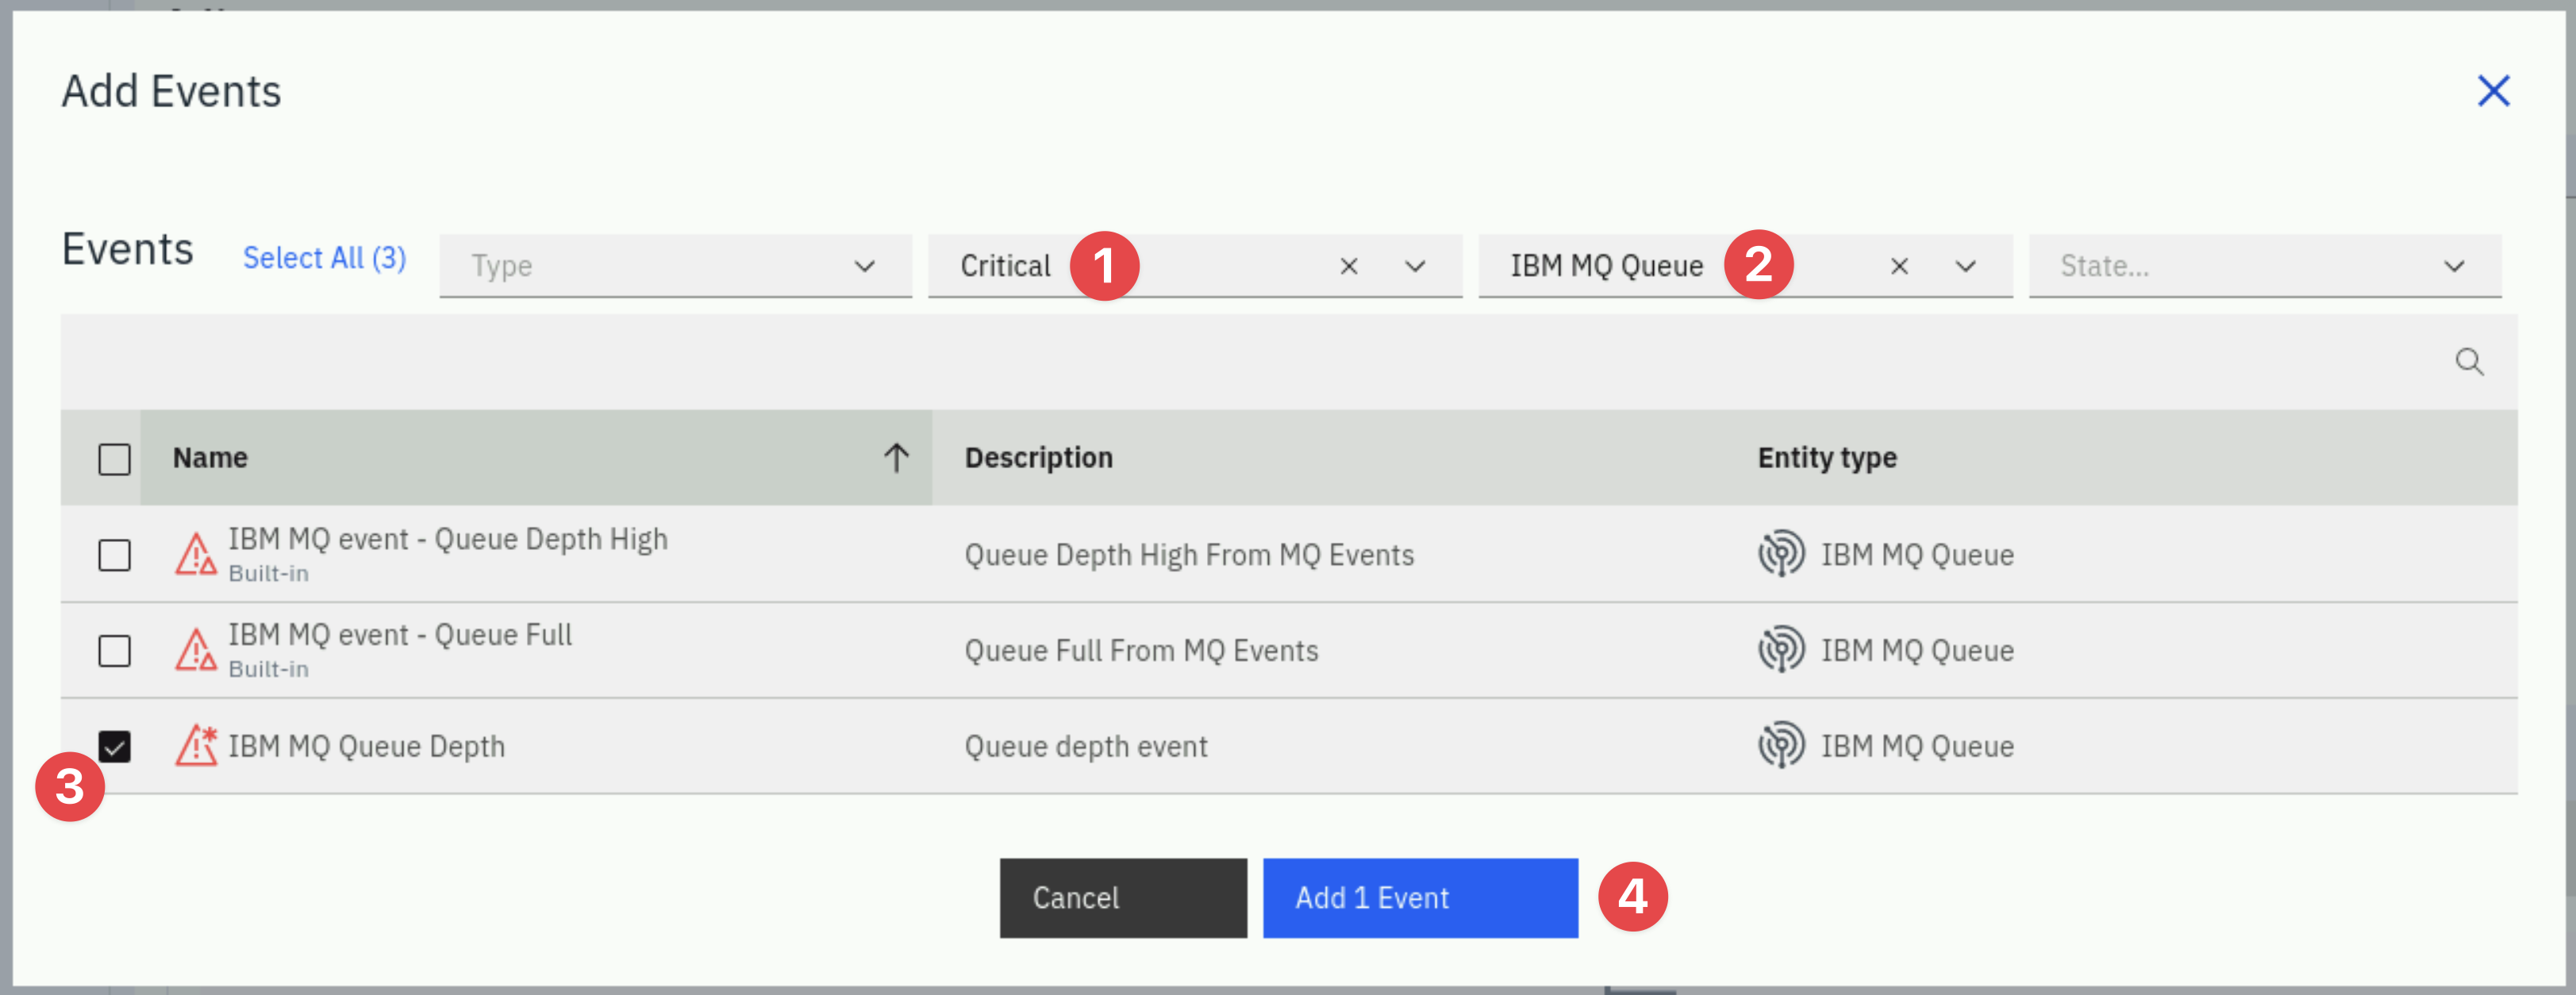
Filter the list to just a specific Entity Type. Select the Entity Type dropdown list and select IBM MQ Queue. You will now see a filtered list of Events related to IBM MQ Queues.
Find the Event you created in the previous section and select the checkbox. Then, select the Add 1 Event button at the bottom.
You will now see the 1 selected Event listed.
Scroll down to the Scope section. This determines which Entities this Alert will apply to.
Select the Apply on dropdown list. You'll see that you can choose one of 3 options:
- Application Perspective: This option allows you to limit the scope of the alert to a specific application.
- Selected Entities Only: You use the dynamic focus queries to filter to a specific set of Entities
- All Available Entities: The Alert would apply to any Entity that triggered the Event threshold.
Select the Selected Entities Only option
A new widget will appear on the right side of the screen asking you to specify the Dynamic Focus Query
In the entry field, enter the lucene query that will filter to the queue that is used for the Quote of the Day application. In this case, we are looking for 1 specific queue. Enter the following value:
entity.ibmmq.queue.name:CP4I.DEMO.API.Q
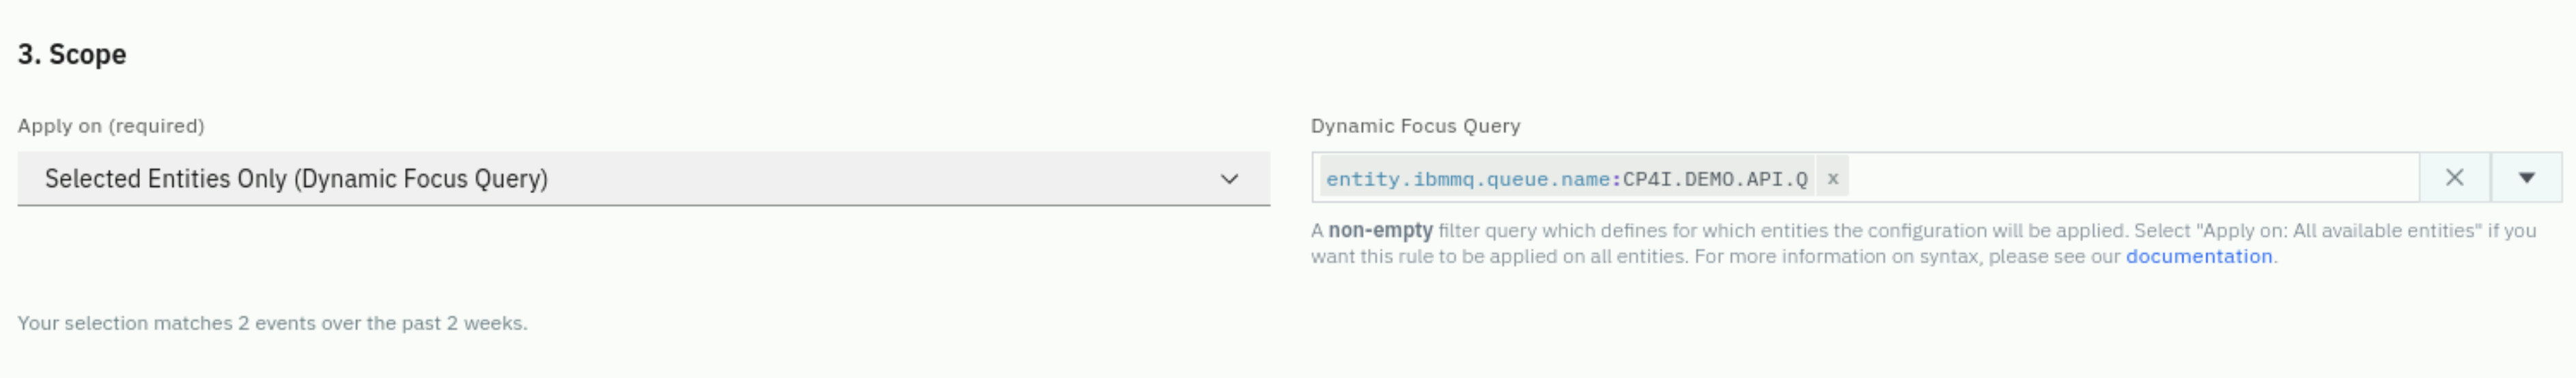
Depending on the randomness of the load generation you may not see any selection matches over the past 2 weeks like in the above screenshot. If you want to trigger this alert more easily you could edit the custom event you created and reduce the Grace Period to 10s and the Queue Depth Percentage to 50.
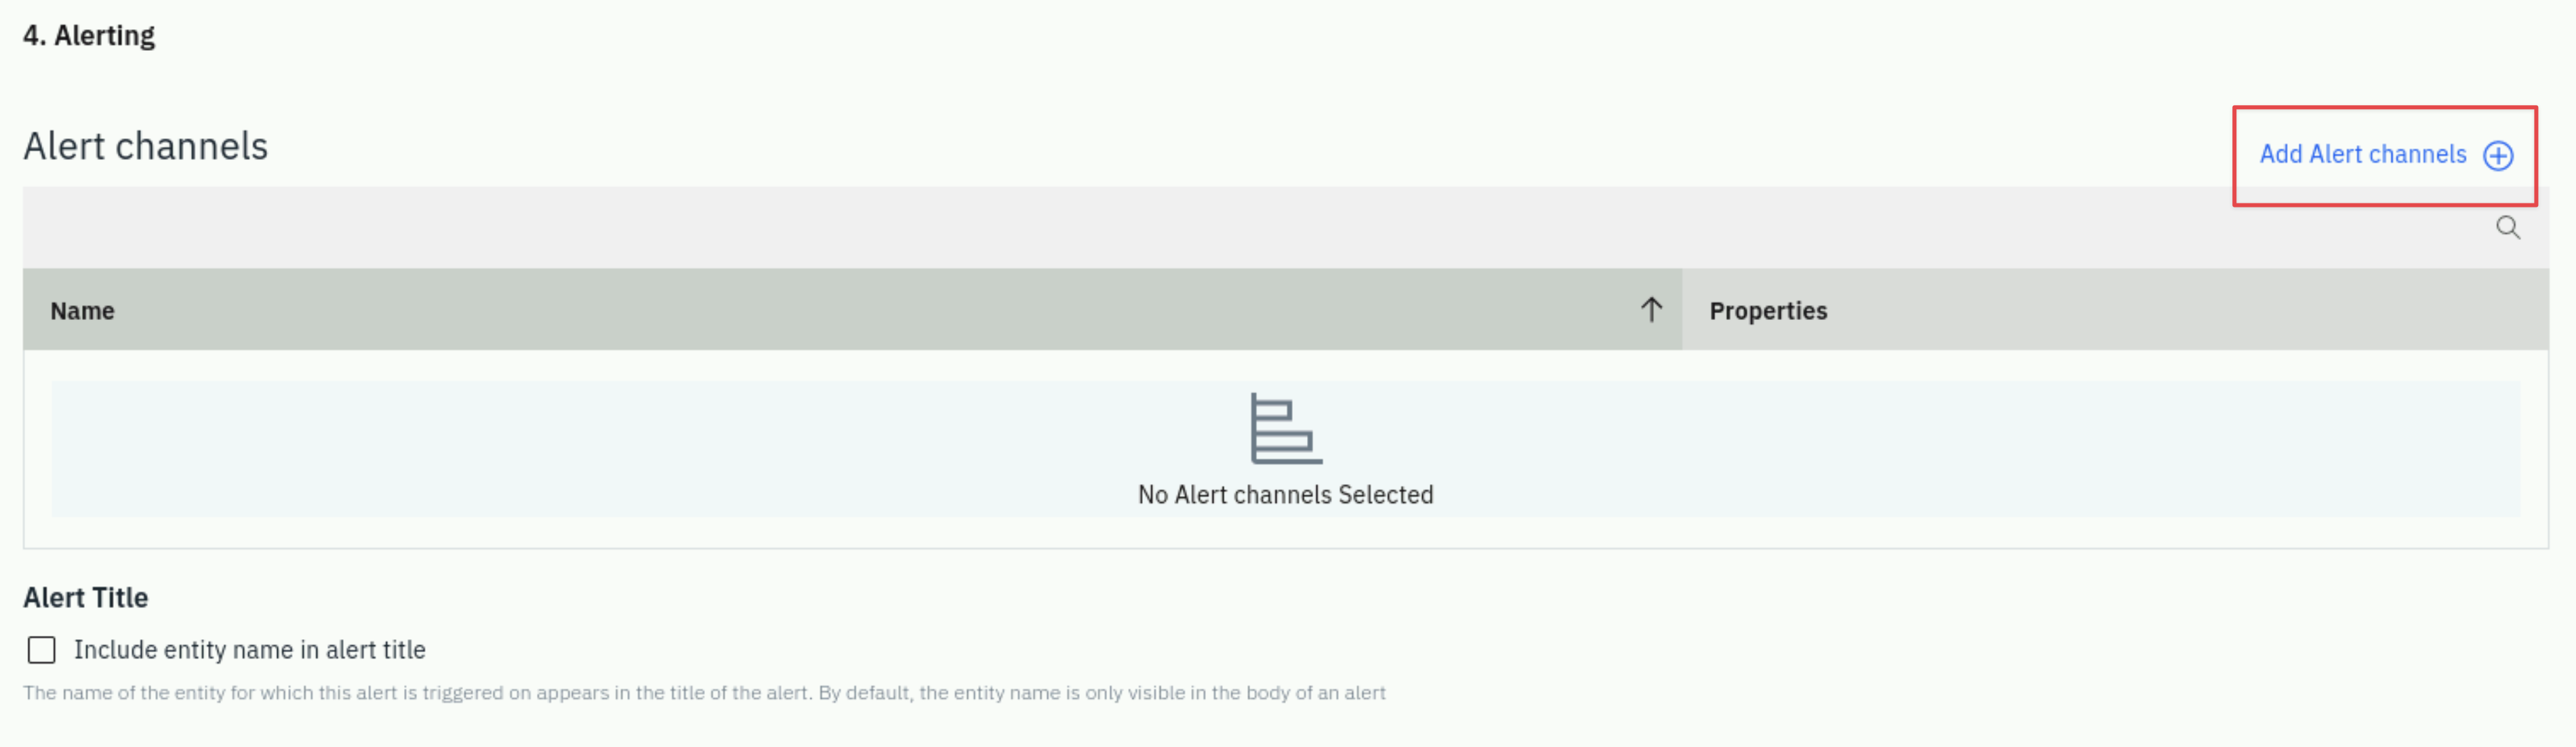
Next, click on the Add Alert Channels button.
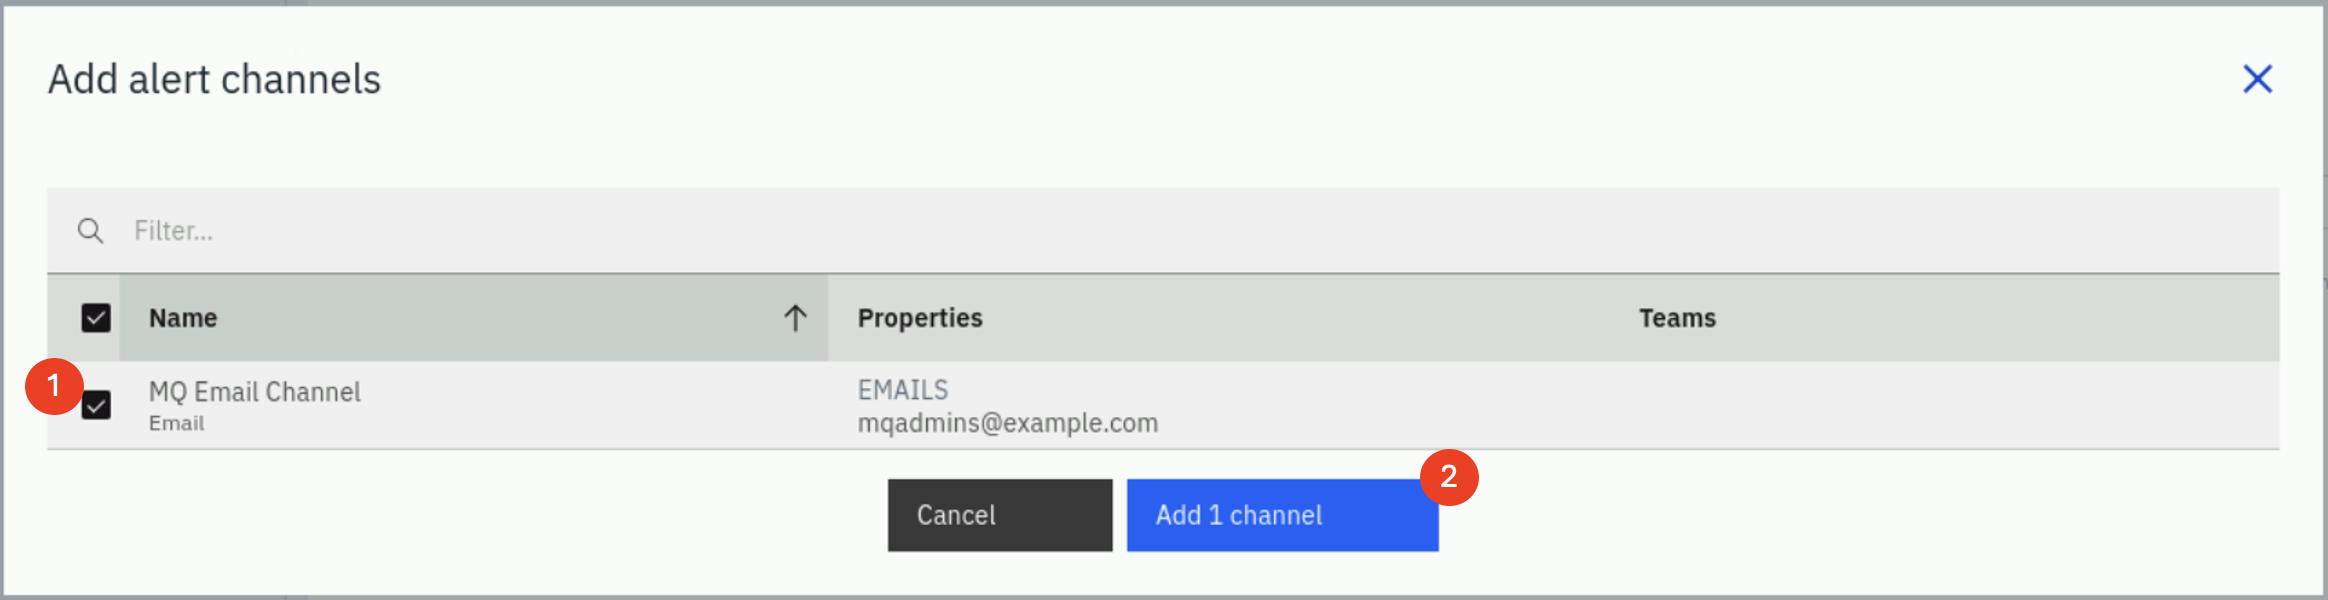
A dialog will open with a list of available Alert Channels. Select the Alert Channel that you created earlier.
Then, click the Add 1 Channel button.
Scroll down to the bottom. You will see an optional section where you can add custom payloads by adding Key/Value pairs.
Custom Payloads:
Custom payloads allow you to add additional context to your alerts by including key/value pairs that will be sent with the alert notification. This is useful for including information like:
- Team contact information
- Runbook URLs
- Environment identifiers
- Escalation procedures
For this lab, we'll skip adding custom payloads, but in production environments, these are commonly used to make alerts more actionable.
Finally, click the Create button to save your Alert.
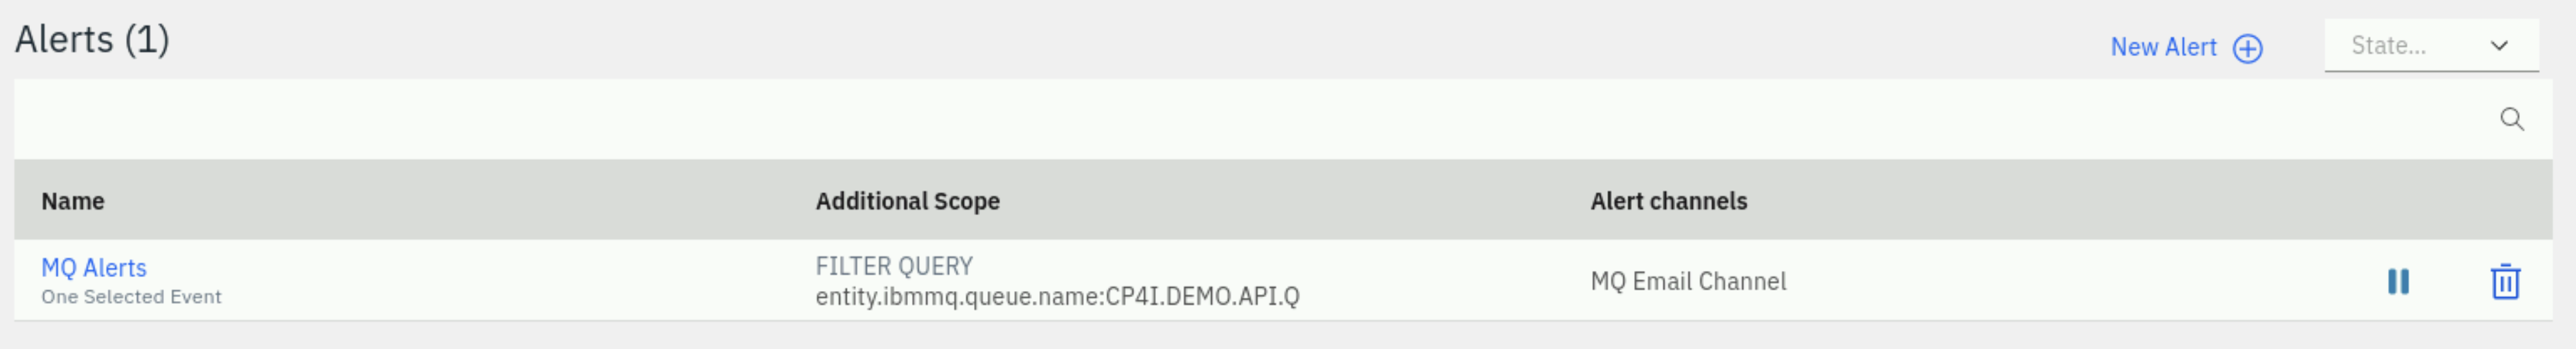
You can use the Mail bookmark to view alert emails that are sent for the alerts you have setup.
3.6: Global Custom Payloads (Optional)
Global Custom Payloads are a powerful feature that many Instana customers use in production environments. Unlike the alert-specific custom payloads we saw earlier, Global Custom Payloads apply to all alerts, making them ideal for organization-wide standards.
What are Global Custom Payloads?
Global Custom Payloads allow you to define key/value pairs at the Alert level that will be automatically included in alert notifications. This is particularly useful for:
- Consistent metadata: Ensure all alerts include standard fields like environment, region, or business unit
- Integration requirements: Add fields required by downstream systems (e.g., ServiceNow, PagerDuty)
- Organizational standards: Include company-specific information like cost center or support team
- Dynamic values: Use Instana's placeholder variables to include context-specific information
Configuring Global Custom Payloads
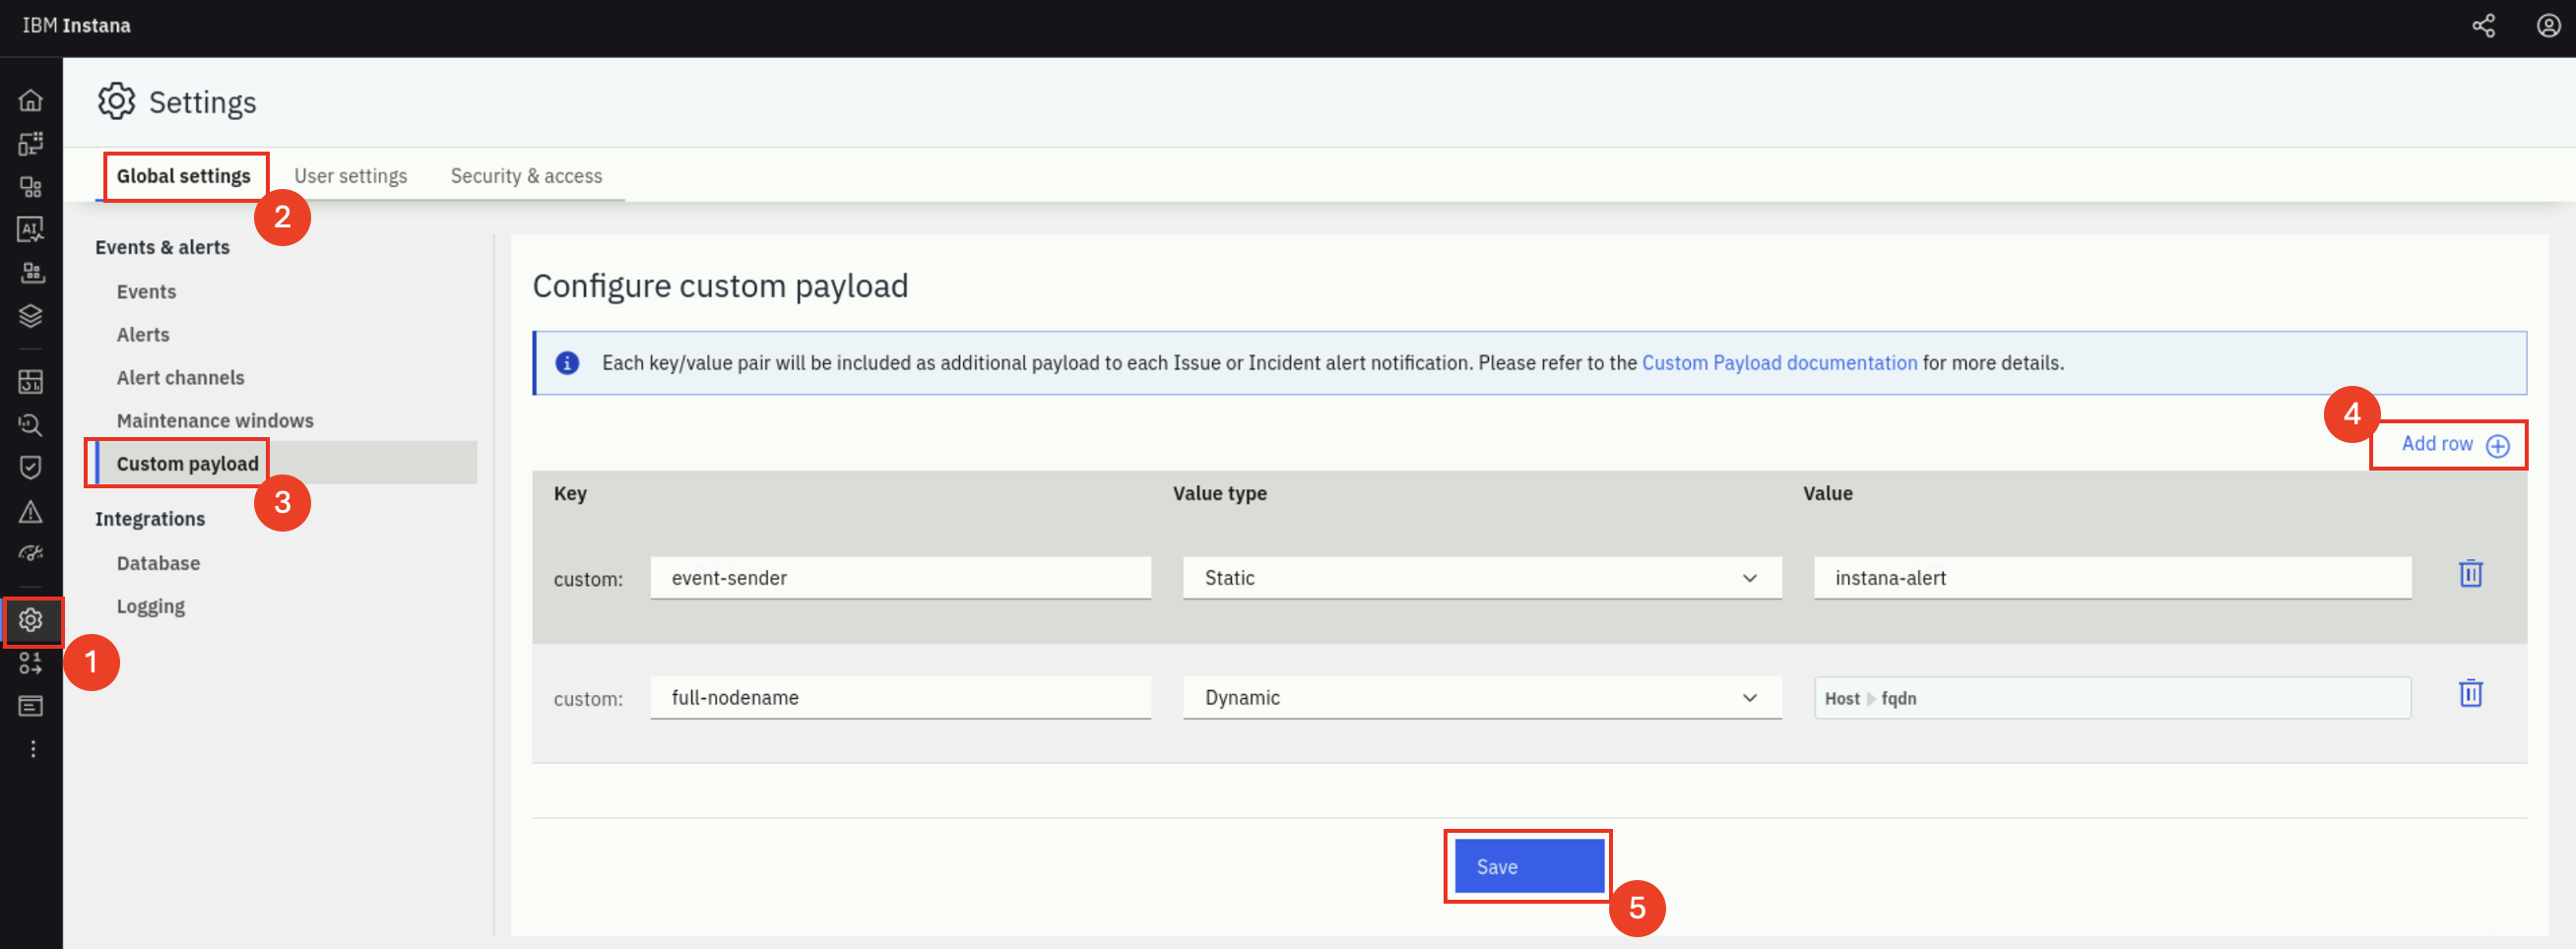
To configure Global Custom Payloads:
- Navigate to Settings → Global settings → Events & alerts → Custom payload
- Specify the Key/Value pairs that should be included in an alert. You can use static values or dynamic placeholders that Instana will replace with actual values when the alert is sent.
- Click Save to apply the Global Custom Payloads.
Example Custom Payload Keys:
environment: production, staging, developmentteam: database-team, mq-team, application-teamseverity_mapping: Map Instana severity to your organization's levelsrunbook_url: Link to troubleshooting documentationescalation_policy: Define escalation procedures
- When you create an alert, you will be able to view the Global Custom Payloads that you have defined.
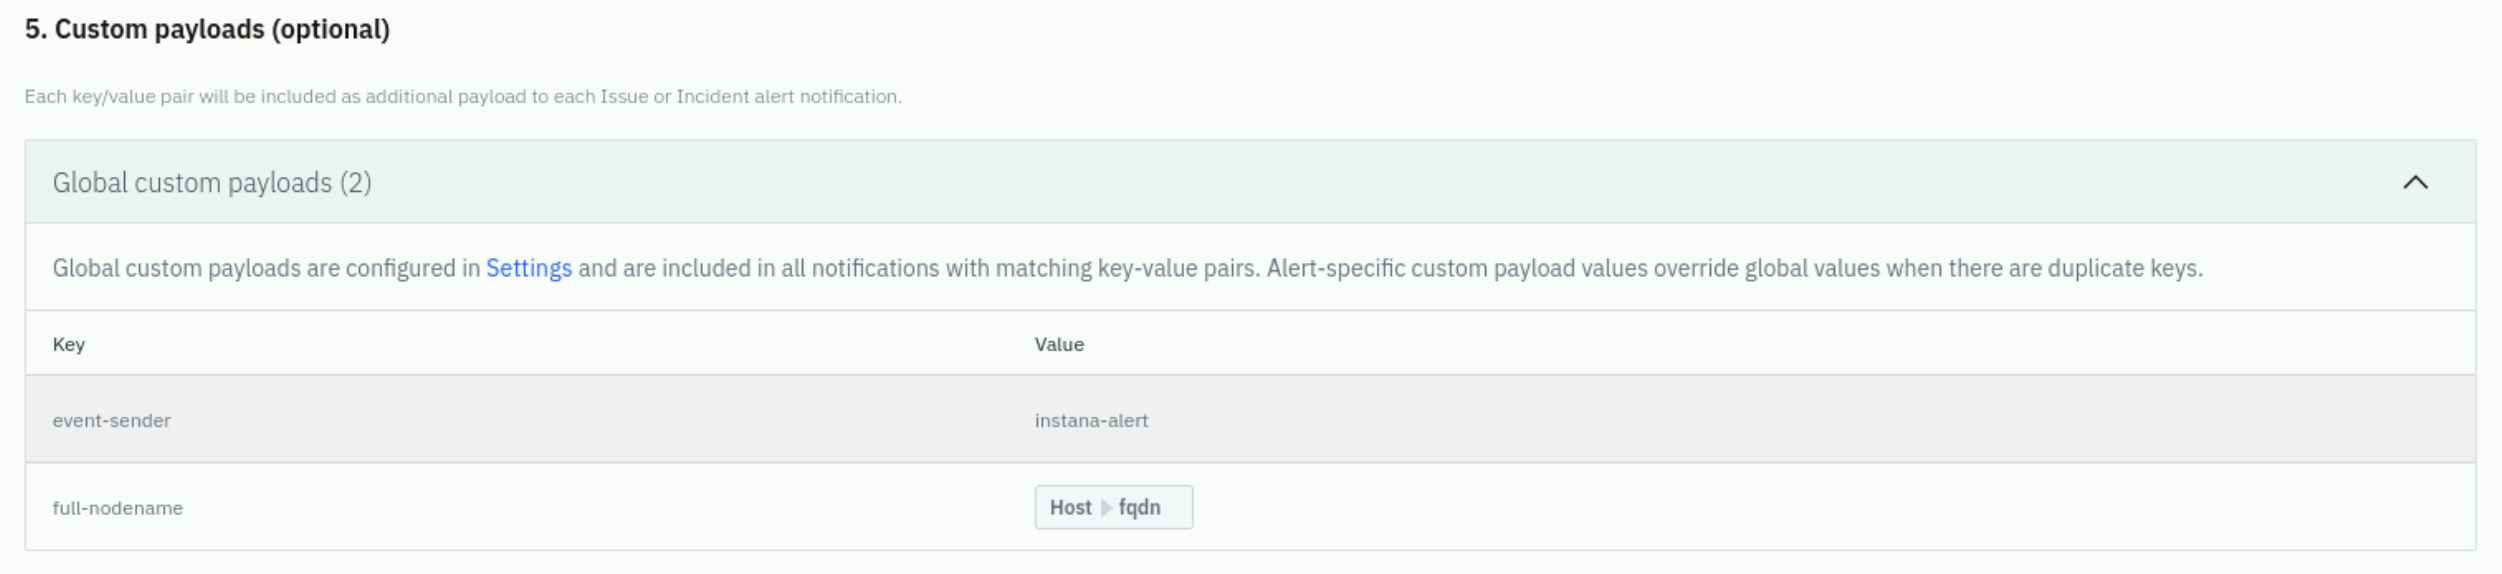
For this lab, we won't configure Global Custom Payloads, but understanding this feature is important for production deployments where consistent alert formatting is critical.
3.7: Summary
At this point, you have created an Event and an Alert for that Event. The next time the custom Event that you created triggers, an Alert will be sent to the Alert Channel. In this case, a Email will be sent.
In this exercise lab, you learned how to:
- Create an Alert Channel for notifications
- Create application Smart Alerts based on application metrics and analytics.
- Configure Incident correlation and Custom Payloads
- Create traditional threshold-based Events and explore nearly 500 out-of-the-box build-in events.
- Use Dynamic Focus Queries to filter monitoring scope
- Configure Transient Events for noise reduction
- Set up Offline detection for critical entities
- Understand Global Custom Payloads for organization-wide standards