Before you begin
The instructions in this tutorial use the tutorial environment, which includes a selection of topics each with a live stream of events, created to allow you to explore features in IBM Event Automation. Following the setup instructions to deploy the demo environment gives you a complete instance of Event Automation that you can use to follow this tutorial for yourself.
Versions
This tutorial uses the following versions of Event Automation capabilities. Screenshots might differ from the current interface if you are using a newer version.
- Event Endpoint Management 11.5.1
Choosing a monitoring platform
The focus of this tutorial is to illustrate the types of monitoring that can be useful for Event Endpoint Management, and the sorts of metrics that you can use to enable this.
Grafana is used in this tutorial to display metrics, but it is not required for monitoring Event Endpoint Management. There are many alternative options available that can be used to visualize these metrics and to trigger alerts and notifications when they change.
Choosing the best monitoring platform depends on your specific use case and is beyond the scope of this tutorial.
Instructions
-
Set up monitoring in the tutorial environment.
This installs the Grafana community operator and creates two sample Grafana dashboards to help you get started.
-
Access the tutorial dashboards.
The following sections of this tutorial will explain how to use these dashboards.
Monitoring use cases
There are many reasons for a Event Endpoint Management user to use metrics. This tutorial focuses on two common use cases:
-
Health monitoring - Ensuring that Event Endpoint Management is healthy, and detecting early warnings of potential problems that need attention.
-
Activity monitoring - Understanding the workload the cluster is currently supporting, which topics are being used, and how applications are behaving.
There is overlap between these two use cases. Some metrics could be helpful for both use cases, and the objective of this tutorial is not to try and classify the available metrics.
Monitoring is not a single one-size-fits-all activity. The goal of this tutorial is to encourage you to consider what your objective is, and to select metrics to monitor that support that objective.
Monitoring system health
A common use case for Event Endpoint Management metrics is ensuring that the cluster is functioning correctly, and identifying issues that require attention.
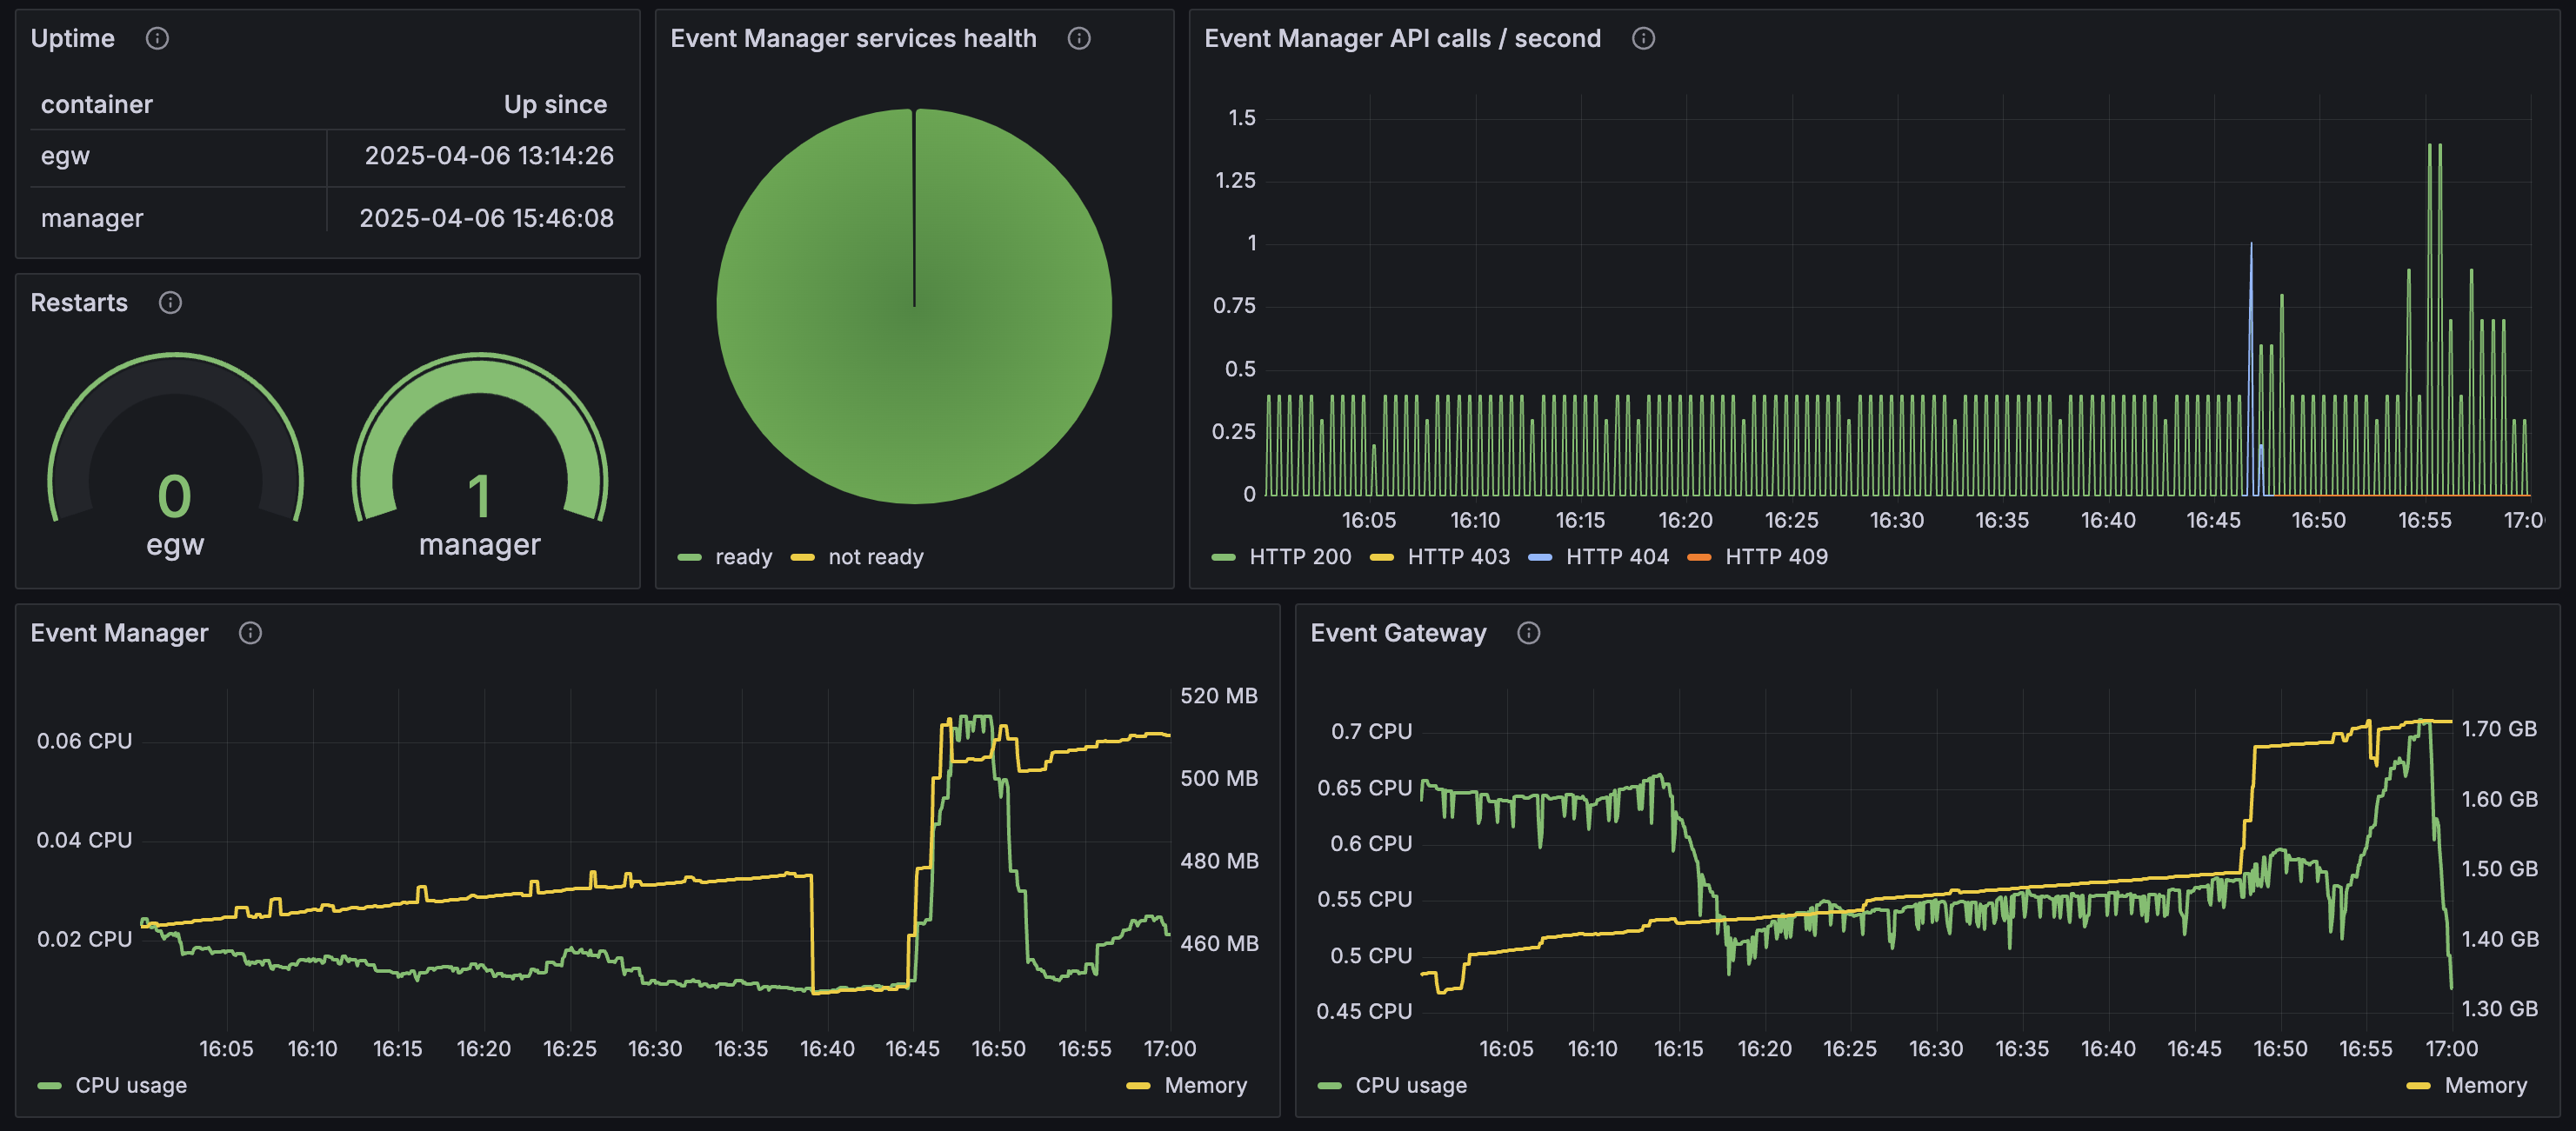
The demo playbook creates a sample Grafana dashboard called Event Endpoint Management (Health), which provides insights into relevant health metrics.
View the metrics displayed in this dashboard to assess the status of your cluster.
Service health
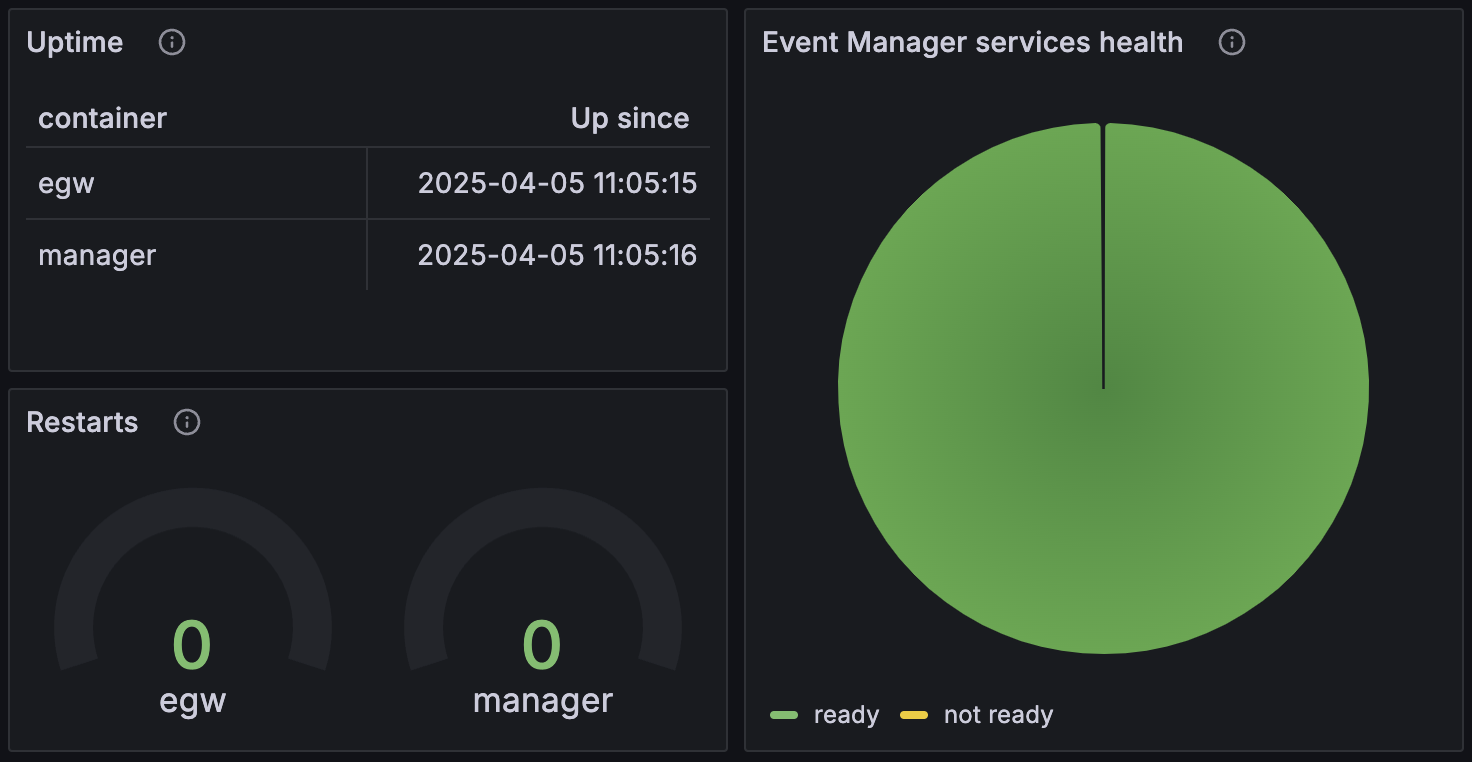
Some metrics indicate the health of the components that make up Event Endpoint Management. The first section of the demo dashboard gives examples of the kinds of values that an administrator can monitor for changes.
Uptime
Metric: kube_pod_container_state_started
If the start time for an Event Gateway (shown in the dashboard as egw) or Event Manager (shown in the dashboard as manager) pod is more recent than the last time it was administratively modified or restarted, this indicates an unexpected restart.
Restarts
Metric: kube_pod_container_status_restarts_total
If the Kubernetes probes registered by Event Endpoint Management fail, then Kubernetes will restart the containers. The number of restarts should be zero for a healthy component. It is useful to monitor this for both Event Gateways (shown in the dashboard as egw) and Event Manager (shown in the dashboard as manager).
Event Manager services health
Metric: eemmanager_services_ready
The Event Manager consists of multiple internal subsystems, such as a storage provider, key management system, and gateway communications system. Monitoring the health of individual subsystems provides a granular view of the current state of the system.
API call handling
One of the primary functions of the Event Manager is to handle REST API requests. Understanding the requests that it is receiving, and the types of responses these are leading to, is helpful for monitoring.
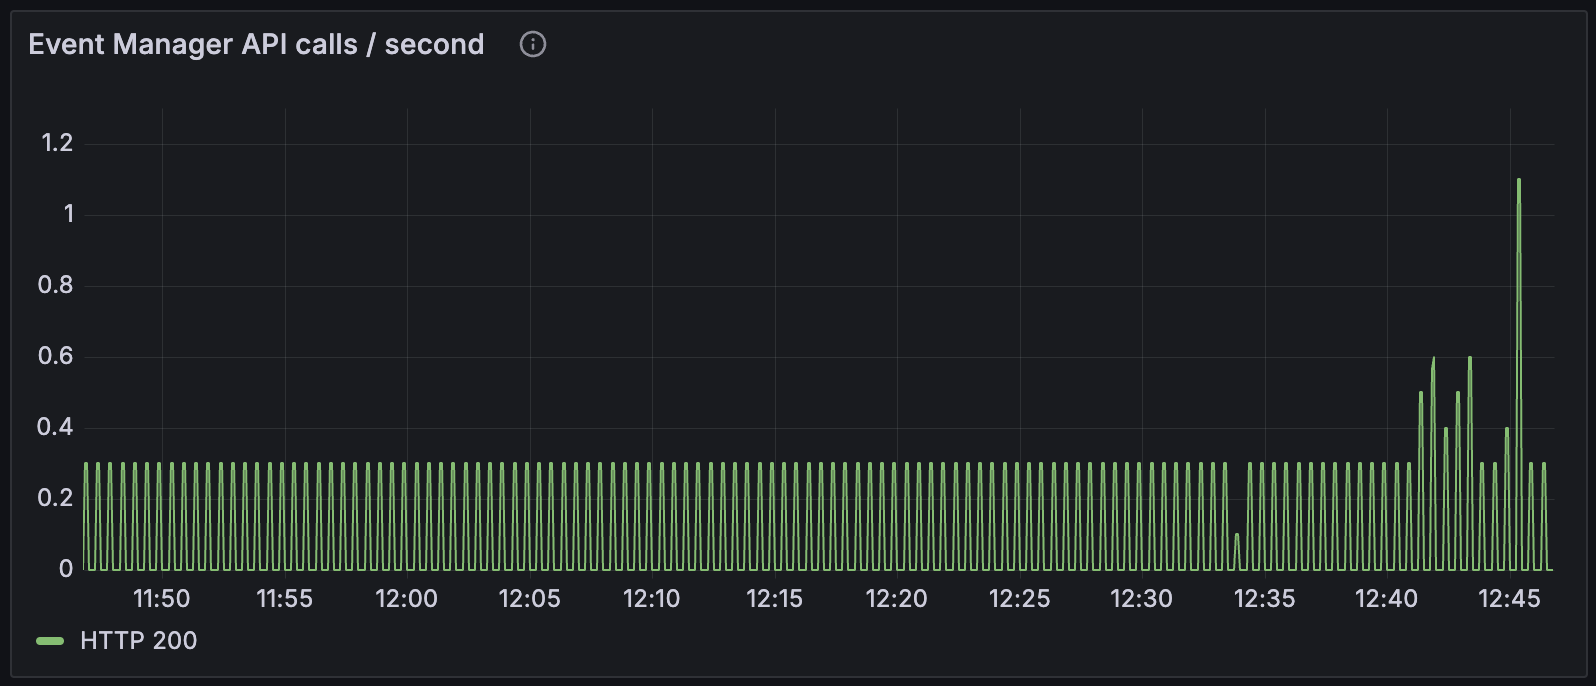
API calls / second
Metric: eemmanager_api_responses_total
This visualization shows the number of API calls that the Event Manager receives per second. There will be a consistent background workload, such as API calls made by Event Gateways to retrieve information about topics, clusters, and subscriptions. Additional activity, such as users browsing the catalog or applications invoking the Admin API, will be shown as spikes in addition to that background workload.
In the demo visualization, counts are grouped by the HTTP response status code, providing additional insight into the current activity. For example, if you observe a large number of HTTP 401 requests, this indicates something trying to use invalid credentials to access the Event Manager UI or API.
HTTP 403 responses indicates something trying to access resources that they are not permitted to, or that roles have been misconfigured.
HTTP 500 responses suggest a system problem that needs further attention and investigation.
Event Endpoint Management pods
The third section of the demo dashboard gives examples of the kinds of resource usage values that an administrator can use.
CPU
Metric: container_cpu_user_seconds_total
Memory
Metric: container_memory_usage_bytes
An administrator can monitor these metrics to identify if they need to modify the resource limits specified in the EventEndpointManagement and EventGateway operands to better fit the current workload demands.
Using the dashboard
There are actions you can take to see the values in the demo dashboard change.
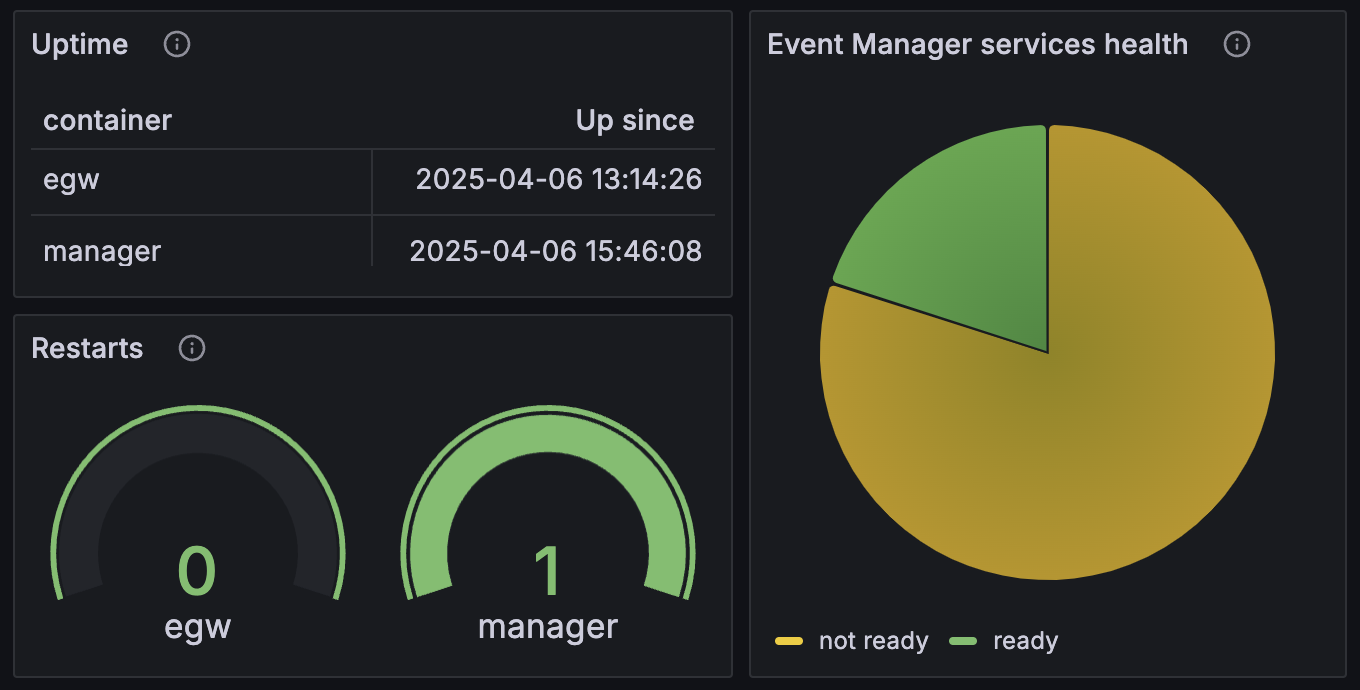
For example, kill the Java process for the Event Manager pod, to see the impact described by the metrics in the dashboard.
Run the following command:
oc exec -it \
  -n event-automation \
  my-eem-manager-ibm-eem-manager-0 -- \
  pkill --signal 15 java
You will see the number of restarts for the Event Manager container increase by one, and the number of services that are ready will decrease while the replacement manager container starts.
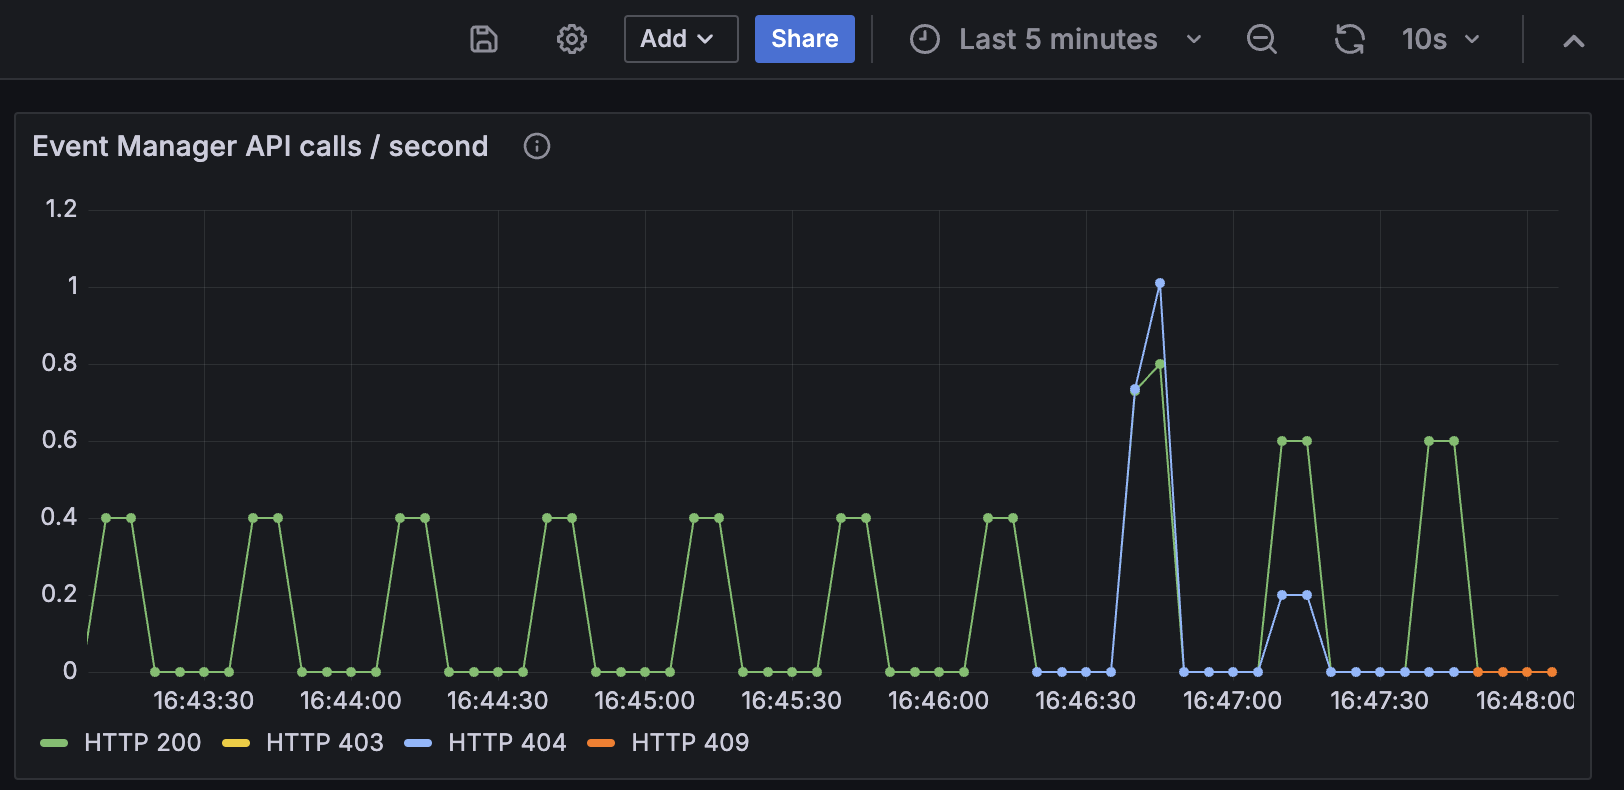
You can use the Event Manager web UI in unusual ways to cause other API response codes.
- To cause HTTP 404 (Not Found):
- Access a topic from the catalog.
- Edit the UUID string in the URL in your web browser to try to access the page for a non-existent topic.
- This will result in an HTTP 404 (not found) error page being displayed.
- To cause HTTP 409 (Conflict):
- Open the Topic page in two browser windows at the same time
- Prepare a new topic option with the same name for the same topic in both browser windows
- Click on the Save button in both browser windows
- The first to complete will be successful, while the second will result in an HTTP 409 (conflict) error being reported.
This sort of behaviour will be reflected as small numbers of API calls with different status codes being displayed in the dashboard.
In a real cluster, occasional error codes such as 404 (Not Found) or 409 (Conflict) would not be a cause for concern. However, a large or consistent number of error codes would require further investigation.
Start a large number of applications that use topics from Event Endpoint Management. To keep this simple, you can use Event Processing flows or run kafka-console-consumer.sh with properties files downloaded from the catalog. Let the applications run for a short time, then stop them.
You should see changes in CPU usage in the Event Gateway as a result.
Monitoring usage and activity
A common use case for Event Endpoint Management metrics is to understand what topics are being used and the behavior of applications.
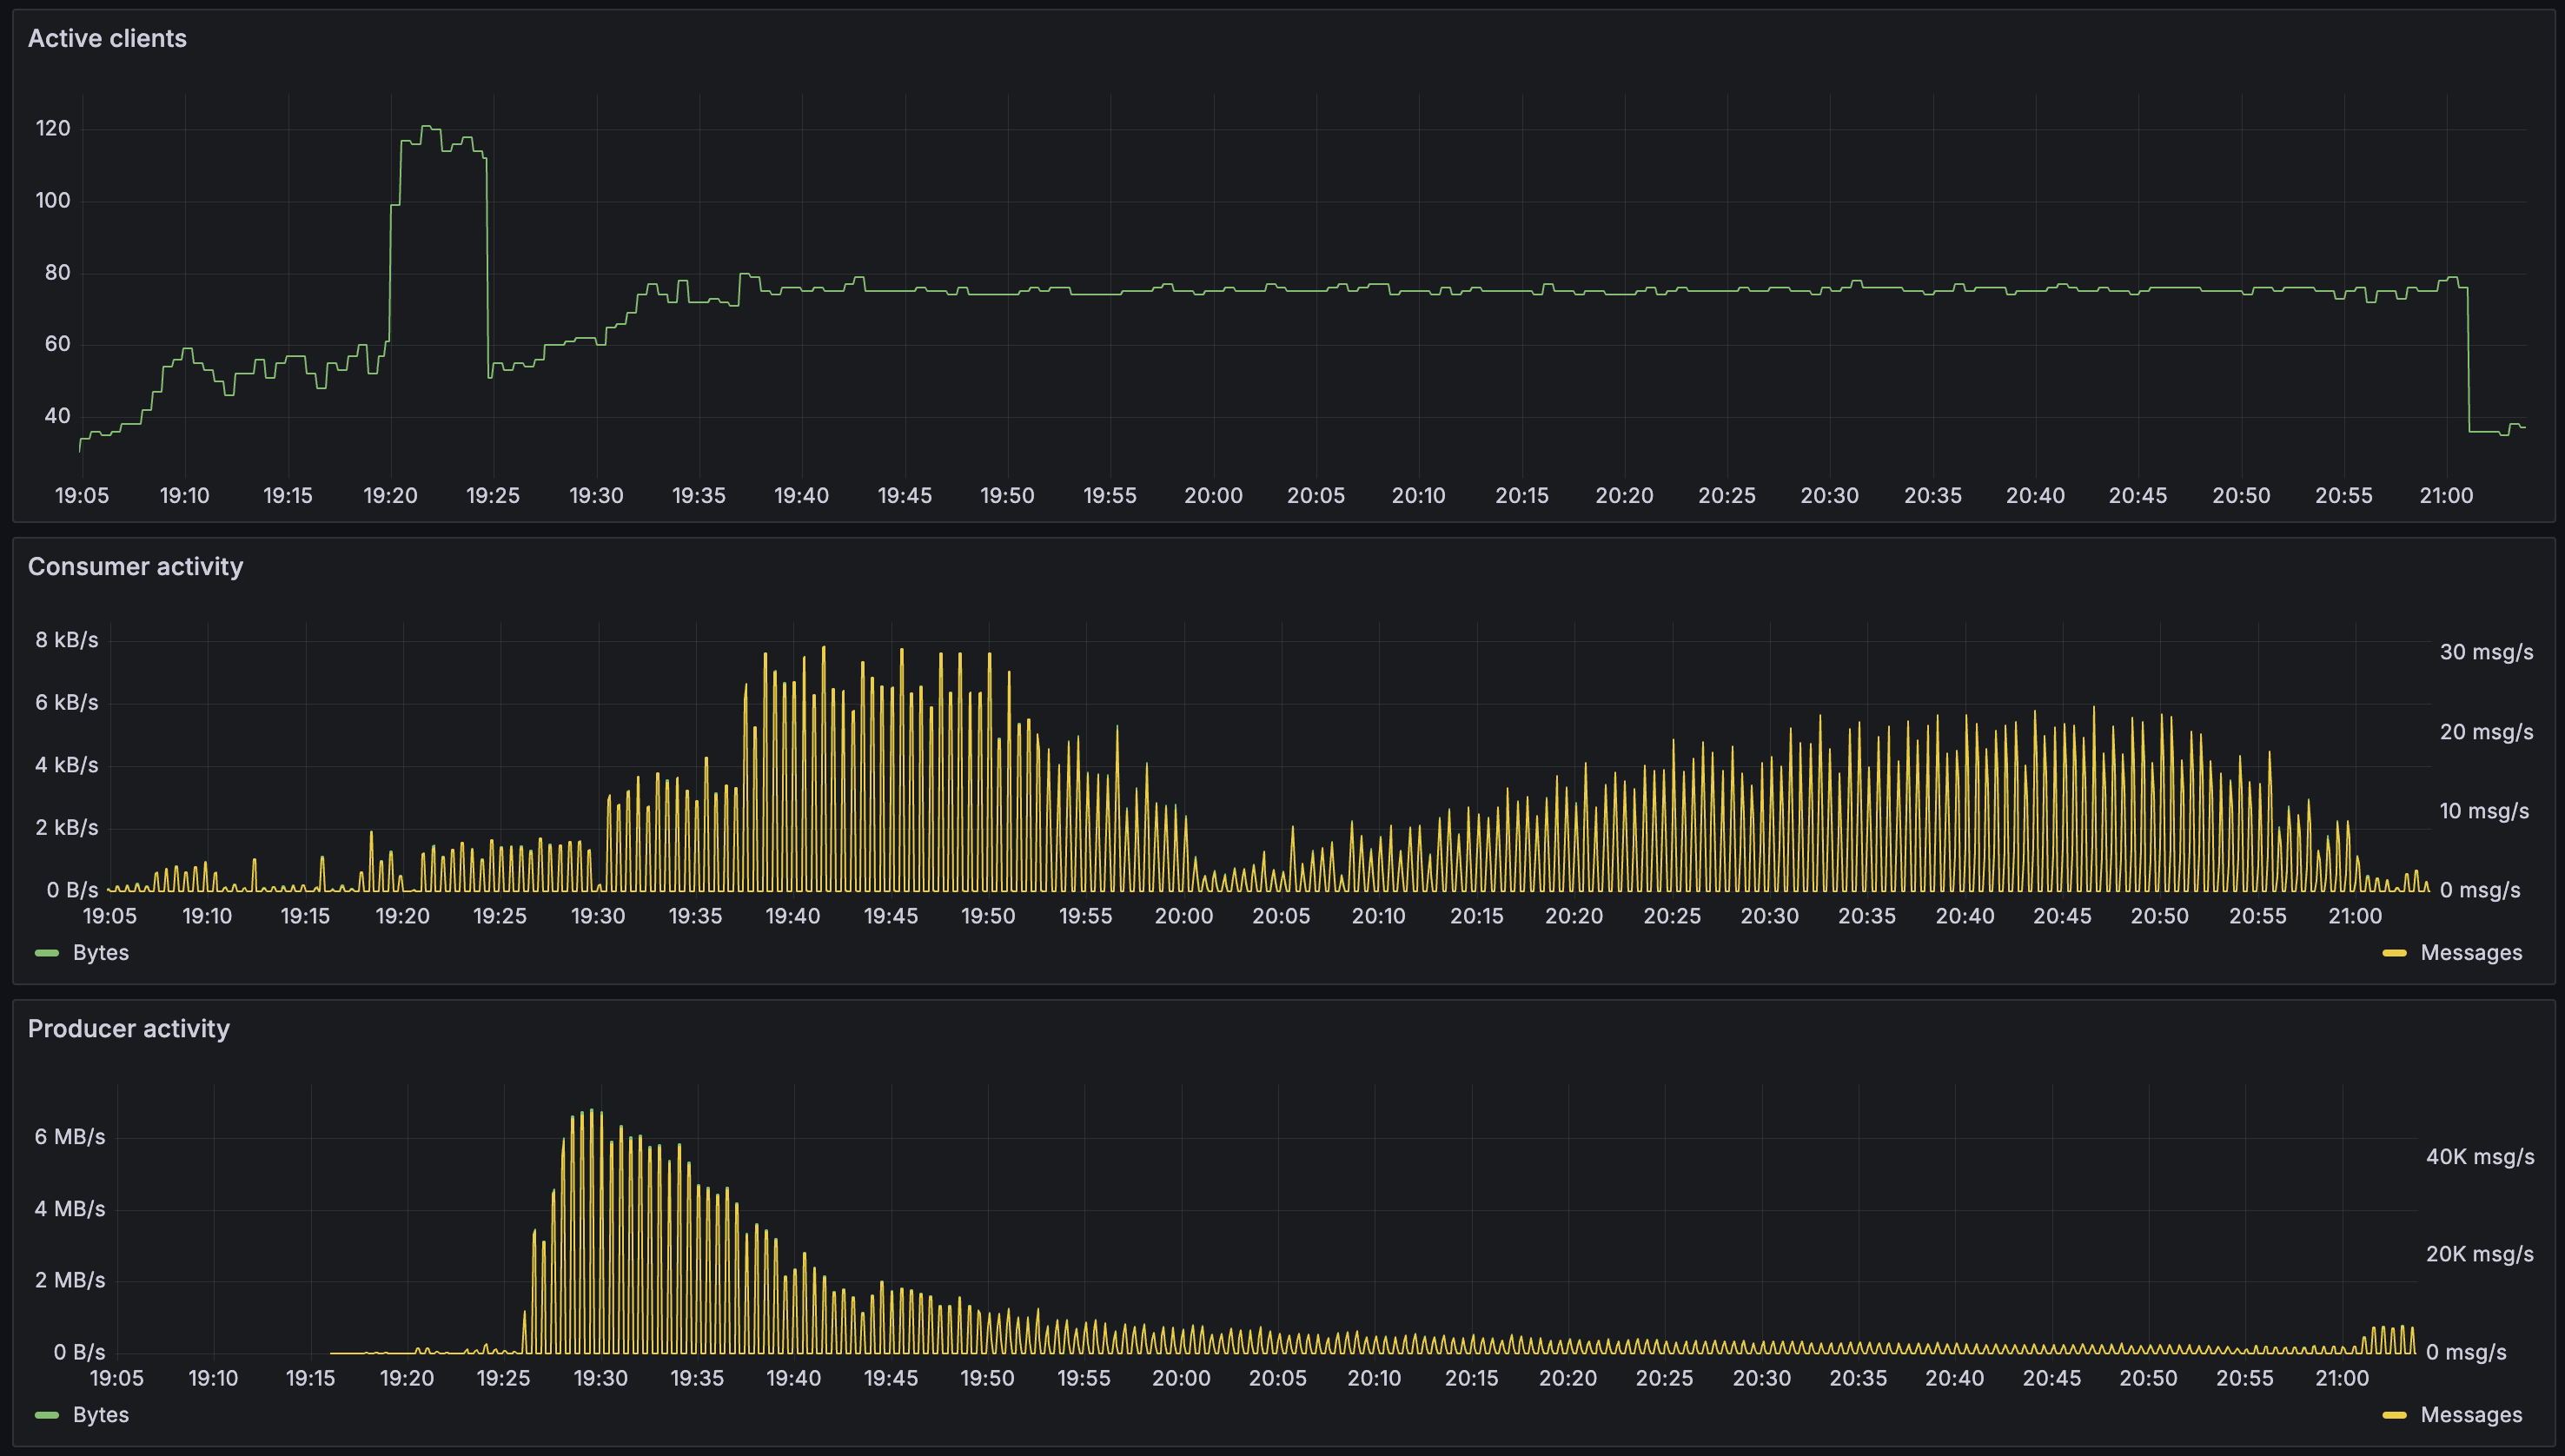
The demo playbook creates a sample Grafana dashboard called Event Endpoint Management (Activity) to show the sorts of metrics that can be used to monitor topic usage and application behavior.
View the metrics displayed in this dashboard.
Subscriptions
Some metrics describe the topics that users have created subscriptions for. The first section of the demo dashboard gives examples of the kinds of values that can give insight into which topics in the catalog are currently popular.
Metric: eemmanager_options
All of the visualizations in this section use the same metric, visualizing the data in different ways.
Note: If you have completed the earlier Event Automation tutorials, you will have already created subscriptions for some topic. If you have not already done this, you can subscribe to some of the topics now to see this reflected in the dashboard.
Most popular topics
The table in the demo dashboard uses this metric to display the topics in the catalog which have had the most subscriptions created for them. This is an example of how metrics can be used to identify which of the topics are currently getting the most attention.
Number of topics
The number of active topics in the catalog uses this metric to show how many shared topics are being used.
Subscriptions
The time series visualization shows how the number of subscriptions for each topic changes over time. This is an example of how you can see increases in interest and popularity for some topics in the catalog.
Applications
Some metrics describe the applications that are currently using topics in the catalog. The second section of the demo dashboard give examples of the kinds of values that can give insight into what applications are doing.
Active clients
Metric: eemgateway_connected_clients
As applications that use topics from the catalog start and stop, you will see the number of connected clients reflected in the first graph.
Note: When using topics with multiple partitions, each connection to a partition is reflected as a separate connected client in this graph.
Consumer activity
Metrics: eemgateway_consumers_bytes_total and eemgateway_consumers_msgs_total
These metrics measure the data that is being received through the Event Gateway by Kafka consumer applications (both as a data quantity in bytes, and as a number of Kafka messages).
The metrics provide granular records about individual applications, but in the demo dashboard these are aggregated to provide an overall view of application activity.
This is a good summary of the level of traffic that the Event Gateway is handling.
Producer activity
Metrics: eemgateway_producers_bytes_total and eemgateway_producers_msgs_total
These metrics measure the data that is being delivered to Kafka topics through the Event Gateway by Kafka producer applications (both as a data quantity in bytes, and as a number of Kafka messages).
The metrics provide granular records about individual applications, but in the demo dashboard these are aggregated to provide an overall view of application activity.
This is a good summary of the level of traffic that the Event Gateway is handling.
Poorly-behaved applications
Some metrics provide an insight into applications that are doing things that owners of topics in the catalog might not approve of. The final section of the demo dashboard gives examples of these kinds of metrics.
Rejected clients
Metrics: eemgateway_login_failed_total and eemgateway_topic_authz_failed_total
These metrics measure the connection attempts (per second) that have been rejected by the Event Gateway.
To see an application reported as login failed, you can run a Kafka application (such as kafka-console-consumer.sh) using a username and password that was not created in Event Endpoint Management.
To see an application reported as auth failed, you can run a Kafka application (such as kafka-console-consumer.sh) using credentials created in Event Endpoint Management, but attempting to access a different topic from the catalog.
In a real cluster, occasional errors such as this would not be a cause for concern, as users will accidentally use incorrect credentials with their applications. A large or consistent number of errors would need further investigation.
Throttled clients
Metric: eemgateway_quota_delay
Some metrics provide insight into the controls that the Event Gateway are applying. The demo dashboard uses one of these to show the impact of quota enforcement controls. The time series graph shows the delay that has been applied to different applications.
Selecting metrics
The descriptions earlier of each of the metrics used in this tutorial includes the metric name as documented in the metrics reference.
The demo dashboards used in this tutorial are not intended to be an exhaustive representation of the metrics available for Event Endpoint Management users. The intent of this tutorial is to encourage you to consider what your objective is for monitoring Event Endpoint Management. Use the examples described here as a starting point for exploring the metrics reference and selecting appropriate metrics for your use case.
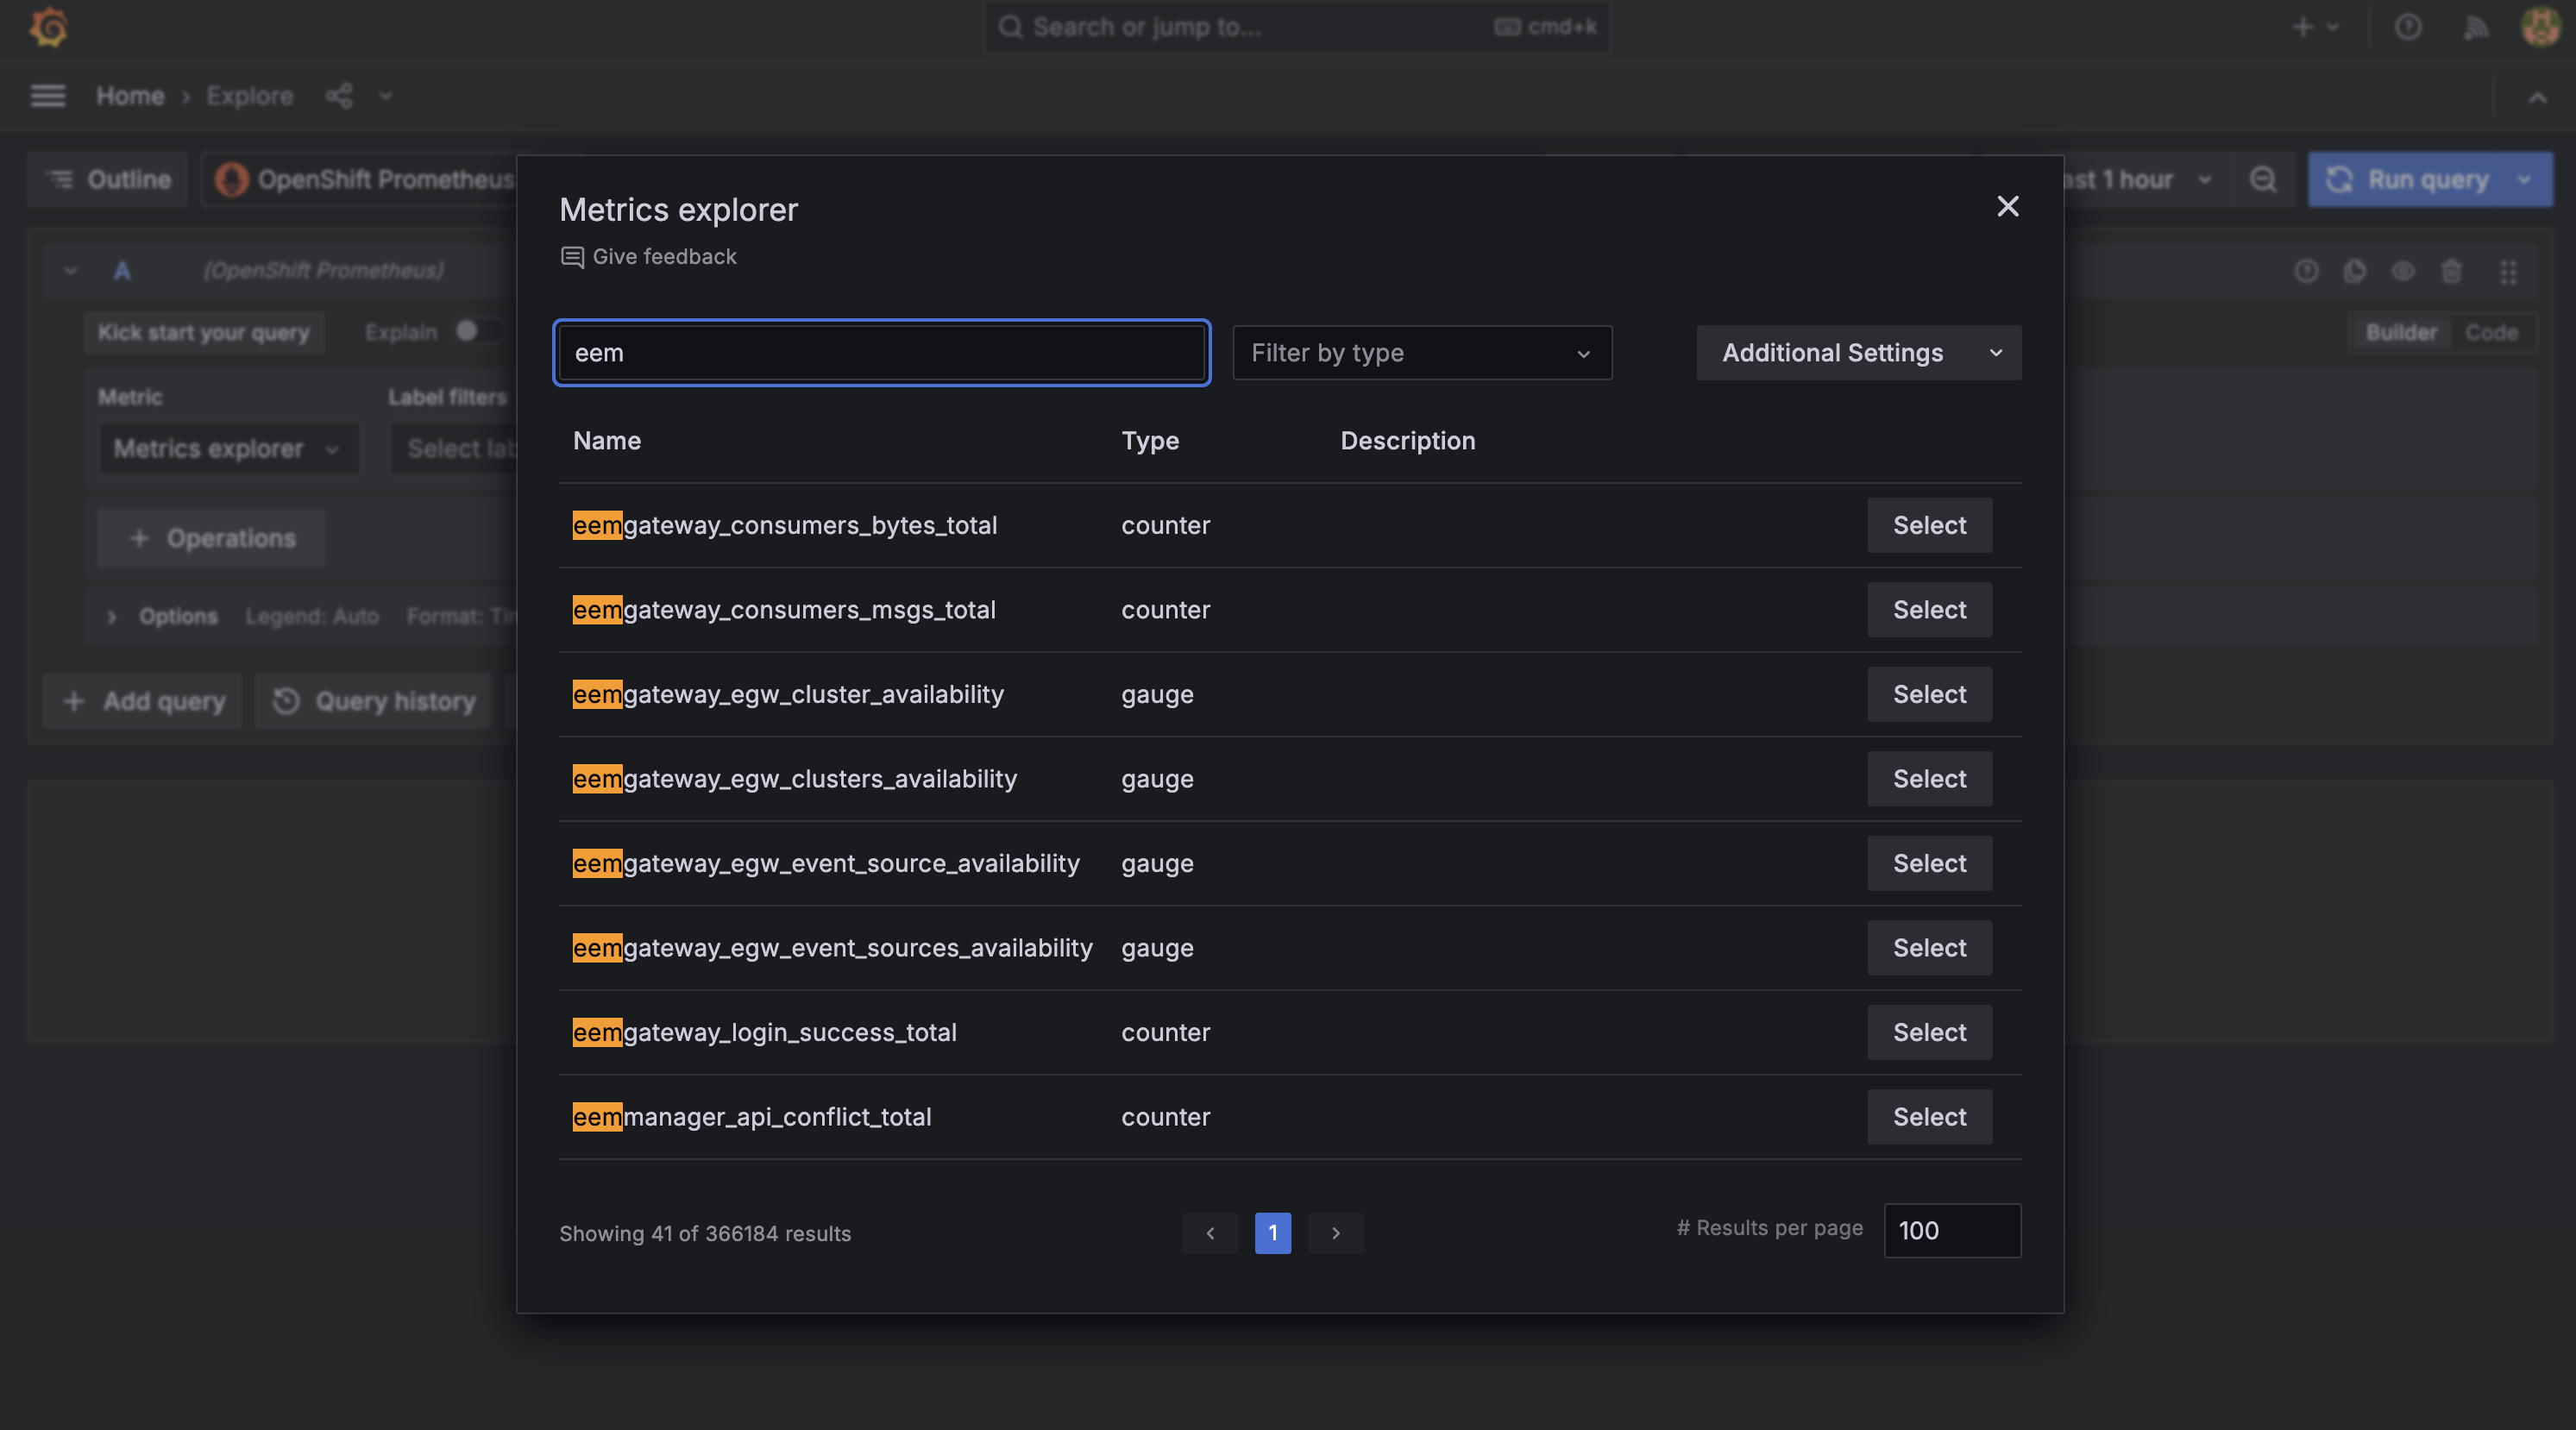
You can use the Grafana installation provided by the demo playbook to explore and experiment with the metrics that are available in the Grafana dashboard. The Explore section for the data source is a useful way to try this.
After you have identified the metrics you want to collect, you can follow the instructions for configuring monitoring to collect these metrics in your (non-demo) Event Endpoint Management.
Next steps
If you have not yet explored the options for monitoring Event Streams, you can follow the Monitoring Event Streams cluster health tutorial, which uses the same Grafana instance as this tutorial. This is an example of how you can collect metrics for your whole IBM Event Automation deployment into a single place.
