Before you begin
The instructions in this tutorial use the tutorial environment, which includes a selection of topics each with a live stream of events, created to allow you to explore features in IBM Event Automation. Following the setup instructions to deploy the demo environment gives you a complete instance of Event Automation that you can use to follow this tutorial for yourself.
Versions
This tutorial uses the following versions of Event Automation capabilities. Screenshots might differ from the current interface if you are using a newer version.
- Event Streams 11.6.1
Choosing a monitoring platform
The focus of this tutorial is to illustrate the types of monitoring that can be useful for Event Streams, and the sorts of metrics that you can use to enable this.
Grafana is used in this tutorial to display metrics, but it is not required for monitoring Event Streams. There are many alternative options available that can be used to visualize these metrics or to trigger alerts and notifications when they change.
Choosing the best monitoring platform depends on your specific use case and is beyond the scope of this tutorial. For an overview of available options, see Monitoring Kafka cluster health.
Instructions
-
Set up monitoring in the tutorial environment.
This installs the Grafana community operator and creates two sample Grafana dashboards to help you get started.
-
Access the tutorial dashboards.
The following sections of this tutorial will explain how to use these dashboards.
Monitoring use cases
There are many reasons for an Event Streams administrator to use metrics. This tutorial focuses on two common use cases:
-
Health monitoring - Ensuring that the Event Streams cluster is healthy, and detecting early warnings of potential problems that need attention.
-
Performance monitoring - Assessing the workload the cluster is currently supporting, and identifying signs that the cluster is struggling to support the workload.
There is naturally overlap between these two use cases. Some metrics could be helpful for both use cases, and the objective of this tutorial is not to try and classify the available metrics.
Monitoring is not a single one-size-fits-all activity. The goal of this tutorial is to encourage you to consider what your objective is, and to select metrics to monitor that support that objective.
Note: The focus of this tutorial is on use cases for cluster administrators. Other users also monitor Kafka metrics. For example, users responsible for applications that use an Event Streams cluster can monitor metrics specific to their application and the Kafka topics that their application uses.
Monitoring cluster health
A common use case for Event Streams metrics is ensuring that the cluster is functioning correctly, and identifying any issues that require attention.
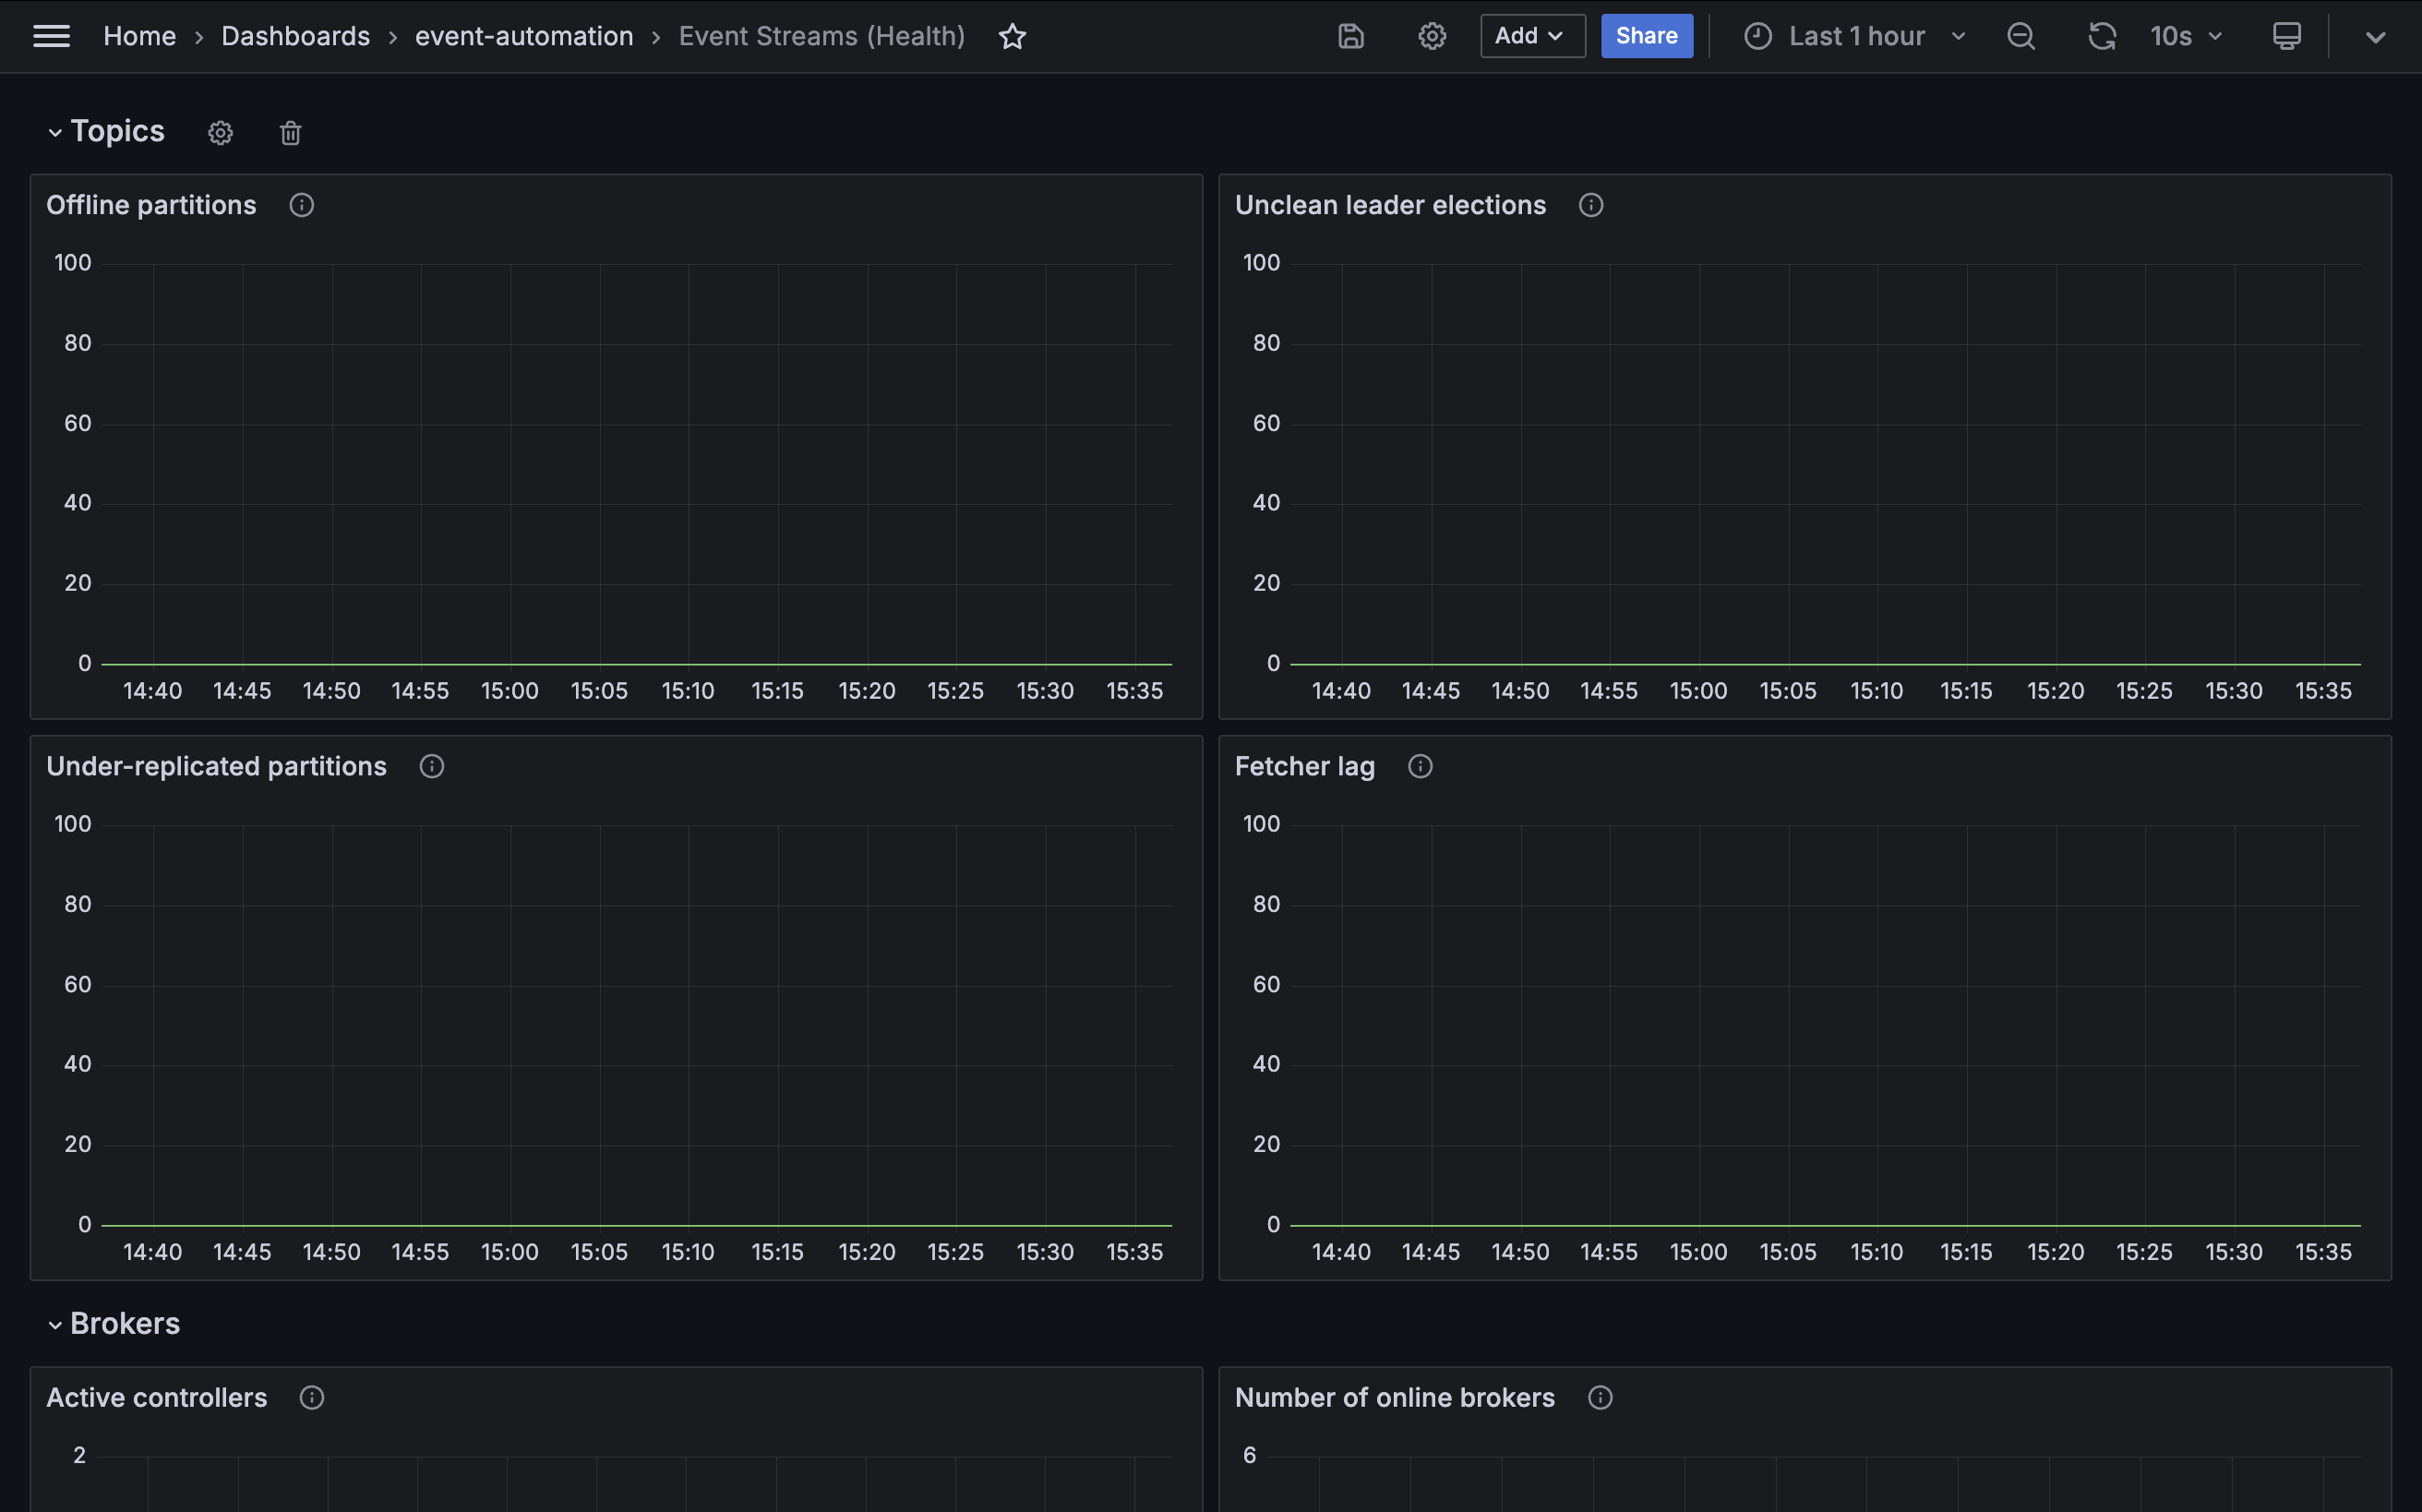
The demo playbook creates a sample Grafana dashboard called Event Streams (Health), which provides insights into relevant health metrics.
View the metrics displayed in this dashboard to assess the status of your cluster.
Kafka topics
Some metrics indicate the health of the topic partitions within the Event Streams cluster. The first section of the demo dashboard gives examples of the kinds of values that a cluster administrator can monitor for changes.
Offline partitions
Metric: kafka.controller:type=KafkaController,name=OfflinePartitionsCount
An “offline” partition is a topic partition that doesn’t have an active leader.
Without an active leader, client applications cannot produce to or consume from a topic partition. The partition remains unavailable until a leader is restored.
The number of partitions in this state should normally be zero.
Unclean leader elections
Metric: kafka.controller:type=ControllerStats,name=UncleanLeaderElectionsPerSec
A leader election is the process for choosing which replica will be used by producer and consumer client applications.
Normally, an in-sync replica is chosen. However, if there are no in-sync replicas to choose from, the last resort is to select an out-of-sync replica as the new leader.
This results in the loss of some events that were missing on the new leader, and so the number of unclean leader elections should be zero.
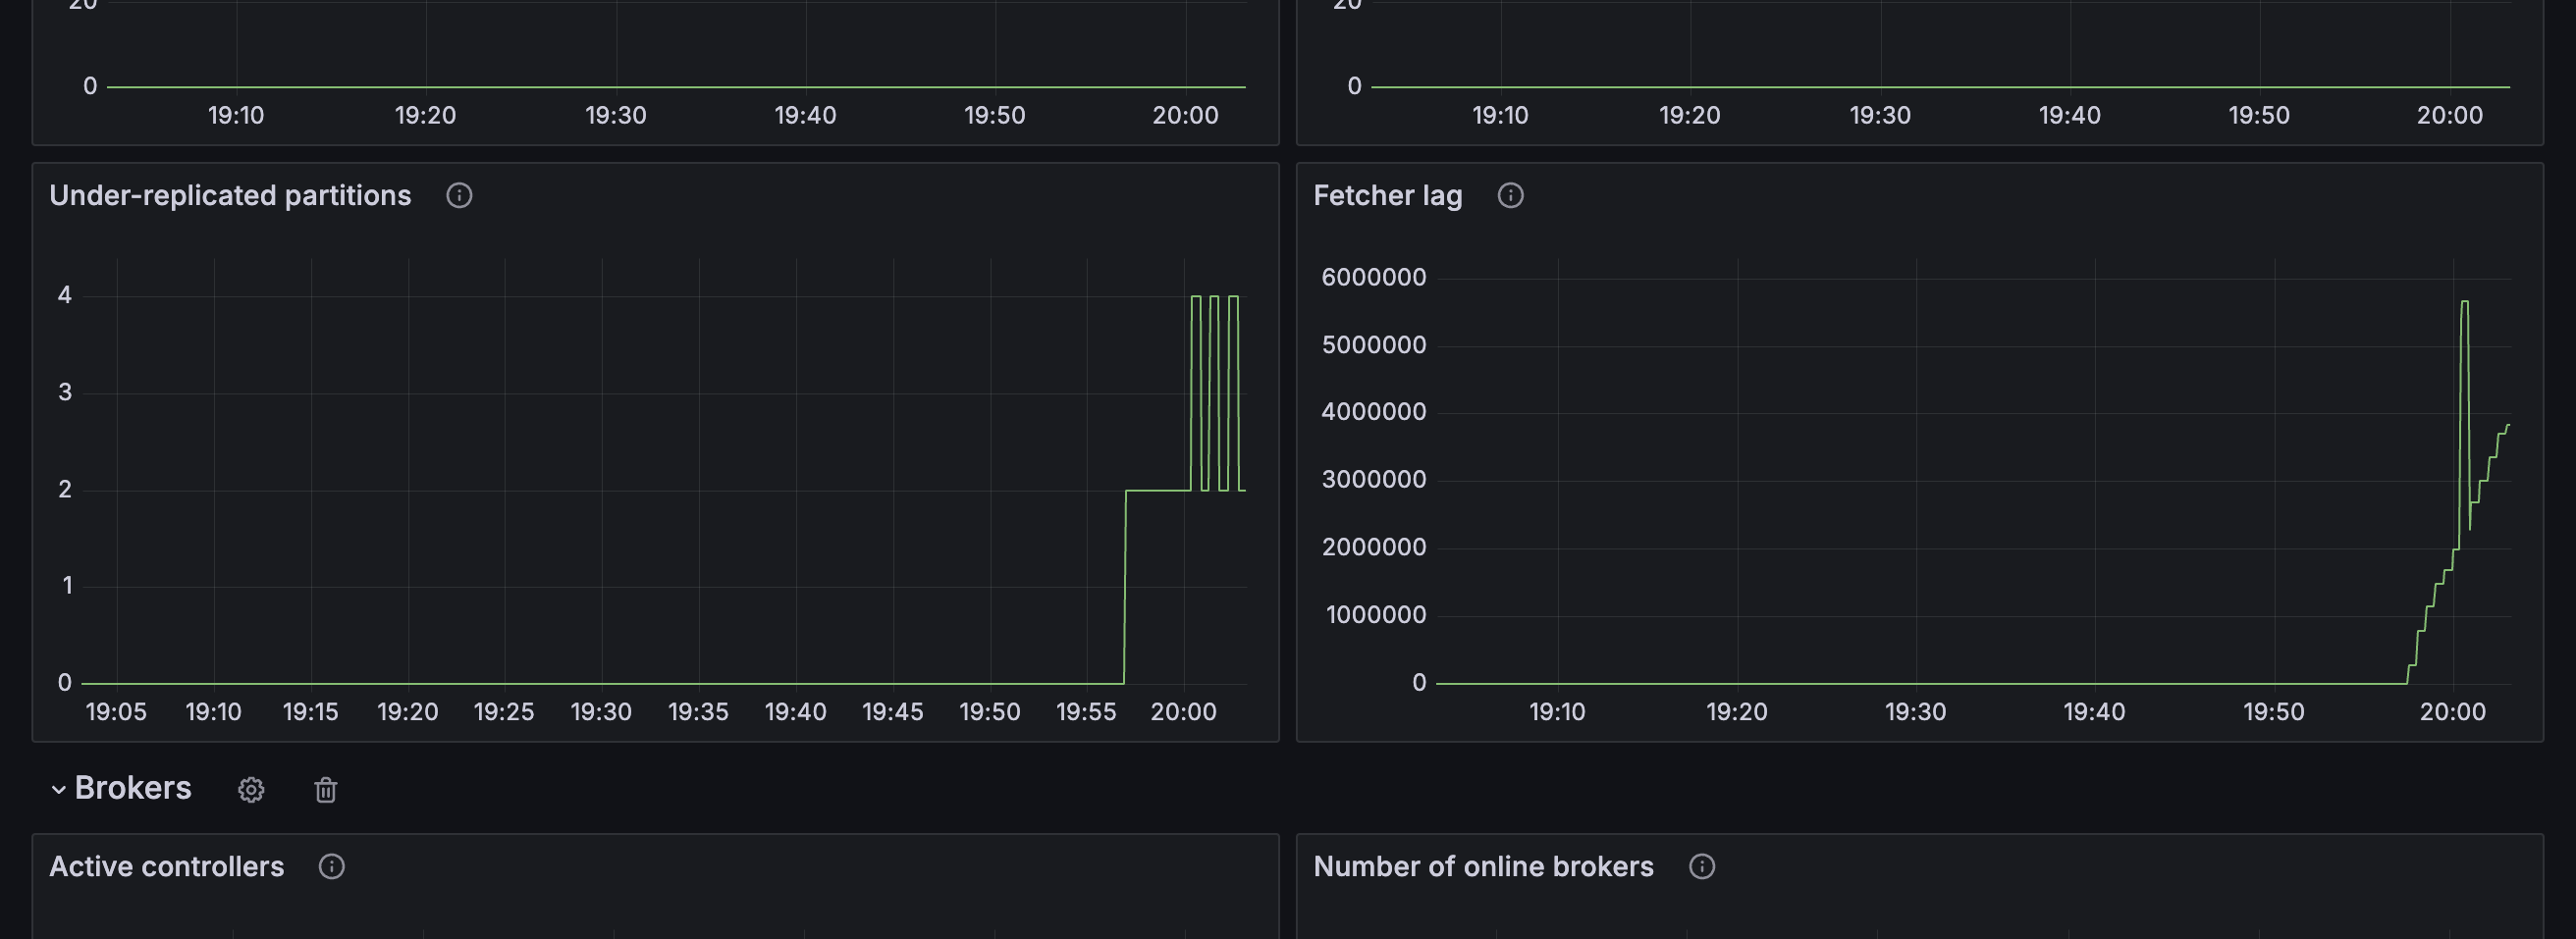
Under-replicated partitions
Metric: kafka.server:type=ReplicaManager,name=UnderReplicatedPartitions
An under-replicated topic partition is a topic partition where some replicas are not keeping up with the partition leader.
This metric should ideally be zero.
Fetcher lag
Metric: kafka.server:type=FetcherLagMetrics,name=ConsumerLag
Fetcher lag measures the number of events follower replicas have yet to retrieve from topic partition leader. It is a measure of whether replication is keeping up and how far behind the topic replicas are falling.
The lag should be less than the maximum batch size used by producer applications, indicating that cluster is able to keep up with the rate of traffic it is handling.
Kafka brokers
Some metrics indicate the health of the Kafka brokers in the Event Streams cluster. The second section of the demo dashboard provides examples of the kinds of values that a cluster administrator can track for changes.
Active controllers
Metric: kafka.controller:type=KafkaController,name=ActiveControllerCount
A Kafka cluster will always have one broker acting as the controller. Several critical cluster operations depend on the controller, such as partition leadership management and replica assignment. If there is no active controller, the cluster might become unstable.
If there is more than one controller, this is described as a split brain and the potential for conflicting decisions by multiple controllers risks data integrity.
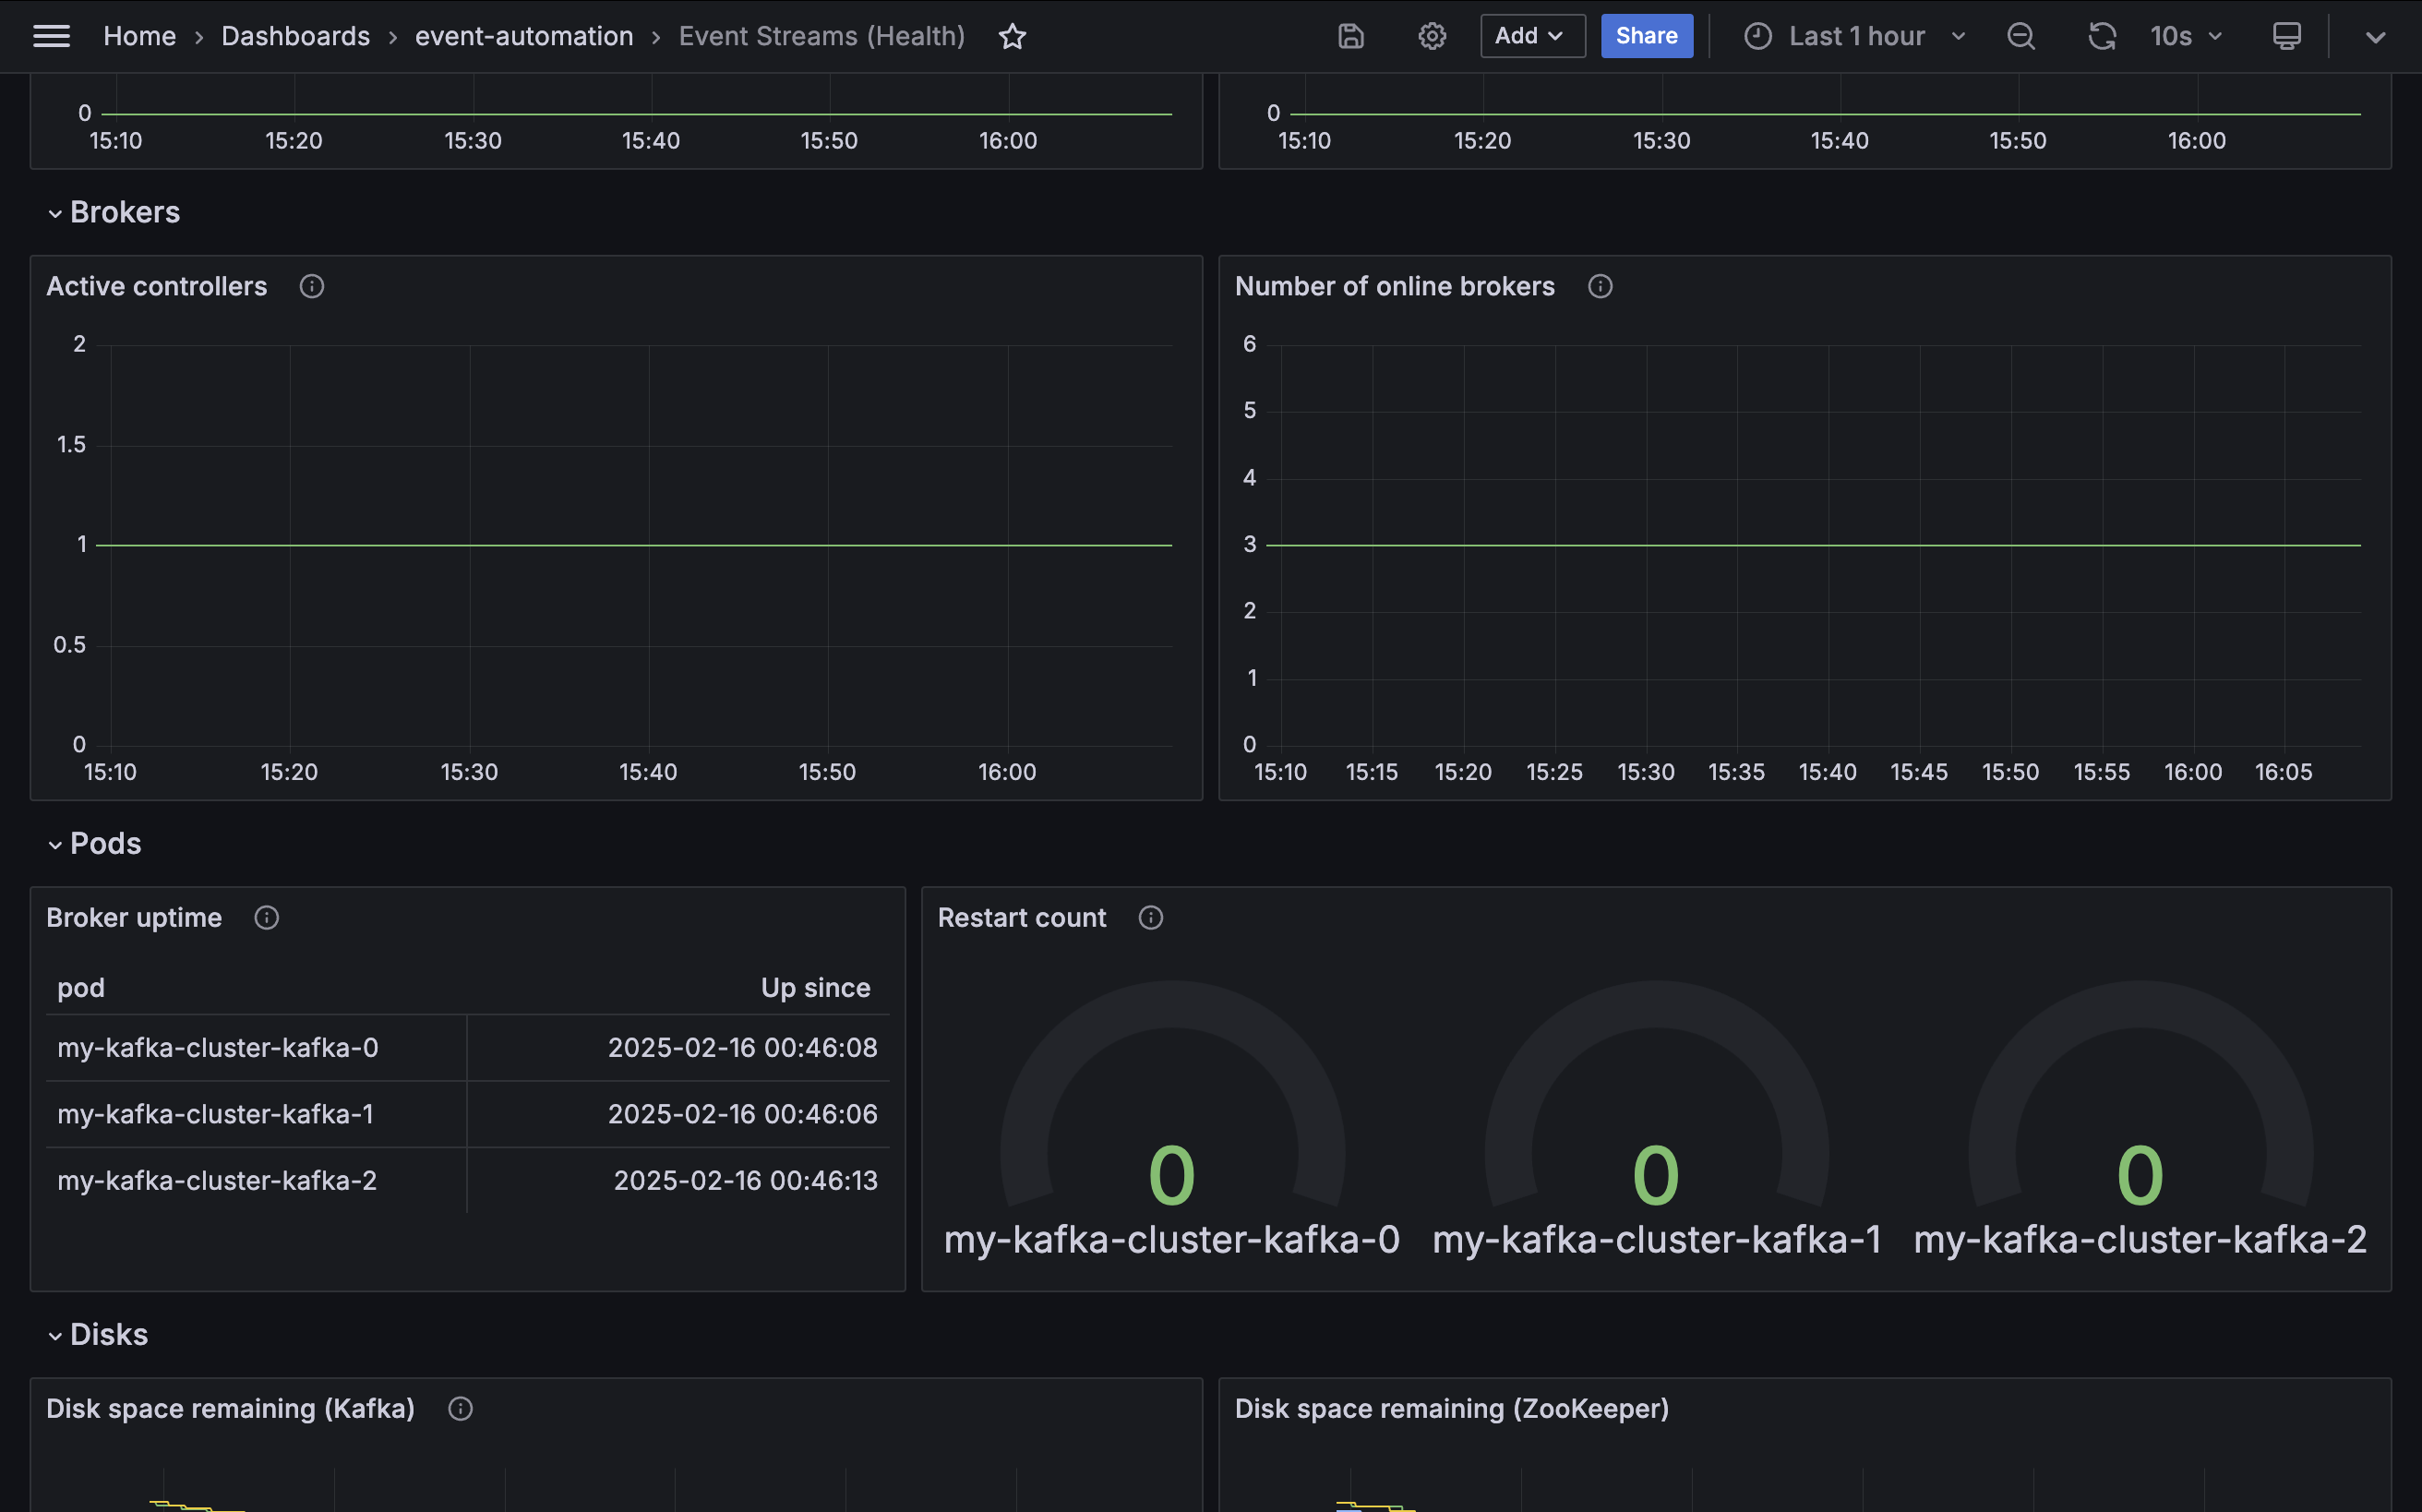
The value for this metric should always be one (you might briefly see zero or two while the cluster transfers control to a different broker, but this should quickly return to one).
Number of online brokers
Metric: kafka.controller:type=KafkaController,name=ActiveBrokerCount
Kafka’s high-availability design allows applications to continue to functioning even after a broker fails. As a result, it is important to monitor that all brokers are currently online, as the loss of a broker cannot always be detected by application behavior.
The Event Streams cluster created by the tutorial playbook has three brokers.
Kafka pods
Kubernetes is also a useful source of metrics about the Kafka brokers that make up the Event Streams cluster. The third section of the demo dashboard gives examples of the kinds of values that a cluster administrator can use.
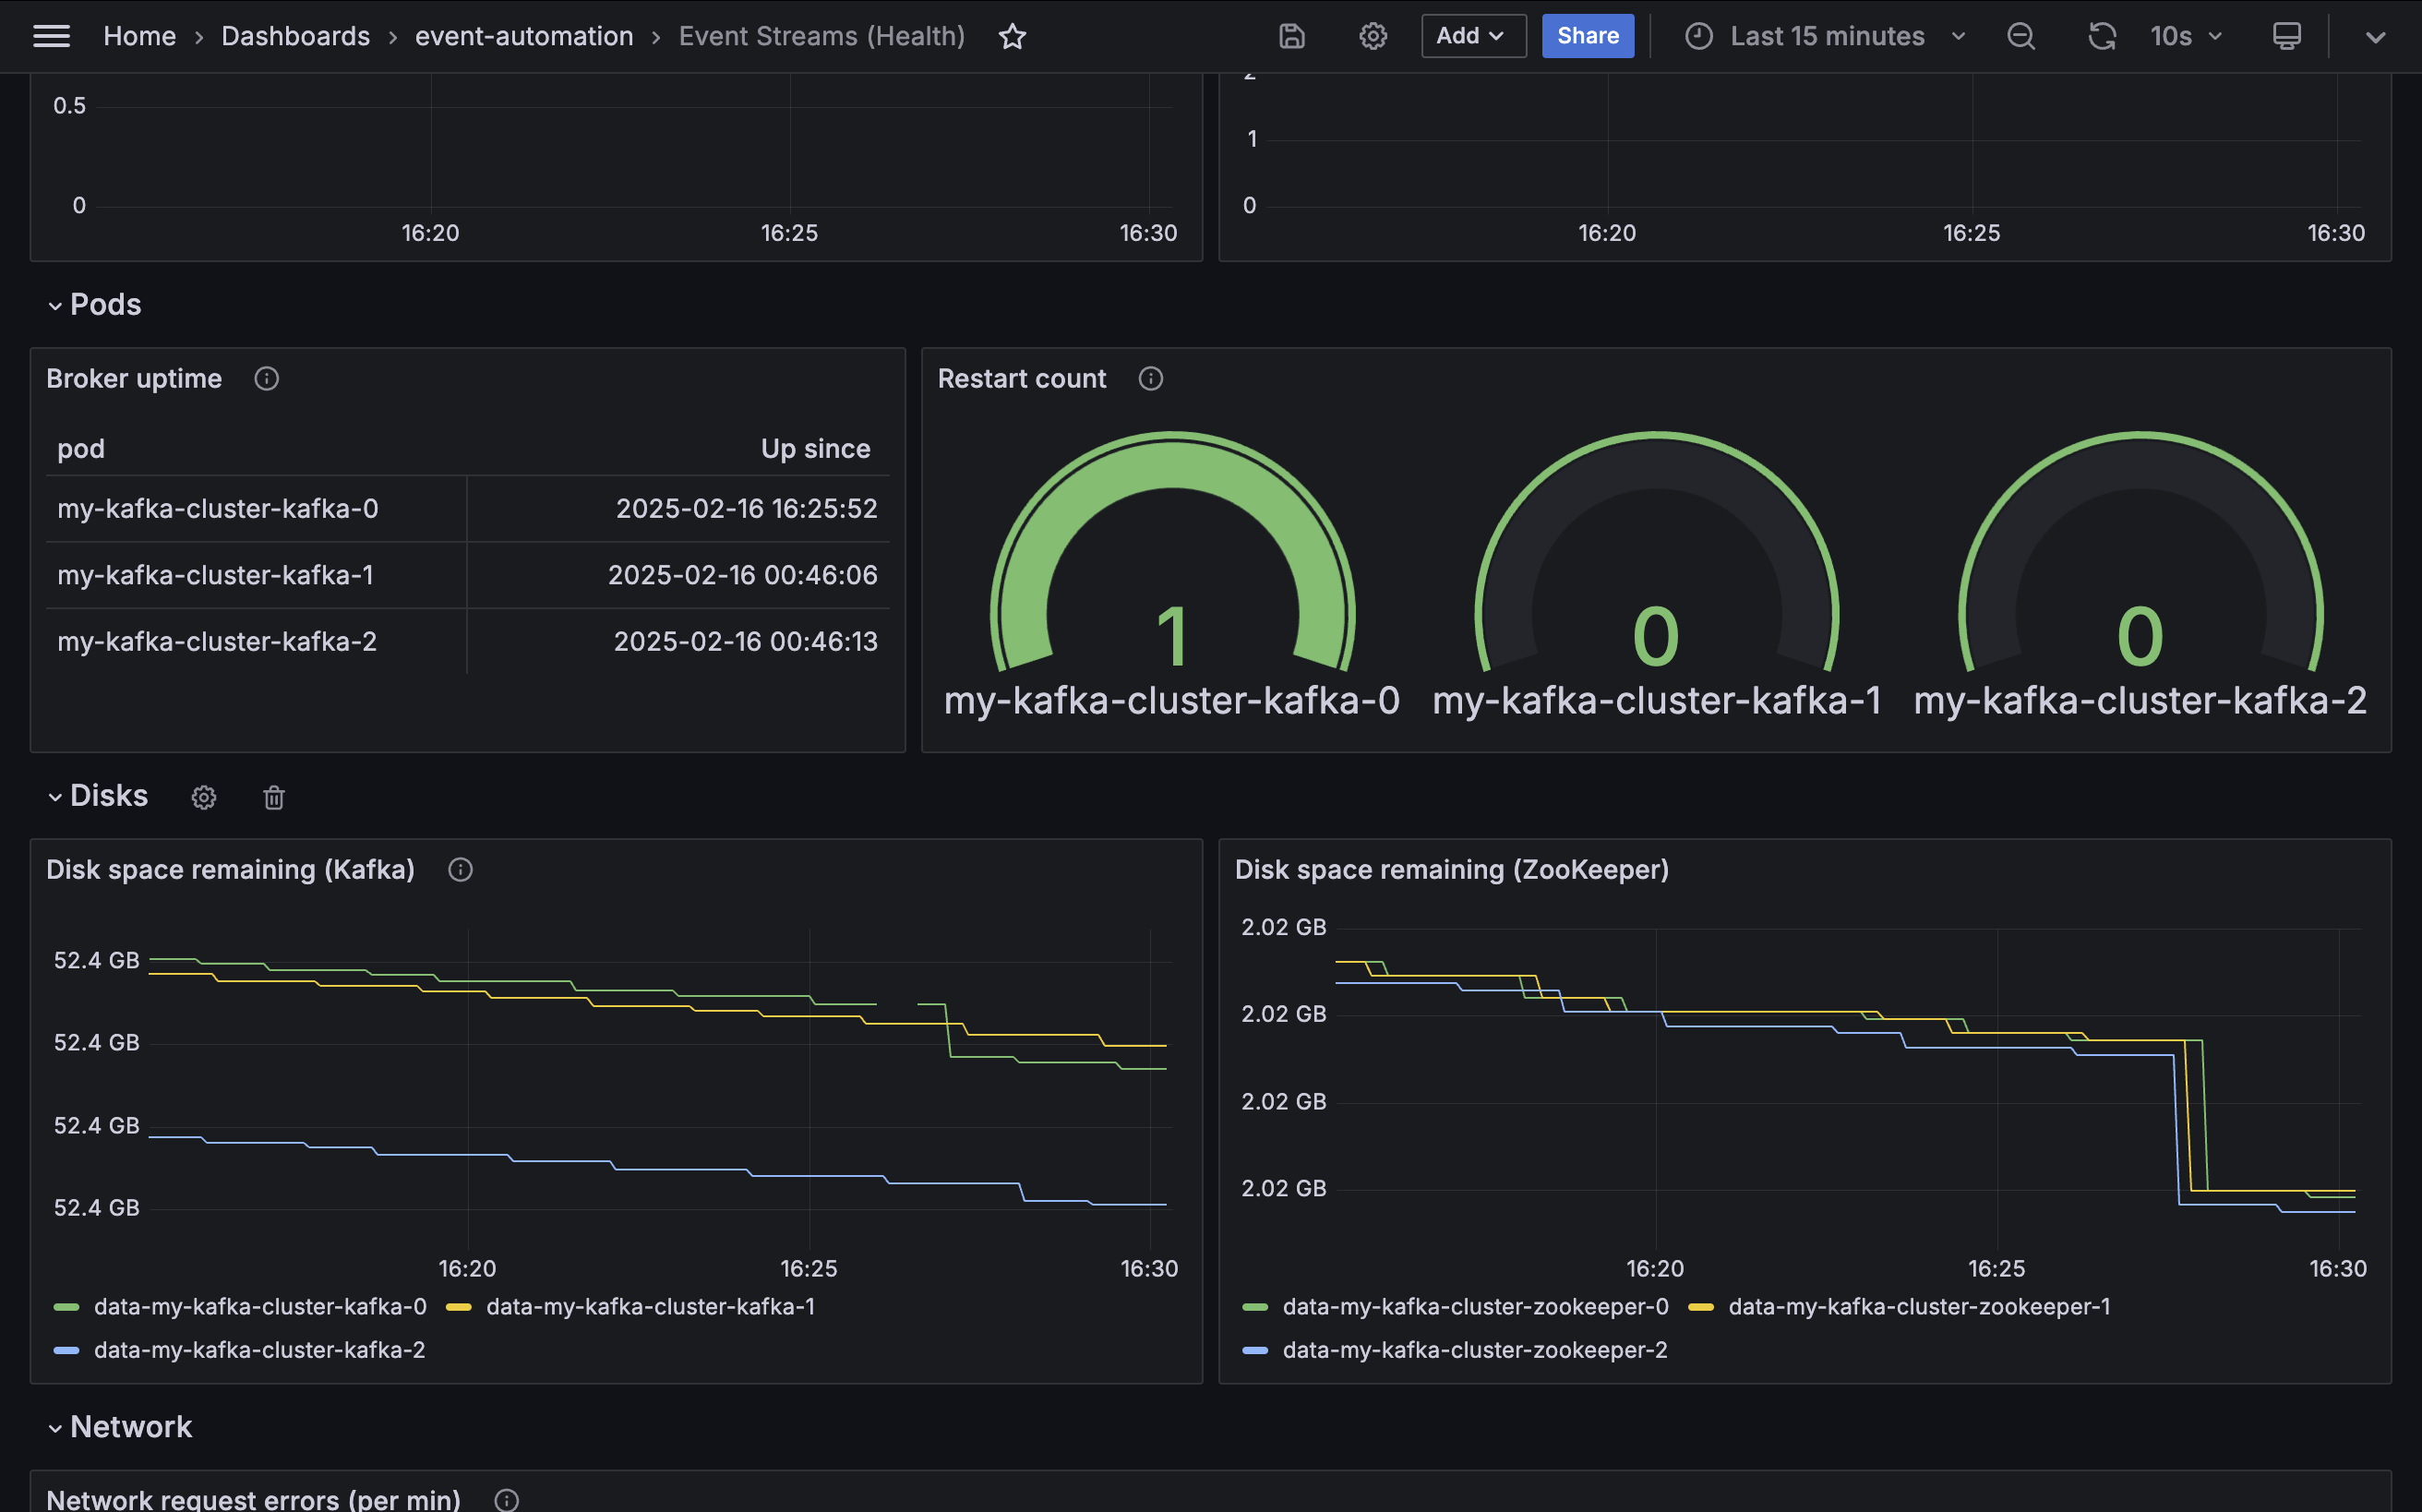
Broker uptime
Metric: kube_pod_container_state_started
If the start time for a Kafka broker is more recent than the last time a Kafka broker pod was administratively modified or restarted, this indicates an unexpected restart.
Restart count
Metric: kube_pod_container_status_restarts_total
If the Kubernetes probes registered by Event Streams fail, then Kubernetes will restart the Kafka container. The number of restarts will be zero for a healthy broker.
Disks
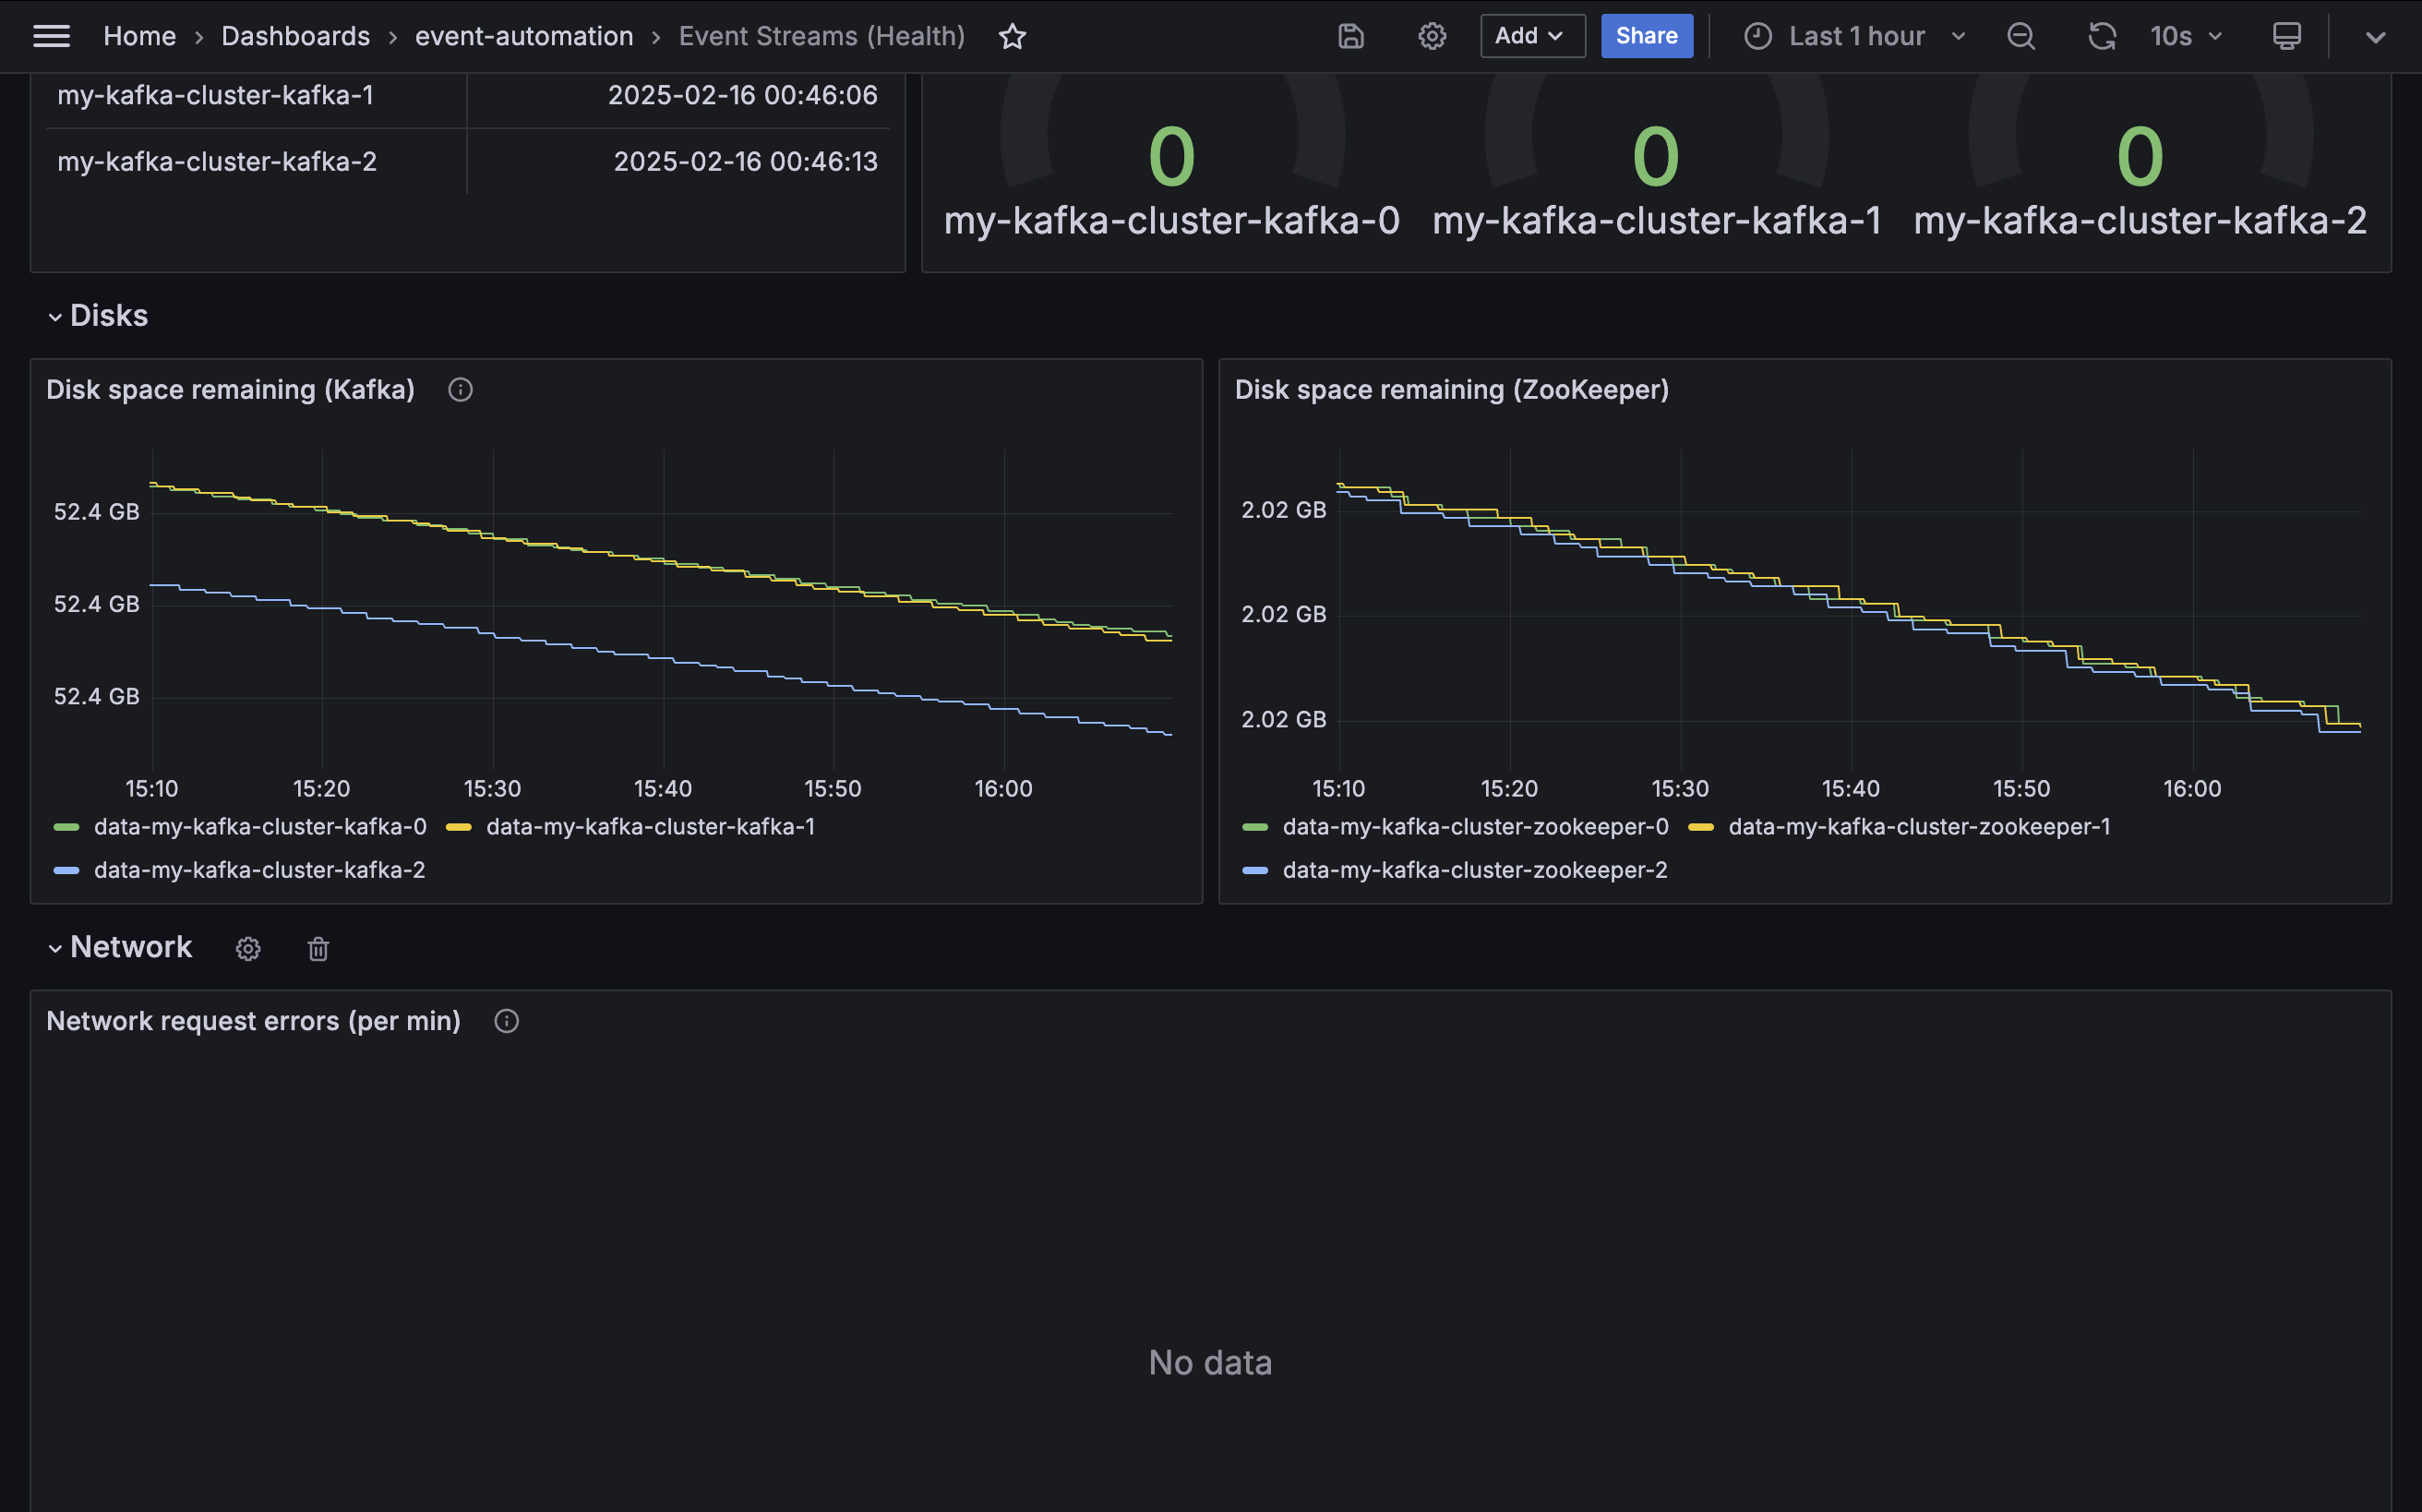
Some metrics indicate the health of the disks used by Kafka brokers. The fourth section of the demo dashboard gives examples of the kinds of values that a cluster administrator can monitor.
Disk space remaining
Metric: kubelet_volume_stats_available_bytes
Disk space for Kafka brokers must be closely monitored. If Kafka fills the disk space available to it, it leads to error conditions that are difficult to resolve.
An administrator must take action long before the disk becomes full. Monitoring the remaining disk space for each broker is a key part of this.
Network
Some metrics indicate the network activity by Kafka brokers. The fifth section of the demo dashboard gives examples of the kinds of values that a cluster administrator can monitor.
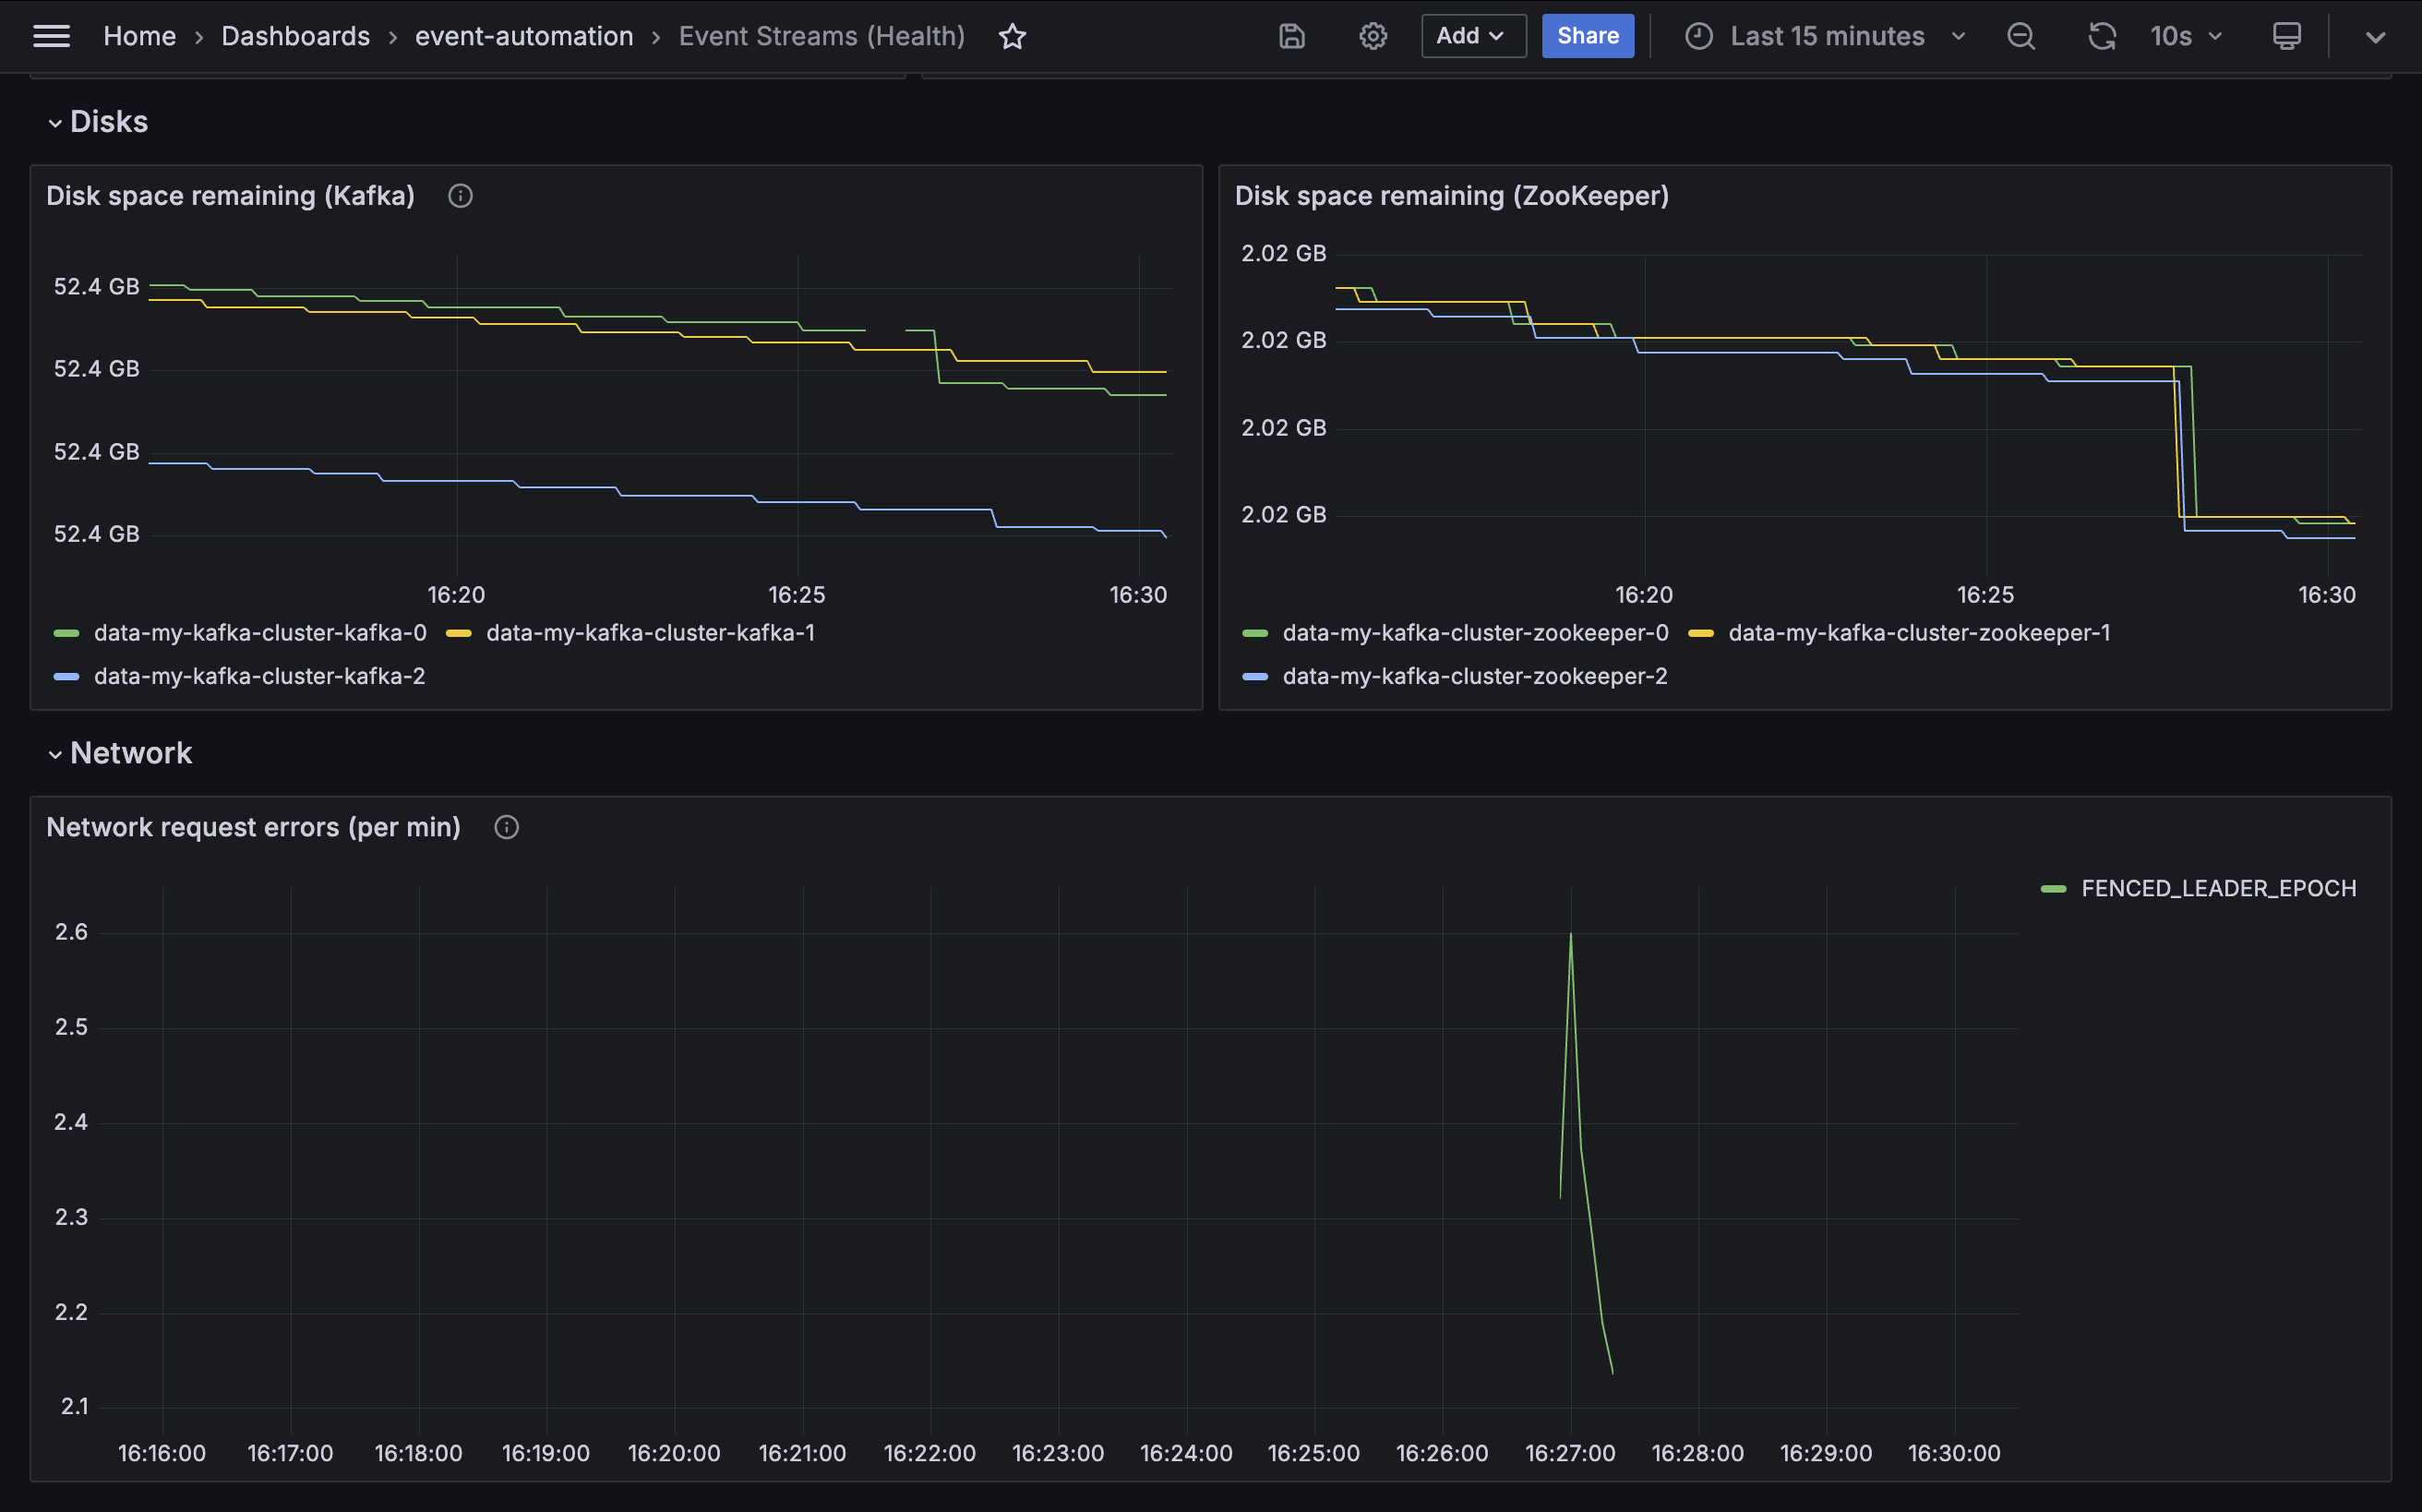
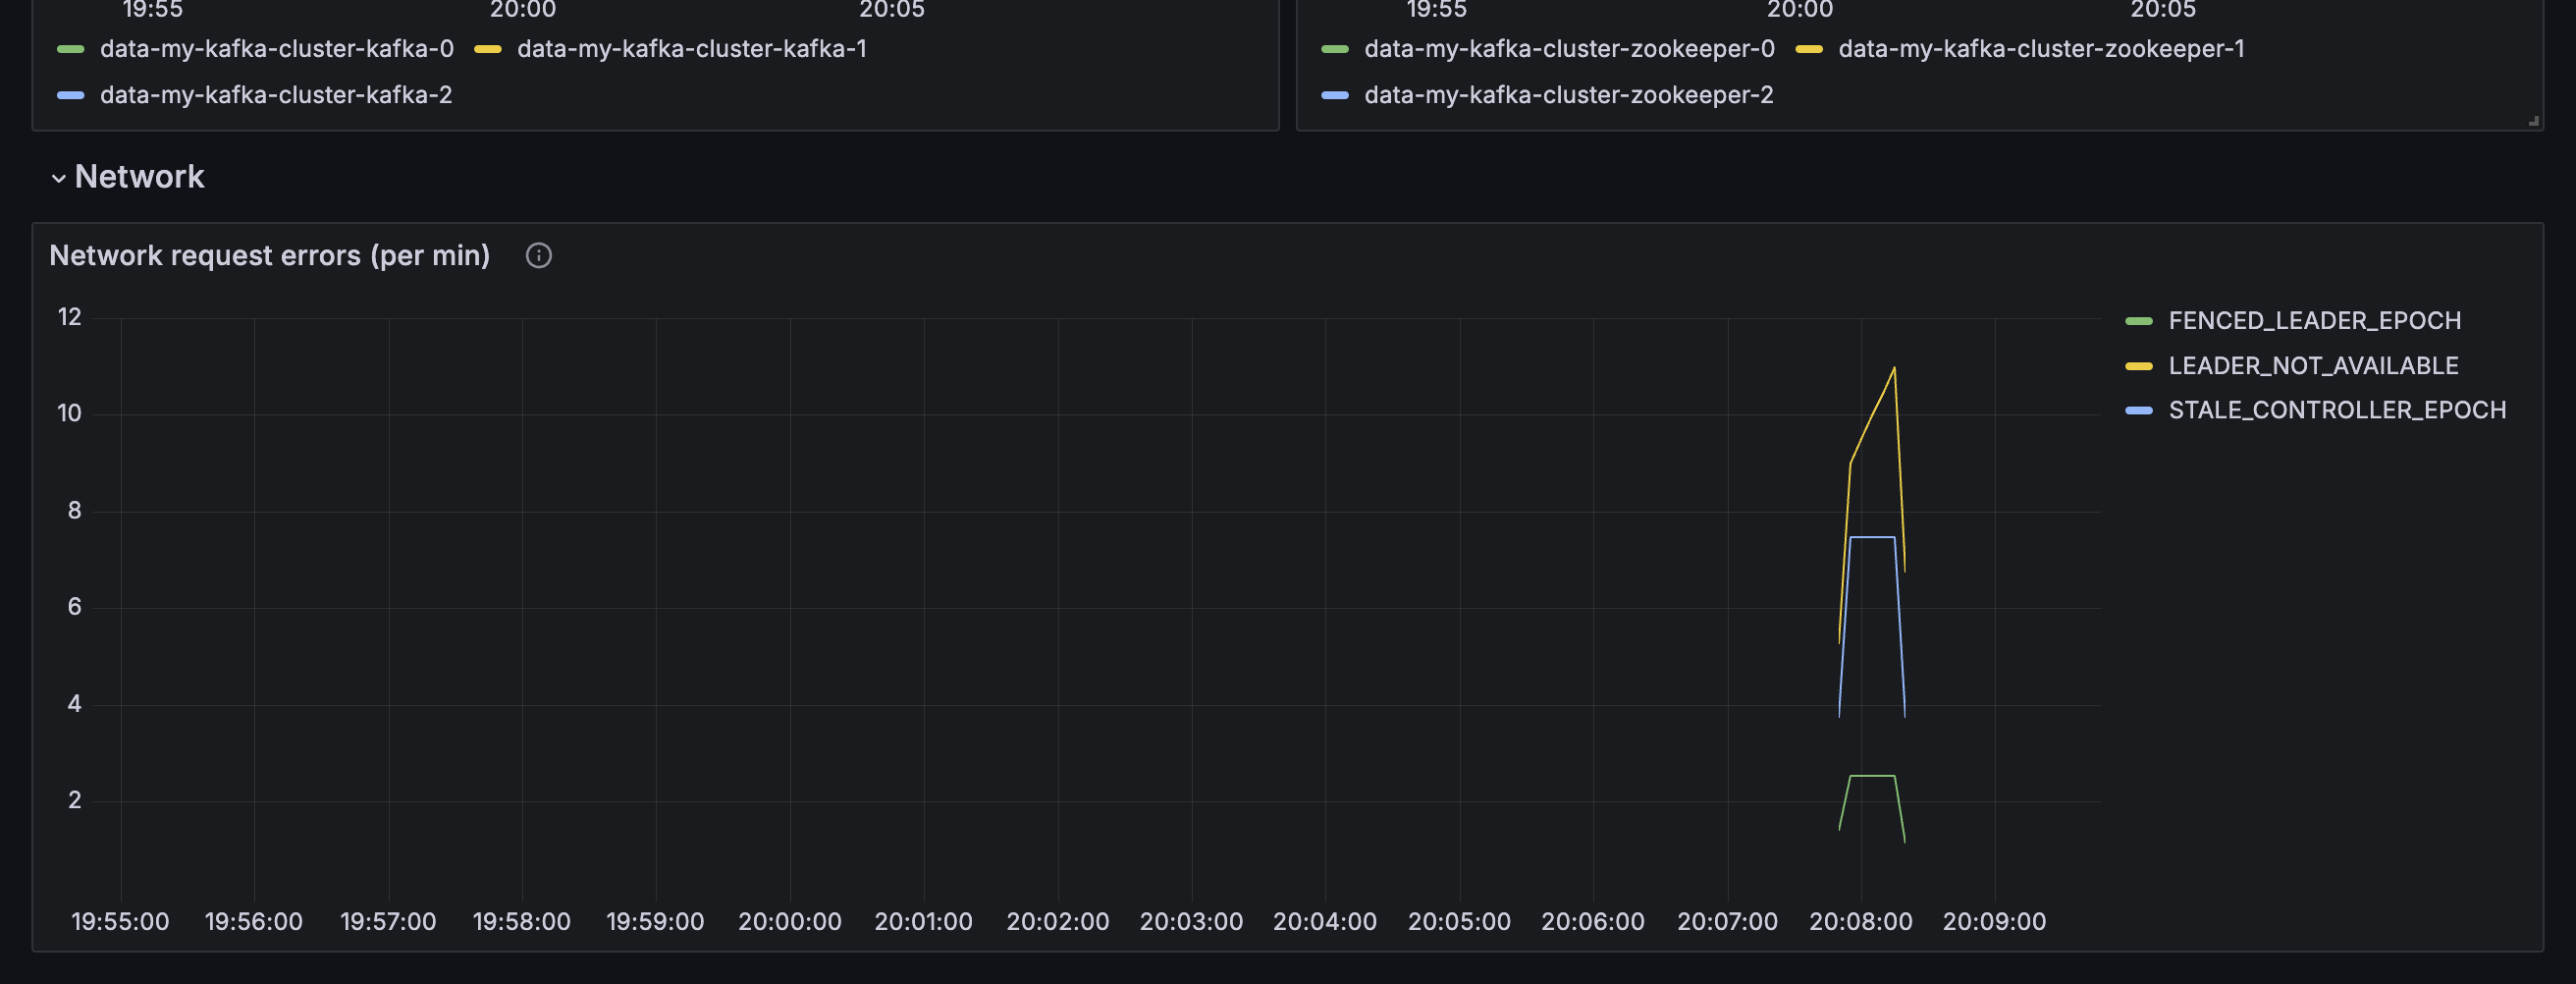
Network request errors
Metric: kafka.network:type=RequestMetrics,name=ErrorsPerSec
A healthy Kafka cluster should report zero network errors.
If sustained network errors are reported, this will likely impact consumer and producer applications and needs attention.
Using the dashboard
The health dashboard will likely not contain a lot of interesting data for your tutorial cluster. Most of the values displayed will be zero.
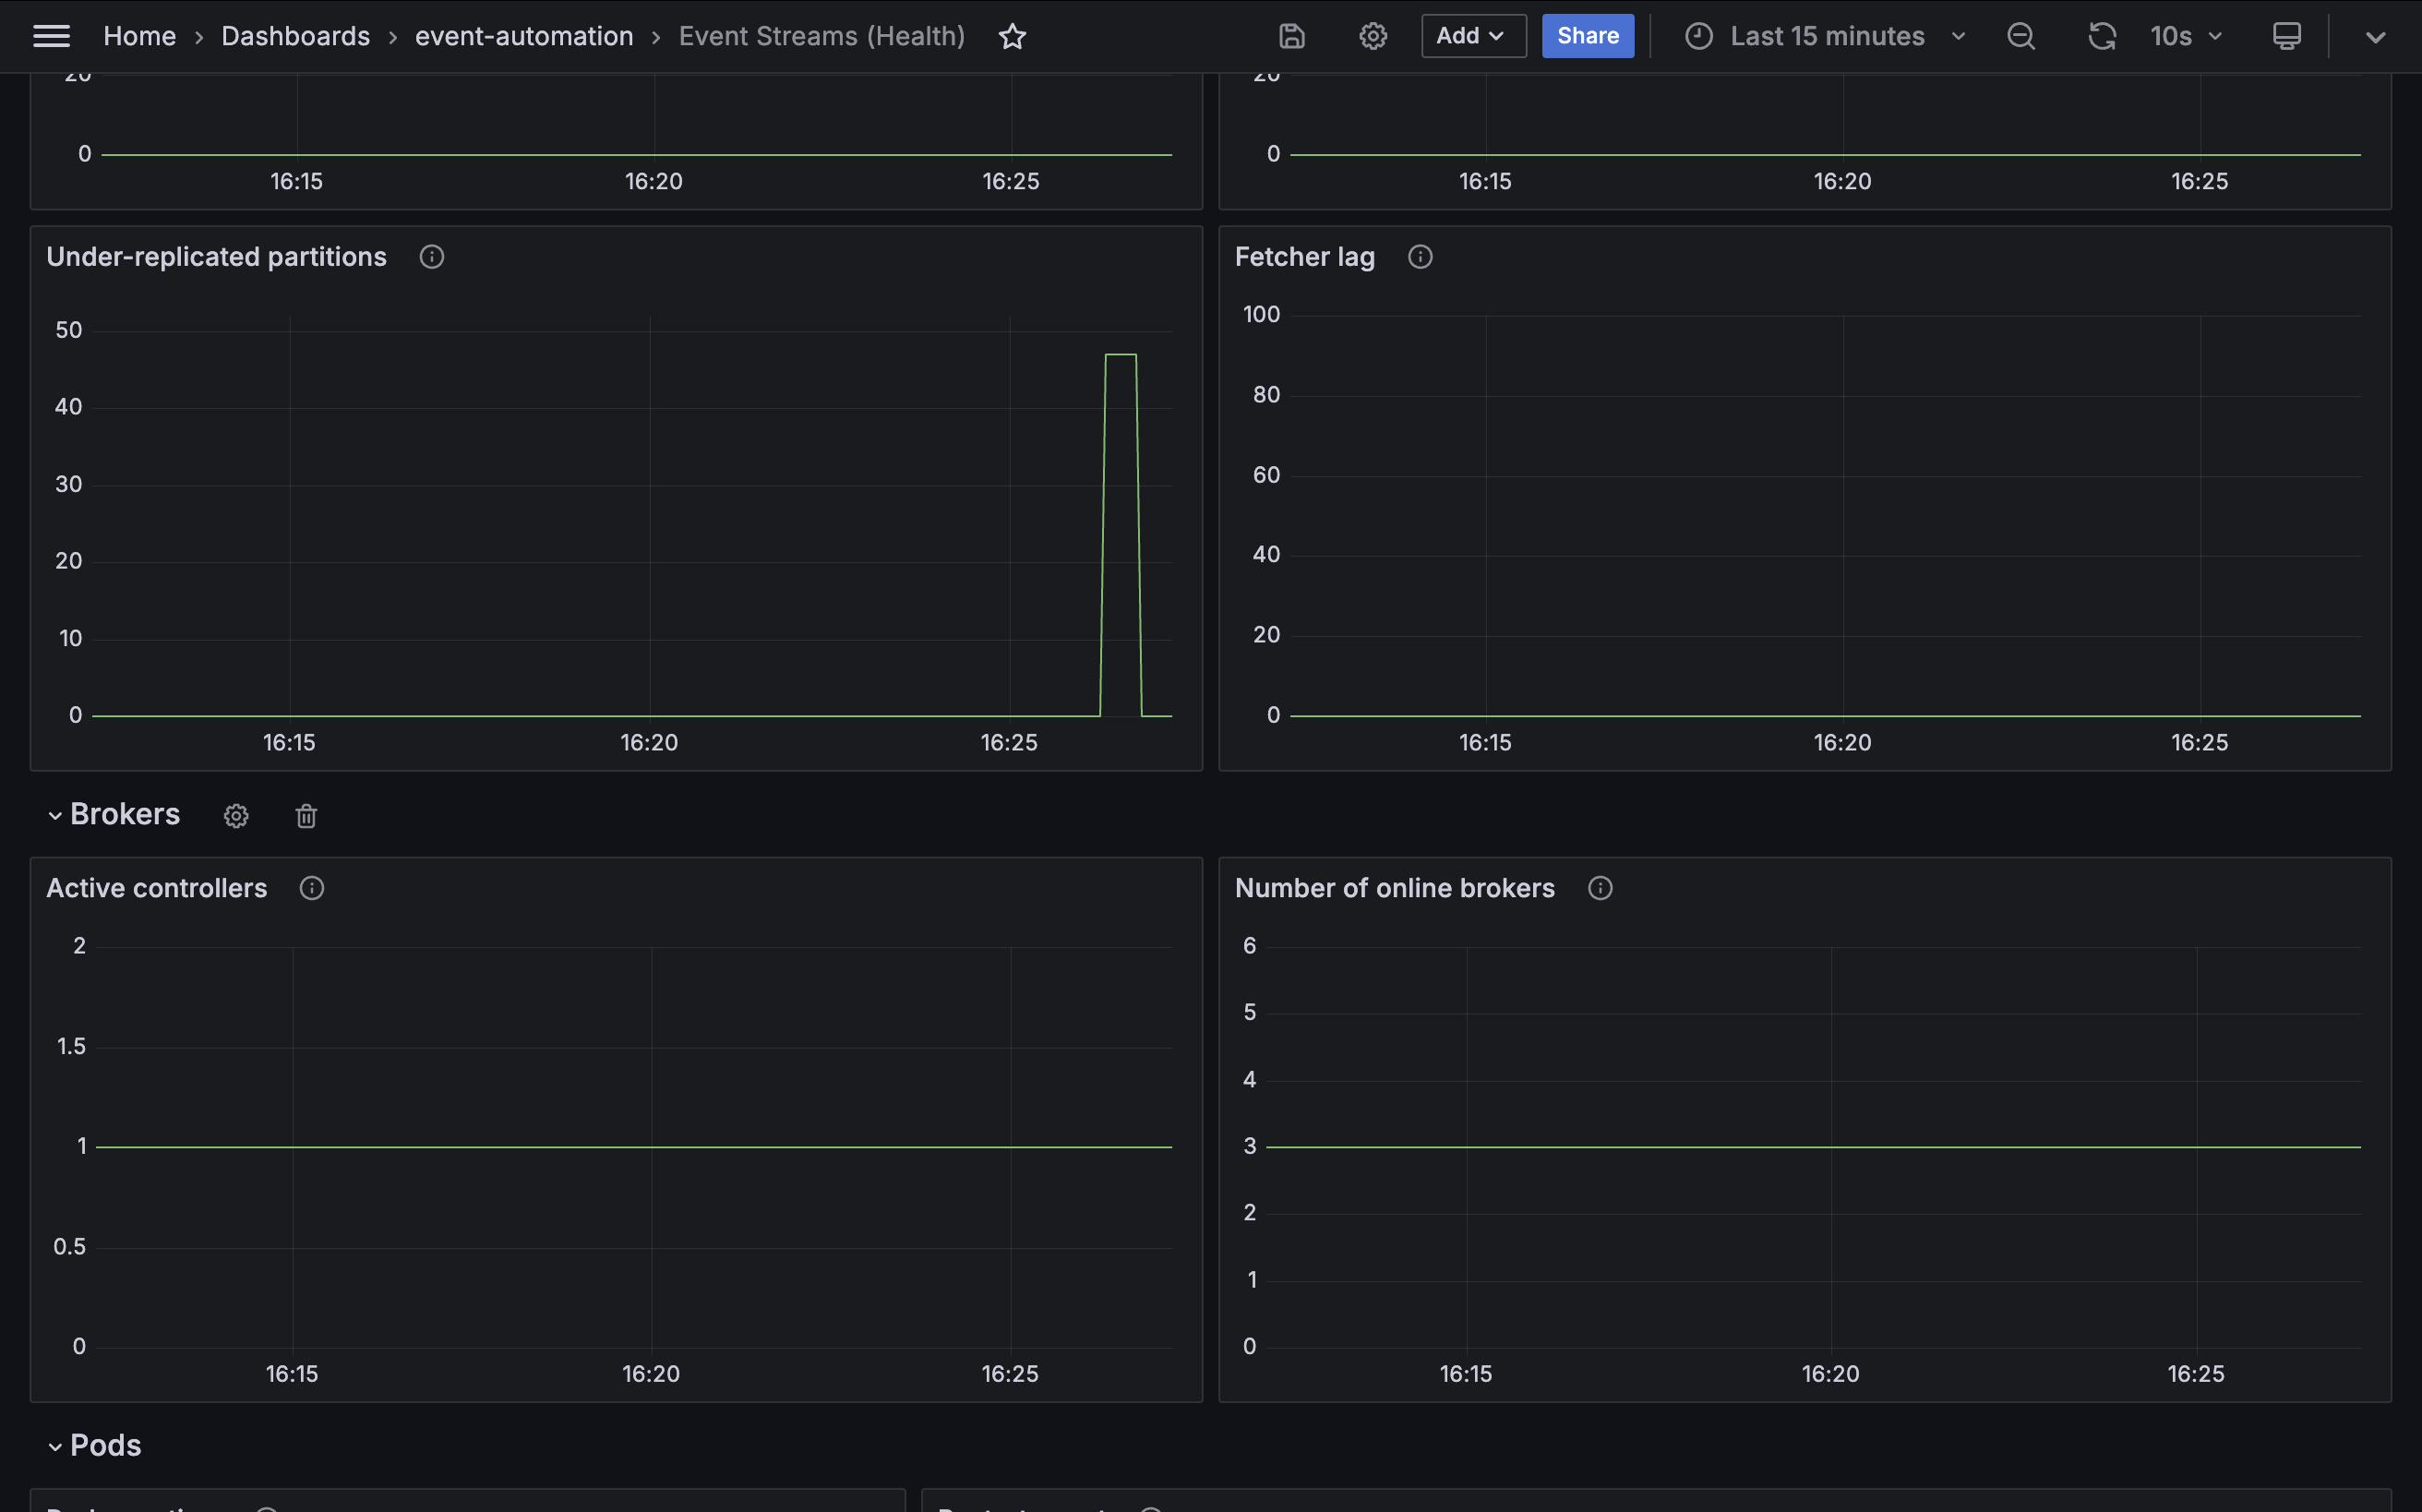
To see the dashboard in action, kill the Java process for one of the Kafka brokers and see the impact described by the metrics in the dashboard.
Run the following command to kill one of the brokers (for example, broker 0):
oc exec -it \
  -n event-automation \
  my-kafka-cluster-kafka-0 -- \
  pkill --signal 9 --parent 1 java
You might see a brief increase in under-replicated partitions, as the replicas hosted on broker 0 fall behind the leader partitions on broker 1 and broker 2. This should quickly return to zero after the replacement broker 0 starts.
If broker 0 was the controller of your Event Streams cluster, you will see a brief change to the number of active controllers as the control transfers to one of the other brokers.
The restart of broker 0 will be shown in Kafka broker 0 gauge.
It is likely that you will see a few network errors as broker 1 and broker 2 report their failures to submit requests to broker 0 as it was killed. This should quickly stop as they successfully retry their requests to the replacement broker 0.
Monitoring cluster performance
A common use case for Event Streams metrics is to understand the current level of traffic that the cluster is supporting, and to identify if the scaling of the Event Streams cluster and underlying infrastructure is insufficient to support the workload.
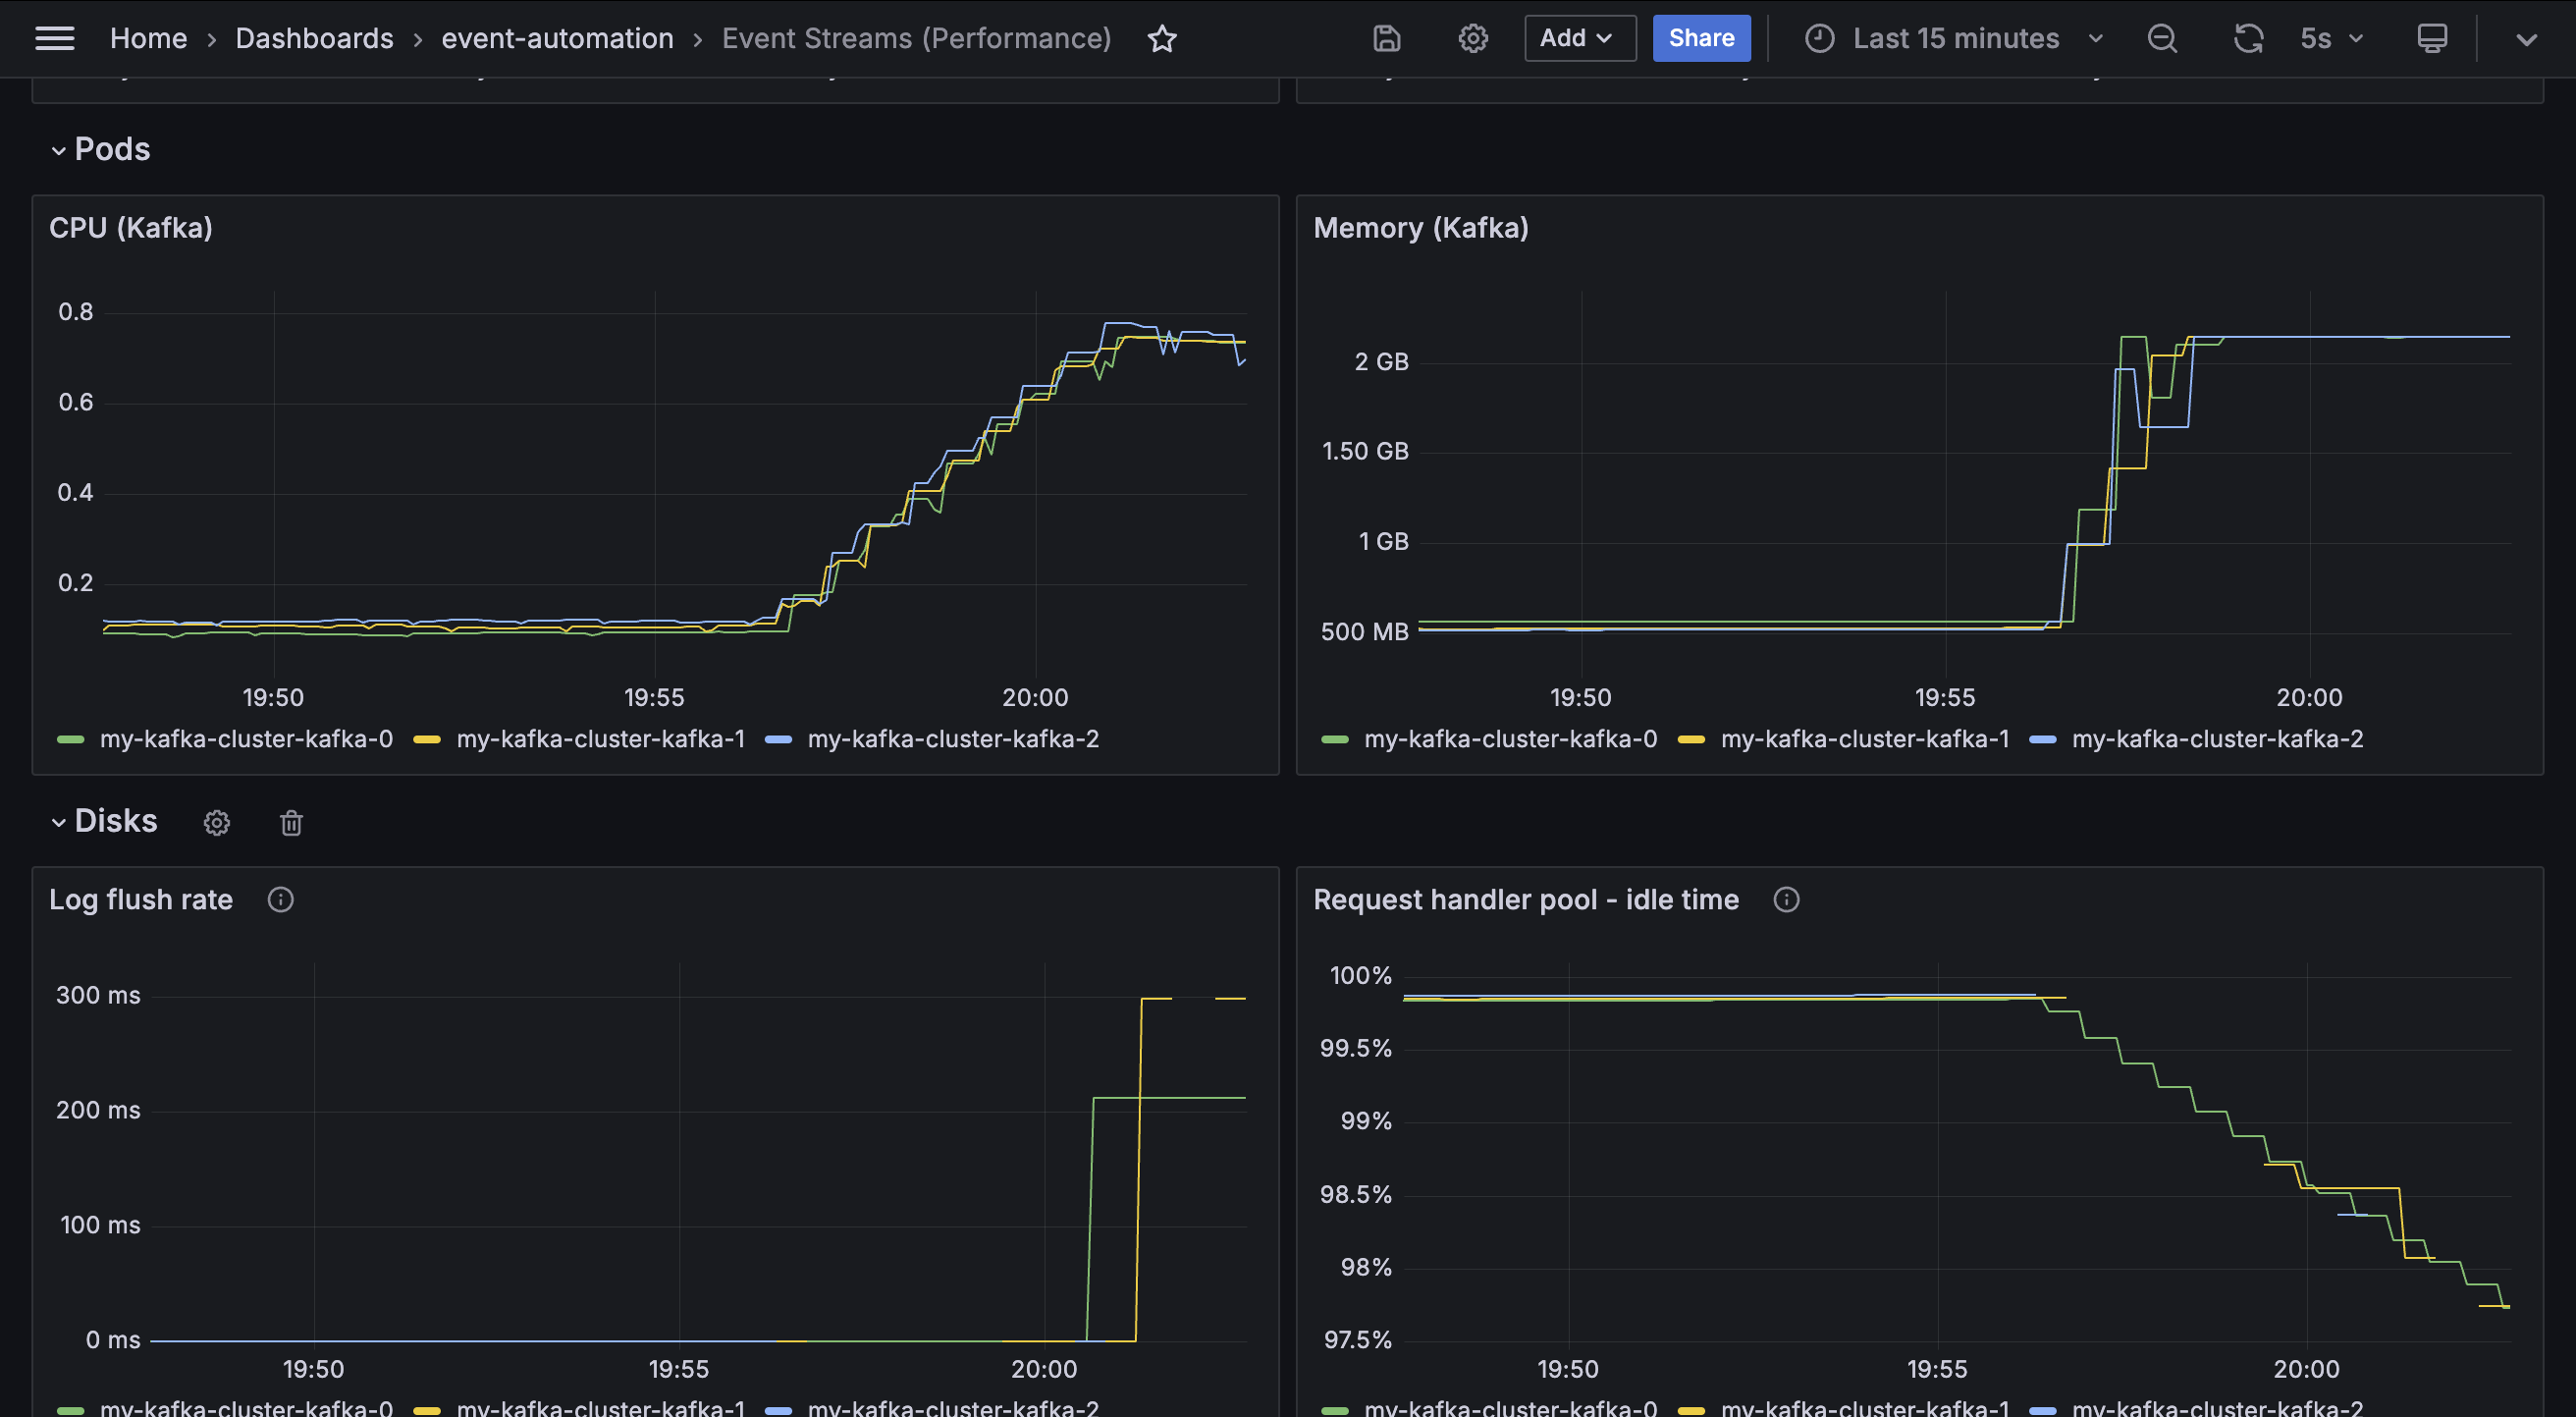
The demo playbook creates a sample Grafana dashboard called Event Streams (Performance) to show the sorts of metrics that can be used for this.
View the metrics displayed in this dashboard.
Messages
Some metrics describe the message throughput that the Event Streams cluster is handling. The first section of the demo dashboard gives examples of the kinds of values that a cluster administrator can use to get insight into this.
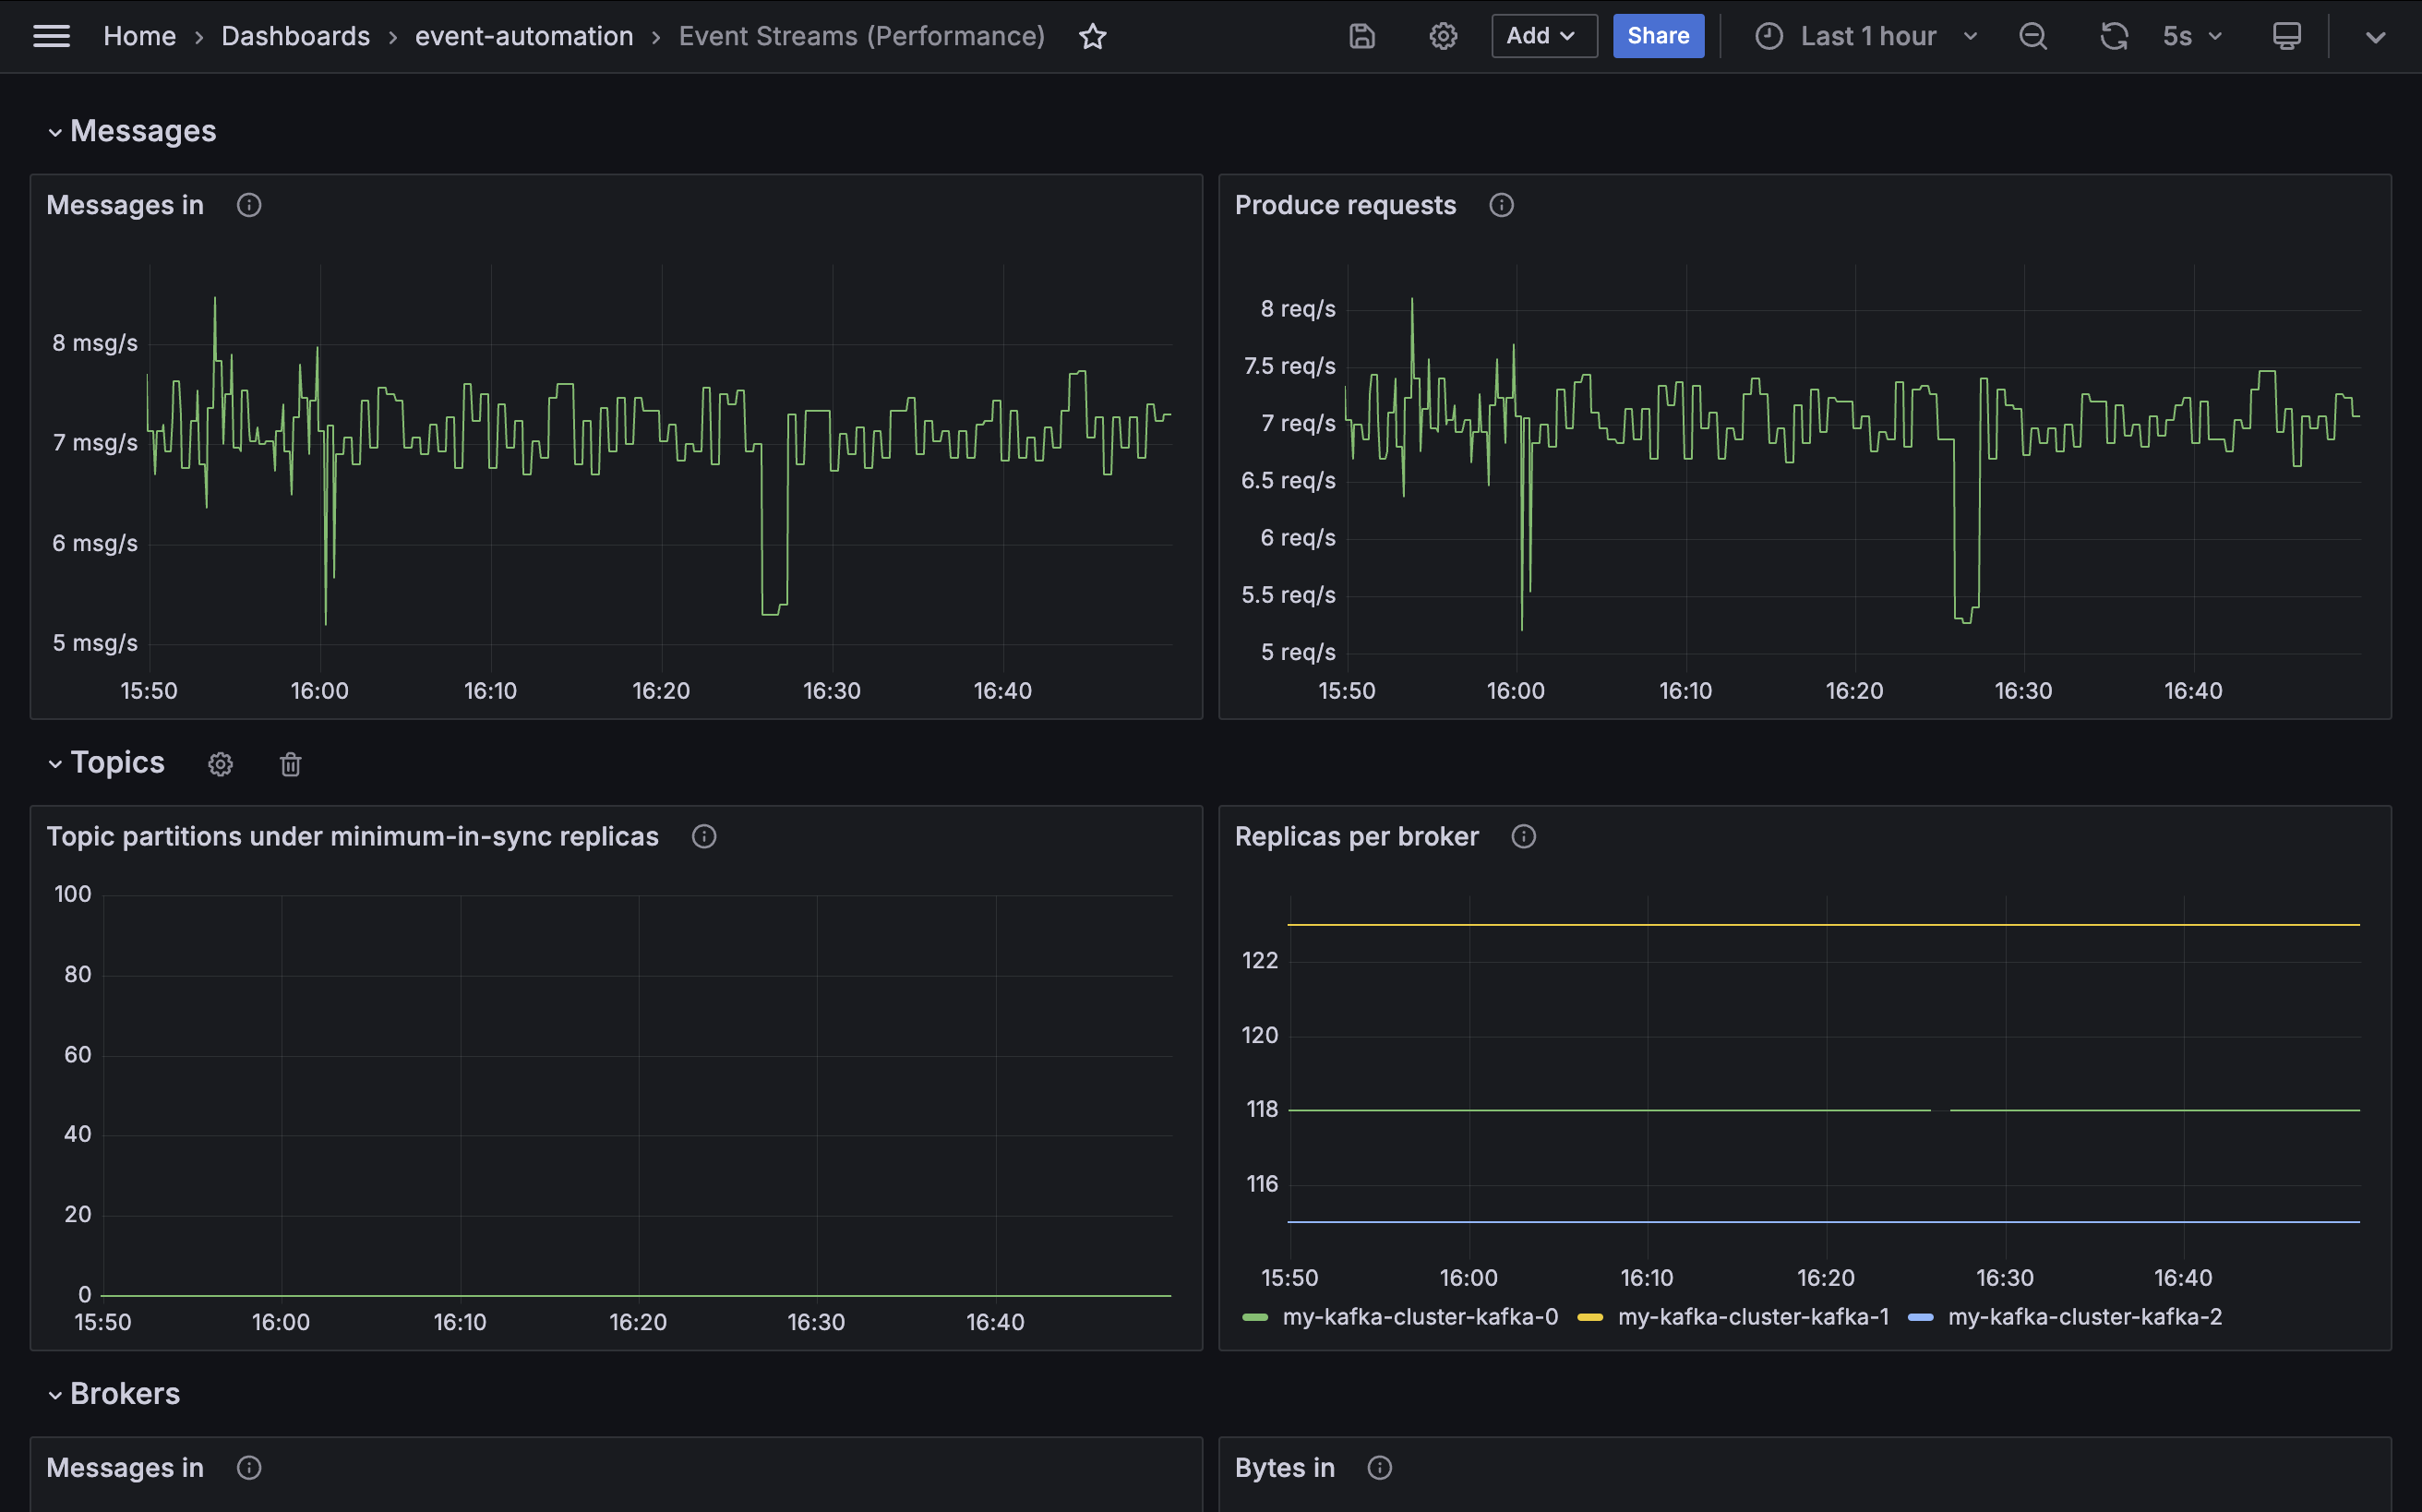
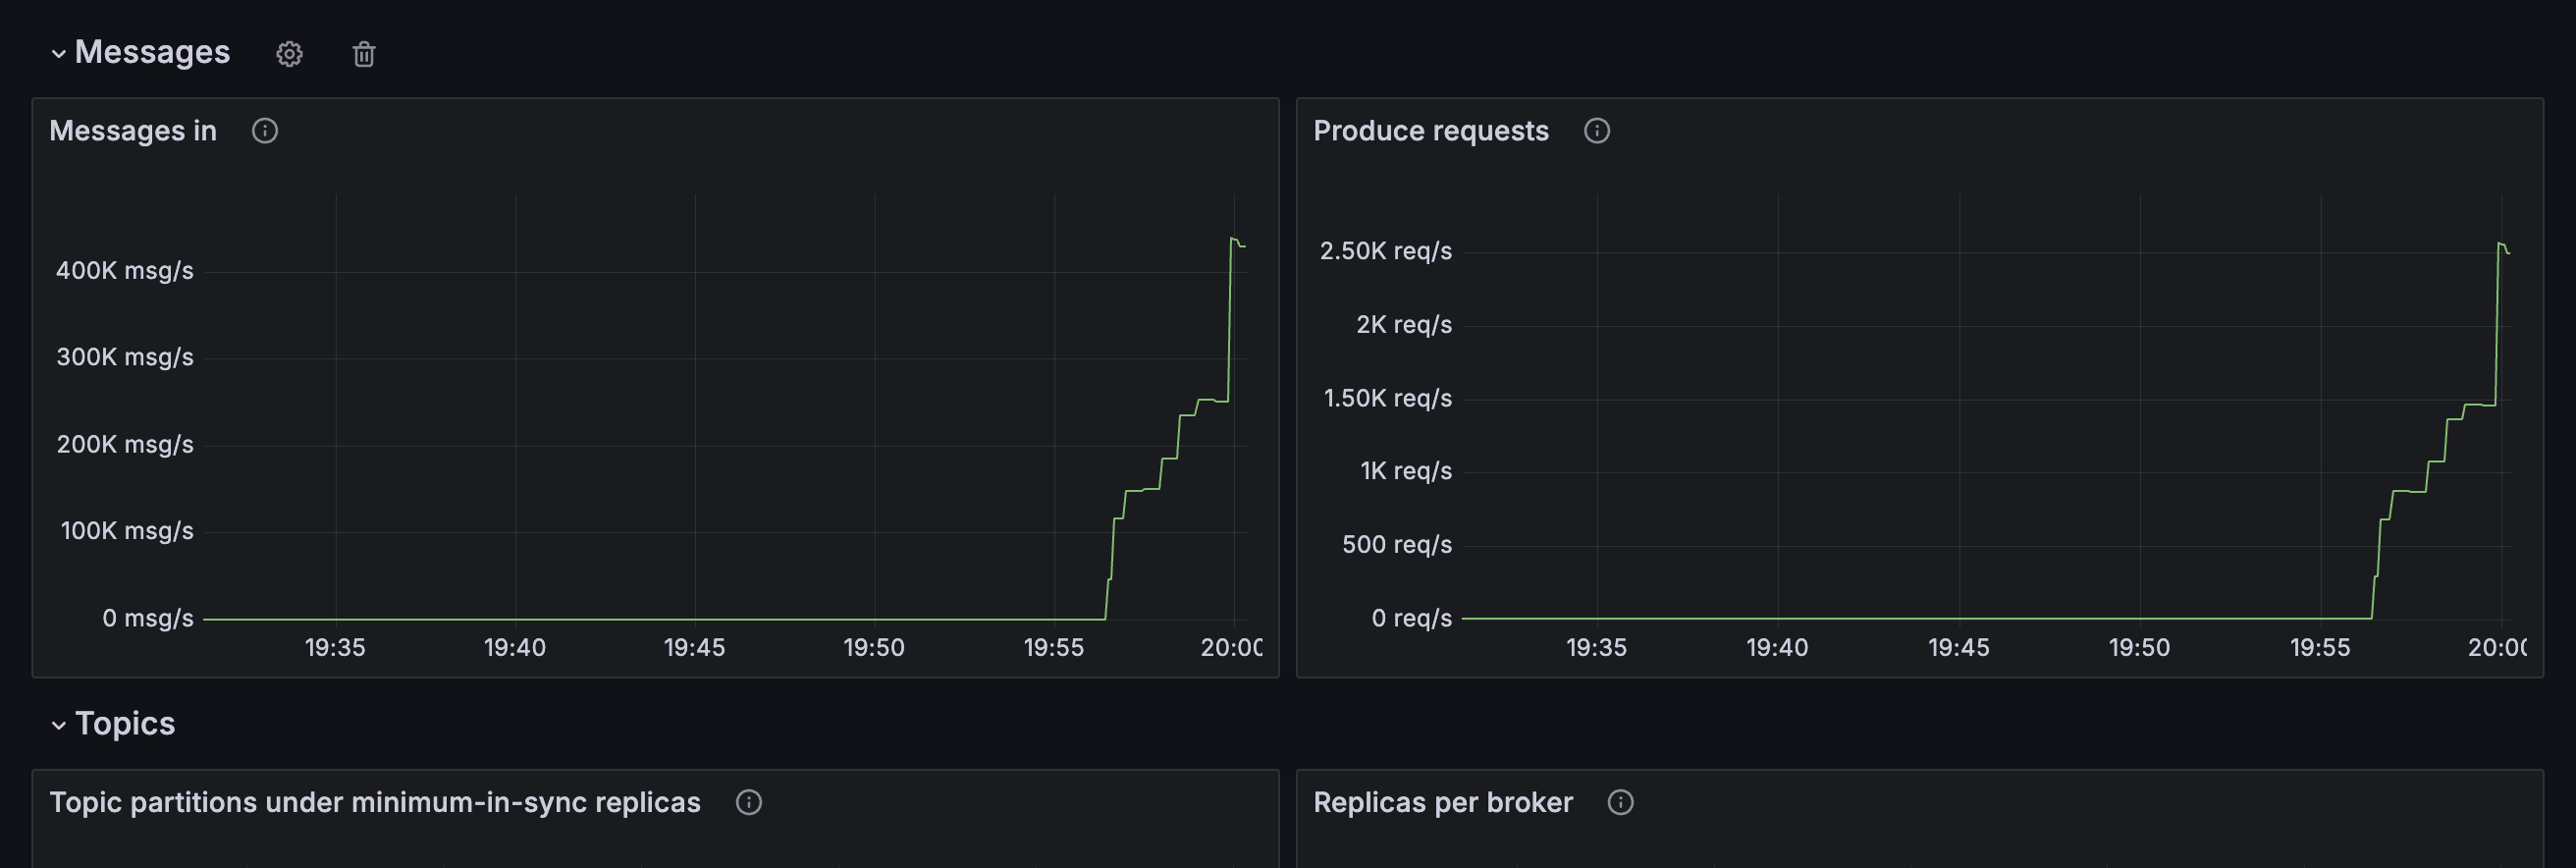
Messages in
Metric: kafka.server:type=BrokerTopicMetrics,name=MessagesInPerSec
This metric tracks the number of messages per second that the cluster is receiving. This is a good summary of the level of traffic that the cluster is handling.
The data generator in the tutorial environment generates a very low level of traffic for the Event Streams cluster, which will be visible in the graph.
Notice: If you killed one of the Kafka brokers in the previous step, you can see this reflected in the graph as a brief dip in the rate of messages.
Produce requests
Metric: kafka.server:type=BrokerTopicMetrics,name=TotalProduceRequestsPerSec
This metric measures the number of produce requests the cluster receives per second. Efficient applications will use batching to produce multiple messages in a single request, so this might be lower than the number of messages per second.
This is a good summary of the level of traffic that the cluster is handling.
The data generator in the tutorial environment generates a very low level of traffic for the Event Streams cluster, which will be visible in the graph.
Notice: If you killed one of the Kafka brokers in the previous step, you can see this reflected in the graph as a brief dip in the rate of produce requests.
Topics
Some metrics indicate the performance of topic replication performed by the Kafka brokers. The second section of the demo dashboard gives examples of the kinds of values that a cluster administrator can use to get insight into this.
Under minimum-in-sync replicas
kafka.server:type=ReplicaManager,name=UnderMinIsrPartitionCount
This metric tracks the number of topic partitions that have a number of in-sync replicas which is under their minimum in-sync replica configuration.
Producer applications cannot produce to these partitions, and will be blocked until the issue is resolved. As a result, the number of partitions in this state will be zero for a healthy cluster.
Replicas per broker
Metric: kafka.server:type=ReplicaManager,name=PartitionCount
In a healthy cluster, each of the Kafka brokers should handle a roughly equal proportion of the work for the cluster. One indicator of this is the number of topic partition replicas held on each broker.
It can never be exactly identical across all brokers, however having one broker responsible for a disproportionately high level of topic partition replicas should be avoided.
Tip: Instructions for how to re-distribute topic replicas more evenly can be found in Optimizing Kafka cluster with Cruise Control.
Brokers
Some metrics indicate the amount of work that each of the Kafka brokers is individually doing. The third section of the demo dashboard gives examples of the kinds of values that a cluster administrator can use to get insight into this.
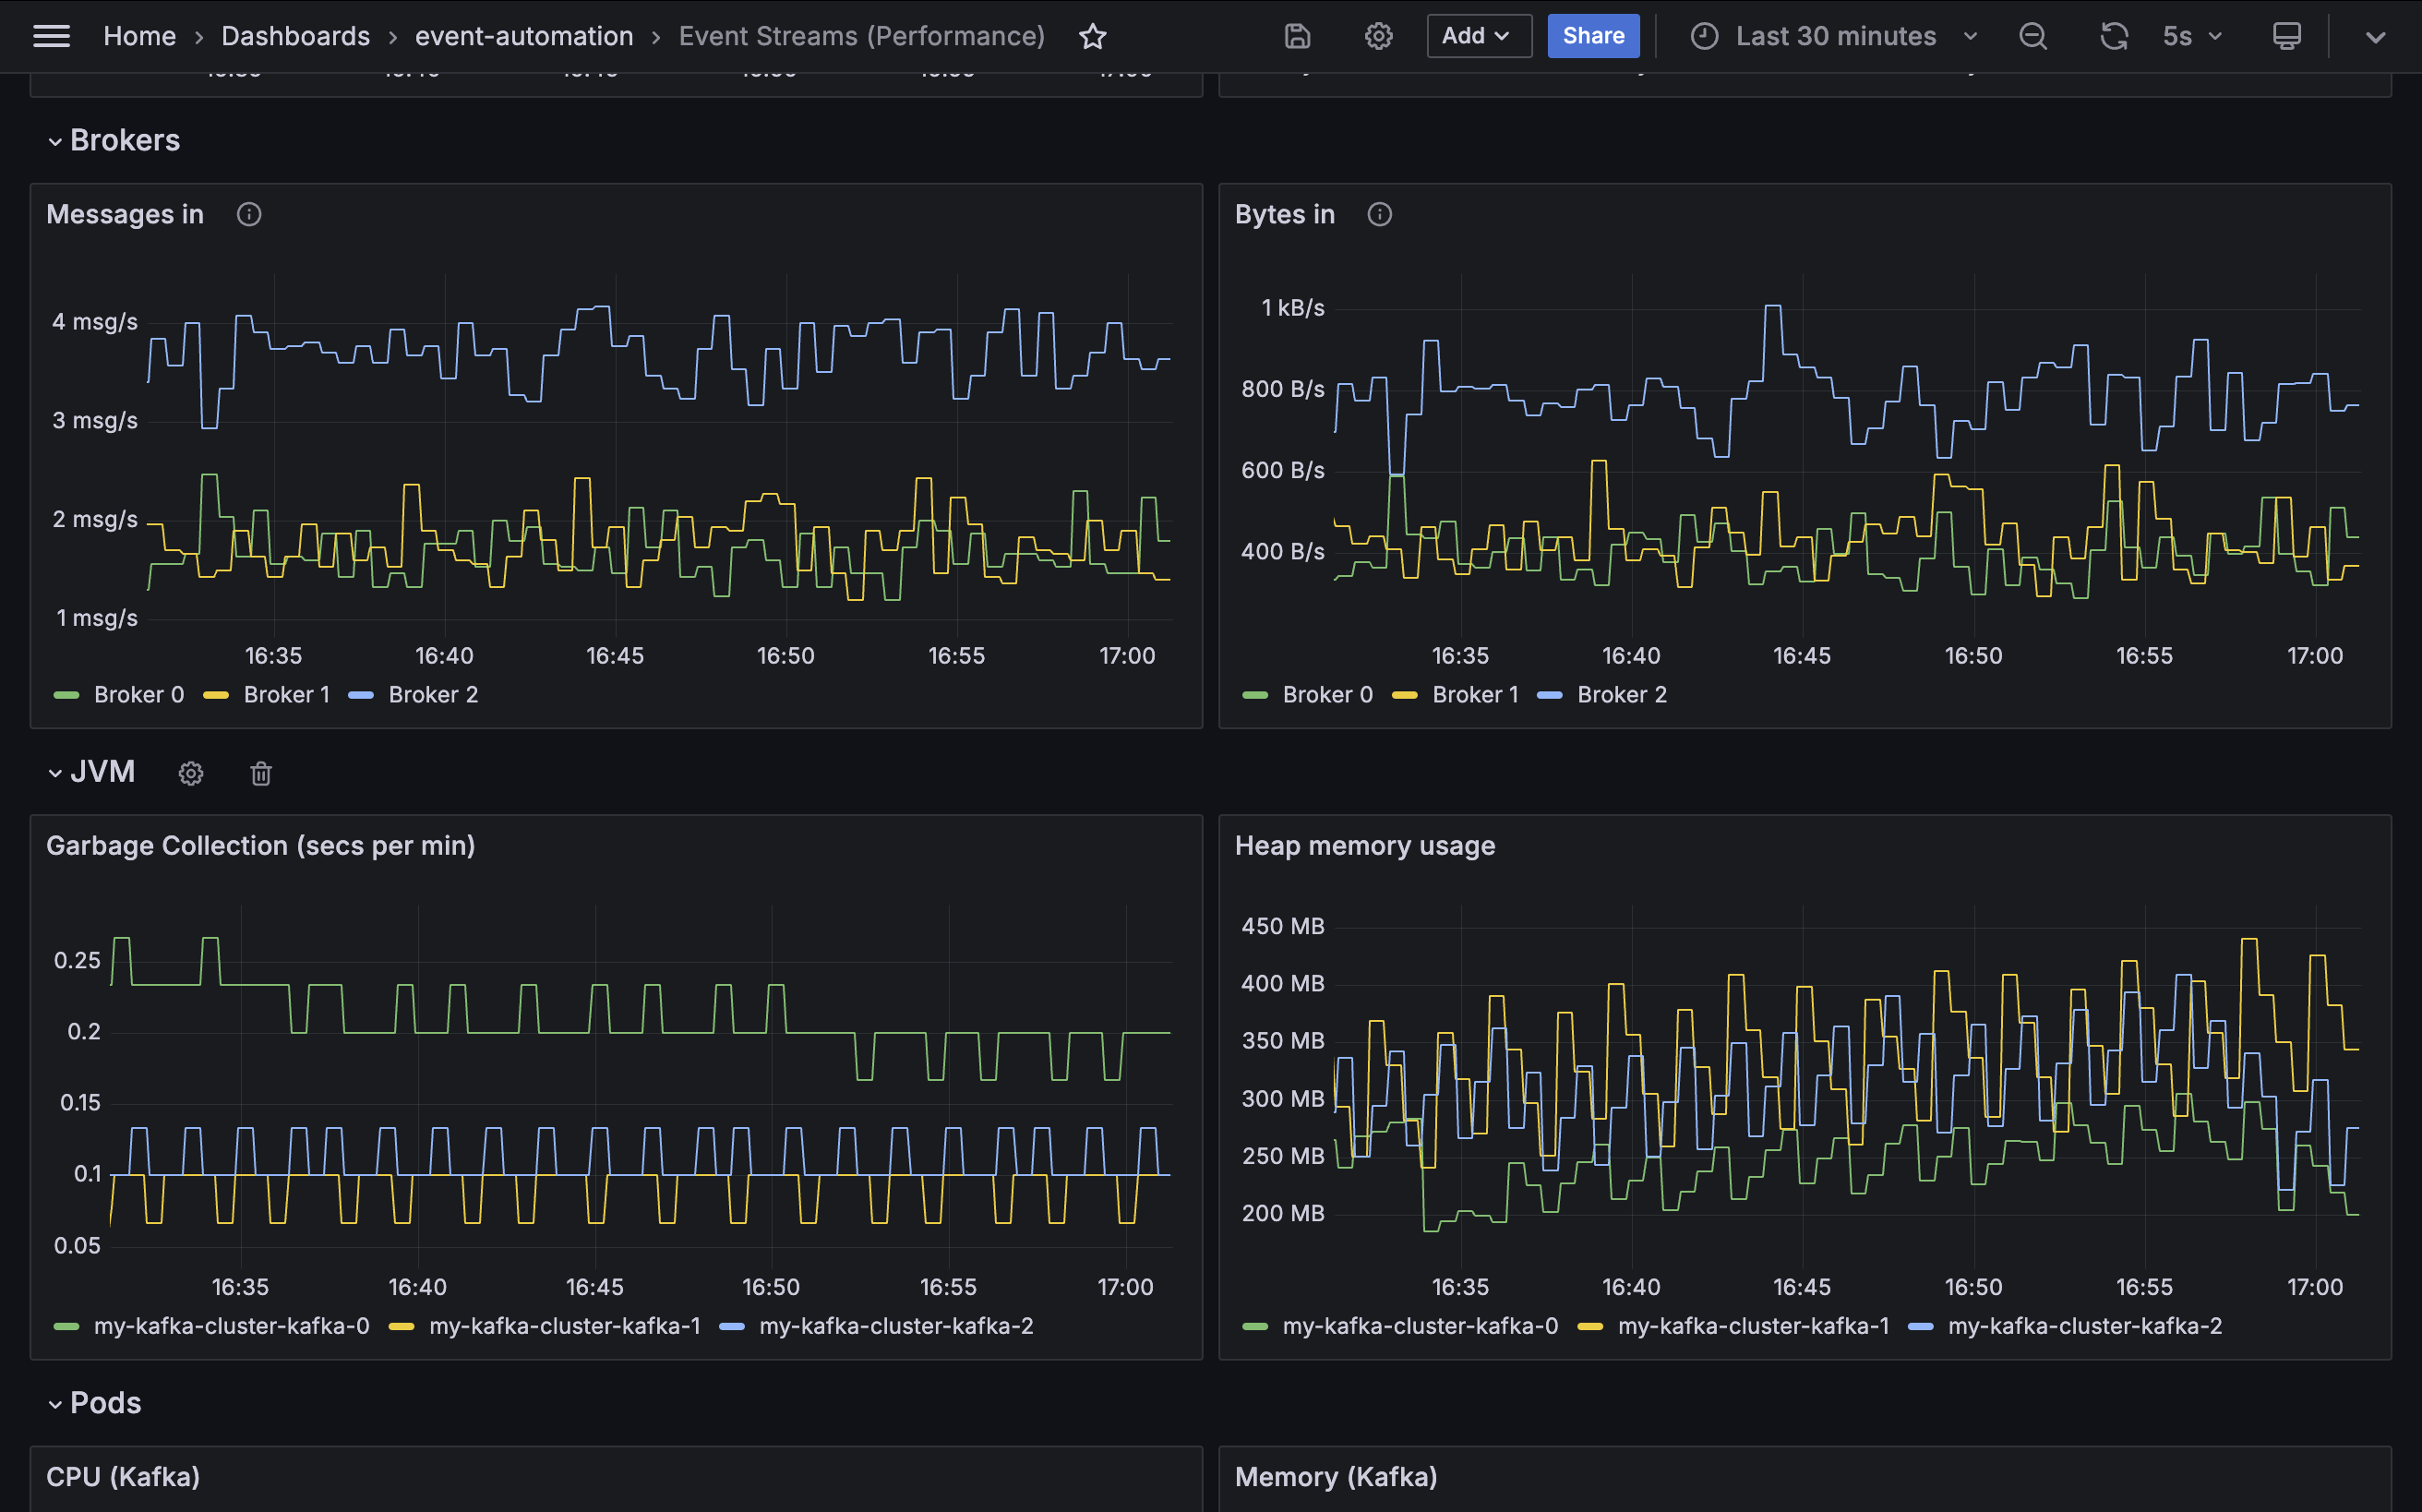
Messages in
Metric: kafka.server:type=BrokerTopicMetrics,name=MessagesInPerSec
In a healthy cluster, each of the Kafka brokers should handle a roughly equal proportion of the work for the cluster. One indicator of this is the number of messages per second received by each broker.
It can never be exactly identical across all brokers, however having one broker responsible for a disproportionately high level of messages for the cluster should be avoided.
Tip: Instructions for how to re-distribute topic replicas more evenly can be found in Optimizing Kafka cluster with Cruise Control.
Bytes in
Metric: kafka.server:type=BrokerTopicMetrics,name=BytesInPerSec
In a healthy cluster, each of the Kafka brokers should handle a roughly equal proportion of the work for the cluster. One indicator of this is the amount of data per second received by each broker.
It can never be exactly identical across all brokers, however having one broker responsible for a disproportionately high level of data for the cluster should be avoided.
Tip: Instructions for how to re-distribute topic replicas more evenly can be found in Optimizing Kafka cluster with Cruise Control.
Java (JVM)
Kafka brokers are Java applications, so the Java Virtual Machine is also a useful source of metrics about the Kafka brokers that make up the Event Streams cluster. The fourth section of the demo dashboard gives examples of the kinds of values that a cluster administrator can use.
Garbage collection time
Metric: jvm_gc_collection_seconds_count
Heap memory usage
Metric: jvm_memory_used_bytes
Kafka pods
Kubernetes is also a useful source of metrics about the Kafka brokers that make up the Event Streams cluster. The fifth section of the demo dashboard gives examples of the kinds of values that a cluster administrator can use.
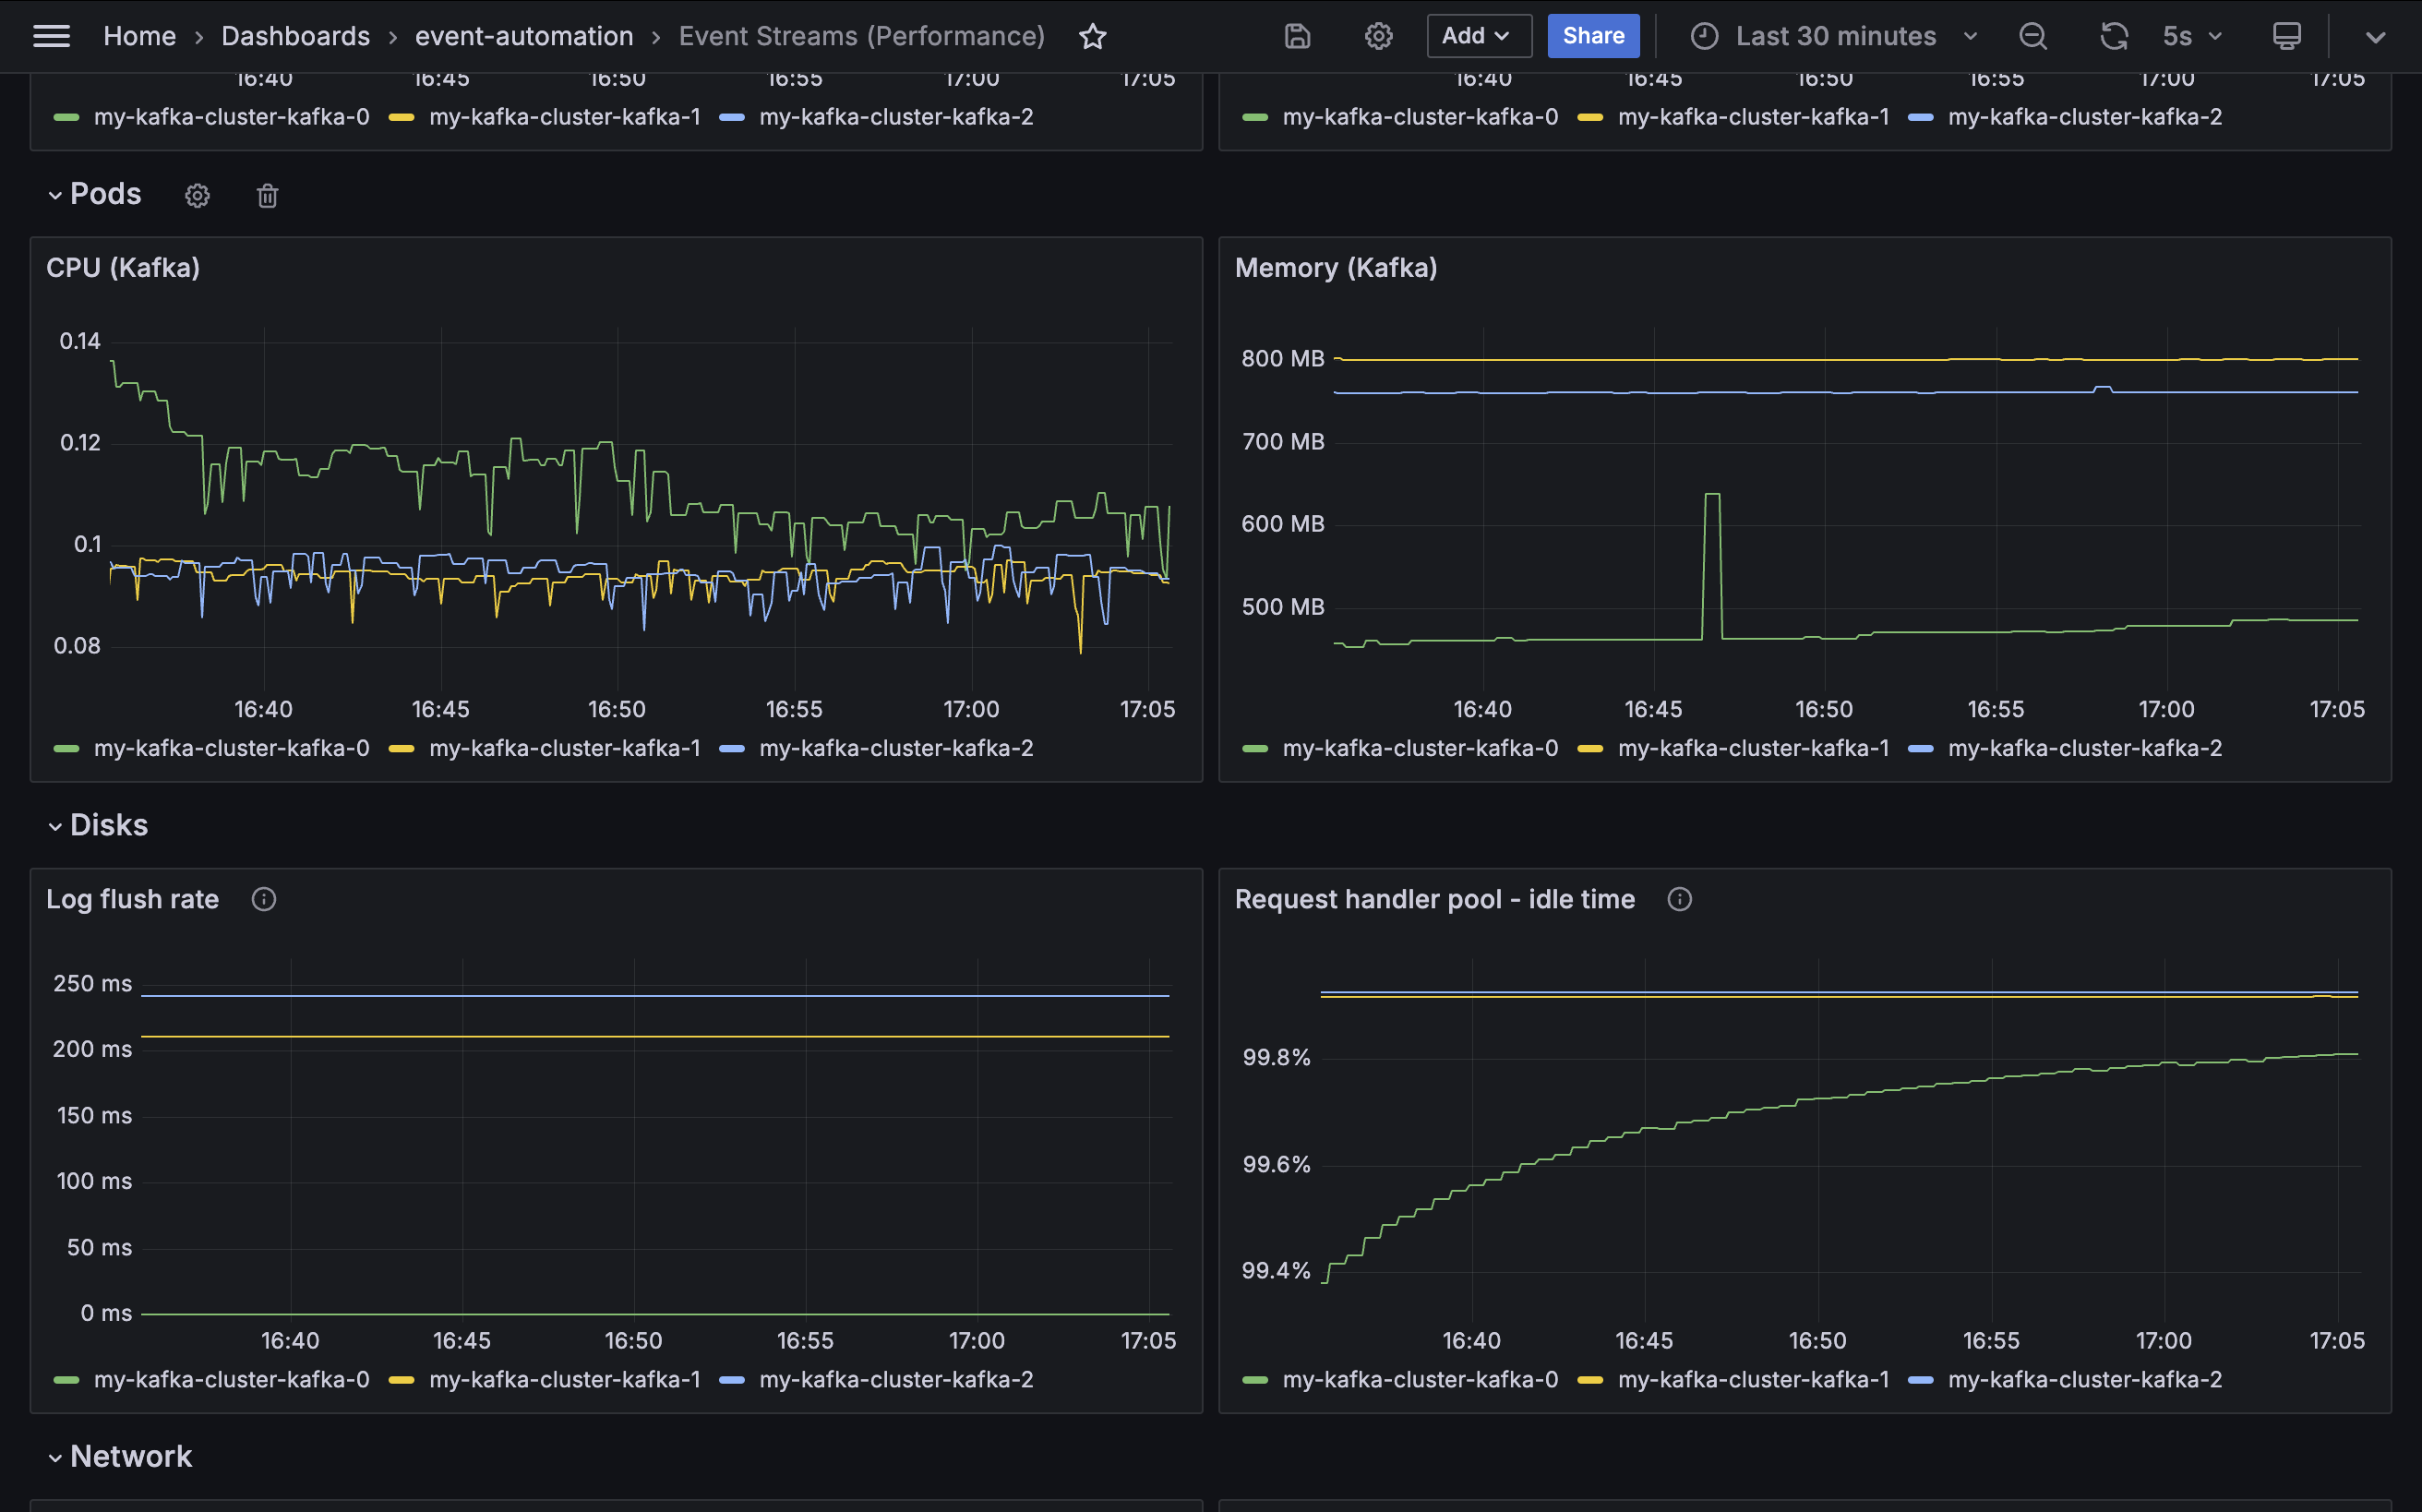
CPU
Metric: container_cpu_user_seconds_total
Memory
Metric: container_memory_usage_bytes
A cluster administrator can monitor these metrics to identify if they need to modify the resource limits specified in the EventStreams custom resource to better fit the current workload demands.
Disks
Some metrics indicate the ability of the disks used by Kafka brokers to support the current workload. The sixth section of the demo dashboard gives examples of the kinds of values that a cluster administrator can monitor.
Log flush rate
Metric: kafka.log:type=LogFlushStats,name=LogFlushRateAndTimeMs
Log flush rate is the rate at which log data is written to disk, in milliseconds.
It is a measure of the time taken to flush messages from in-memory log buffers to physical disks. Higher latency will slow down the request times for producer applications, and potentially lead to data loss in the event of a crash before a flush has completed.
The visualization in the demo dashboard shows the value for the 99th percentile - so 99% of the log latency measured is under the value displayed here.
Request handler pool
Metric: kafka.server:type=KafkaRequestHandlerPool,name=RequestHandlerAvgIdlePercent
This metric is a measure of the amount of time the request handler threads in the Kafka broker are spending idle. It is an indicator of how busy the broker is when processing requests from client applications and other brokers.
A high value indicates the request threads are mostly idle, and that the broker is under a low workload. A low value indicates the request handlers are fully utilized and potentially struggling to keep up with a high workload.
Network
Some metrics describe the network traffic that the Event Streams cluster is handling. The final section of the demo dashboard gives examples of the kinds of values that a cluster administrator can use to get insight into this.
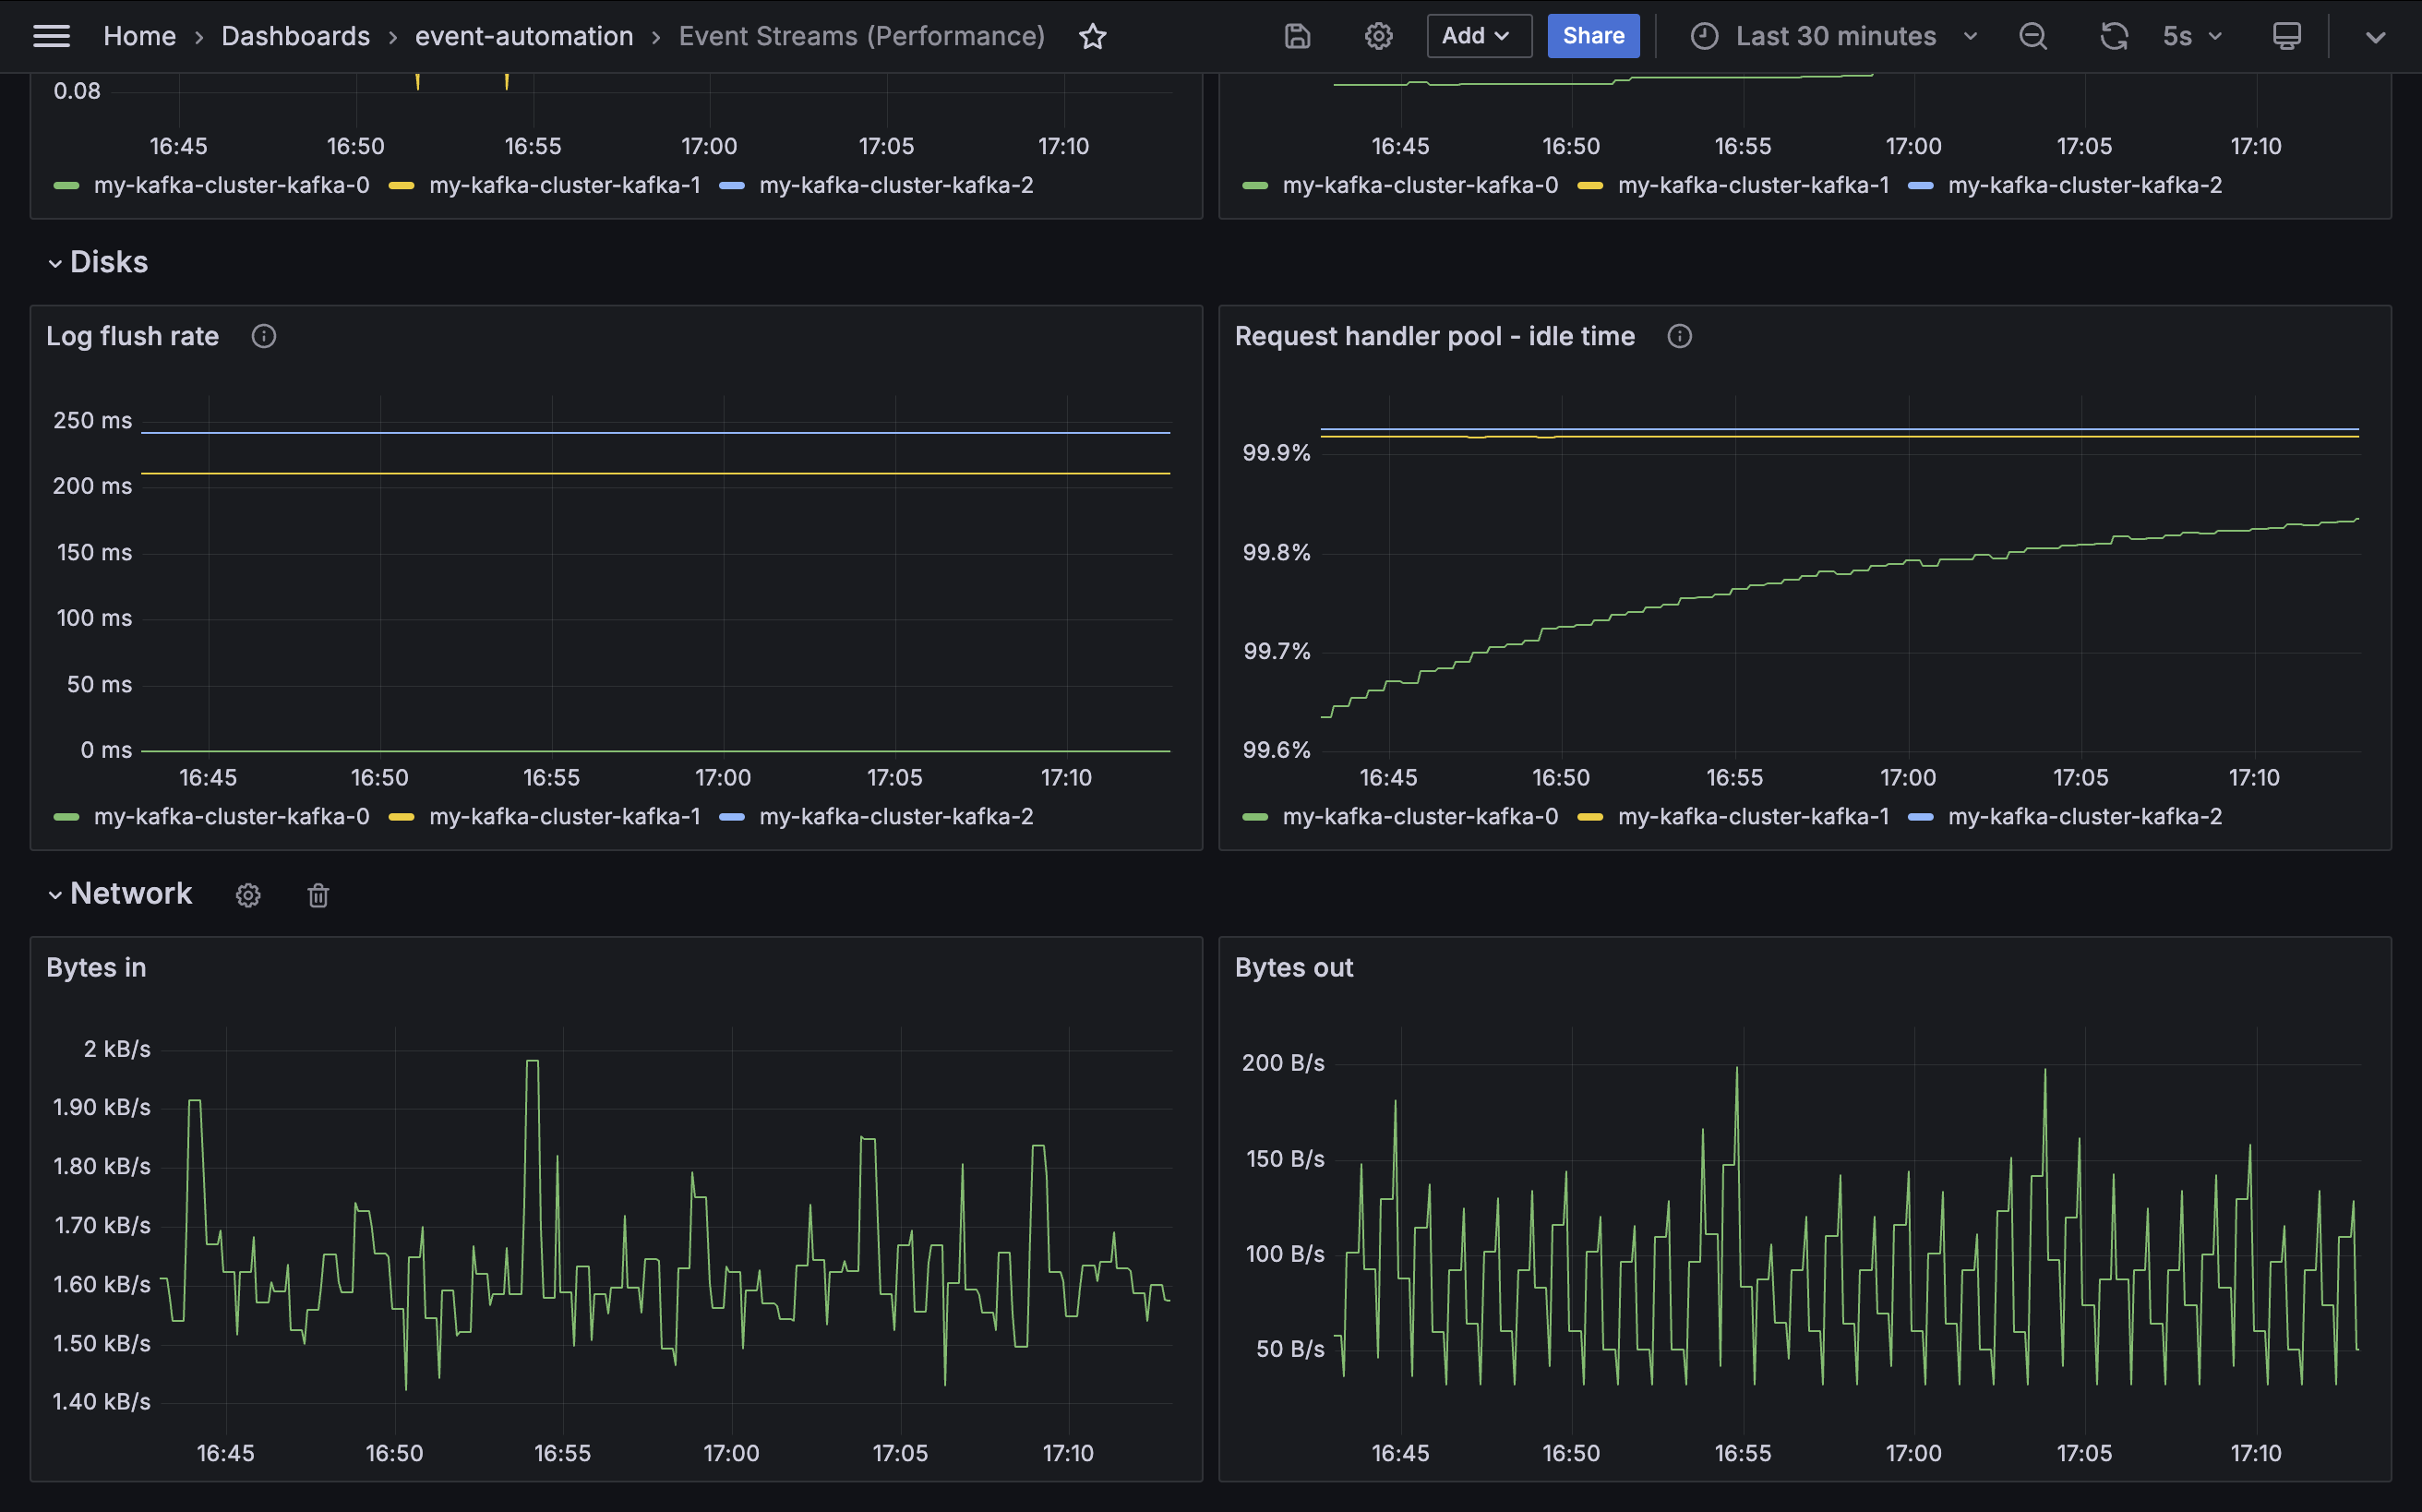
Bytes in
Metric: kafka.server:type=BrokerTopicMetrics,name=BytesInPerSec
Bytes out
Metric: kafka.server:type=BrokerTopicMetrics,name=BytesOutPerSec
Note: These metrics only describe network traffic to or from client applications. Separate metrics can be used to monitor inter-broker network traffic (for example, replication).
Using the dashboard
Note: The tutorial setup generates a very small and slow workload, so the performance dashboard does not show you what to expect for a busy cluster. To see the dashboard reflect a busier Event Streams cluster, you can run some workload applications. Follow the instructions for starting Kafka workload applications. This will create a new Kafka topic (WORKLOAD) and start a several high-throughput Kafka producers and consumers.
You can use the two sample dashboards that you previously created to monitor the impact of your applications:
-
You can see that there is an increase in messages handled by the cluster.
-
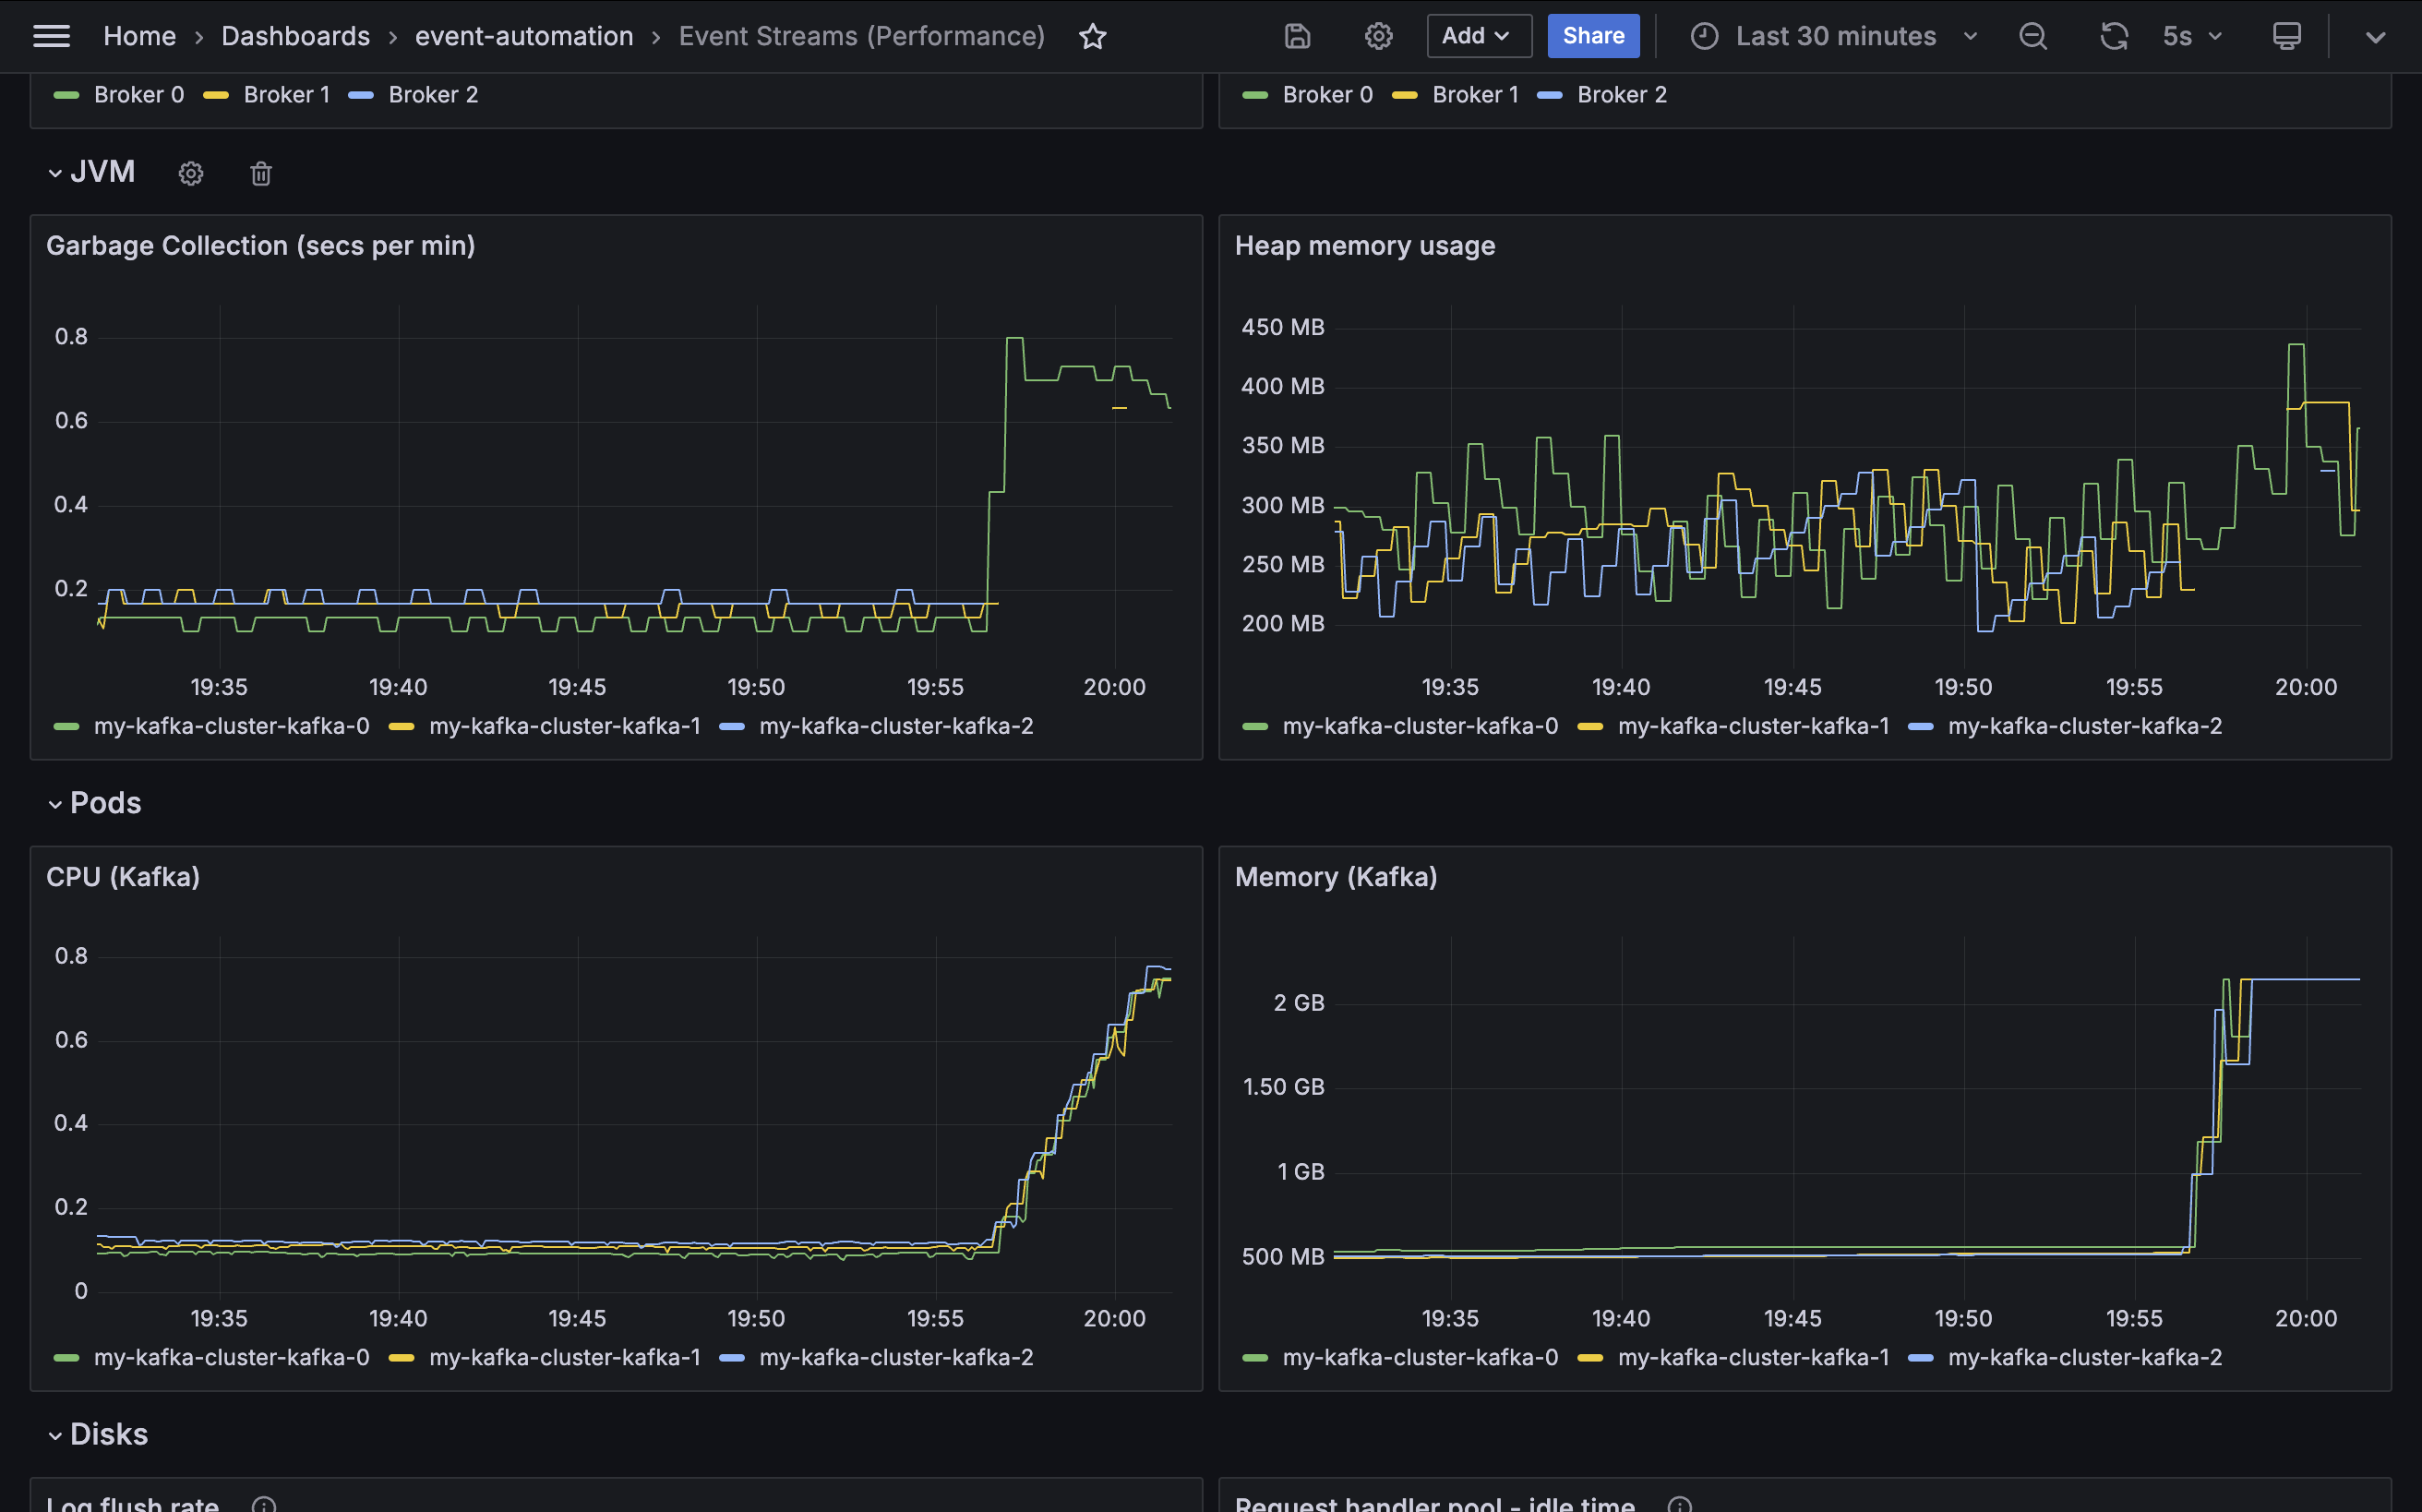
You can also see that the Kafka brokers have to work harder to handle the increased traffic, such as through an increase in CPU and memory usage, and an increase in the amount of time spent garbage collecting.
-
As there is (intentionally) no quota applied to the Kafka credentials being used by the workload applications, it will likely lead to the Kafka brokers reaching their maximum CPU and memory capacity.
-
You might see increases in other infrastructure-related values such as an increase in the time taken to flush the log to disk because of the increase in the amount of disk space caused by the workload applications.
You will be able to monitor the disk space used by the new
WORKLOADKafka topic as it rapidly reduces the disk space remaining on the Kafka brokers. -
You can increase the impact of the workload applications by restarting one of the Kafka brokers while the workload applications are running by using the following command:
oc delete pods \
  -n event-automation \
  my-kafka-cluster-kafka-0
This command forces one broker to fall further behind, as it attempts to catch up with what it missed, which will result in several network request errors being reported, as the Kafka cluster is working harder than the first time you restarted a broker.
-
You might also see other results, such as replication for some topic partitions failing to keep up, and an increase in the replica fetcher lag.
This type of insight and analysis is why it is essential to monitor a production Event Streams cluster.
Important: After you finished using the dashboards while Event Streams is supporting a high-throughput workload, it is recommended that you follow the instructions to stop and remove the workload application resources.
Selecting metrics
The descriptions earlier of each of the metrics used in this tutorial includes the metric “Mbean name” (for example, kafka.server:type=BrokerTopicMetrics,name=BytesInPerSec) as documented in the Kafka documentation about monitoring. You can refer to the Kafka documentation for more information about these metrics.
The demo dashboards used in this tutorial are not intended to be an exhaustive representation of the metrics available for Event Streams administrators. The intent of this tutorial is to encourage you to consider what your objective is for monitoring your Event Streams cluster. Use the examples described here as a starting point for exploring the monitoring tables and selecting the appropriate metrics for your use case.
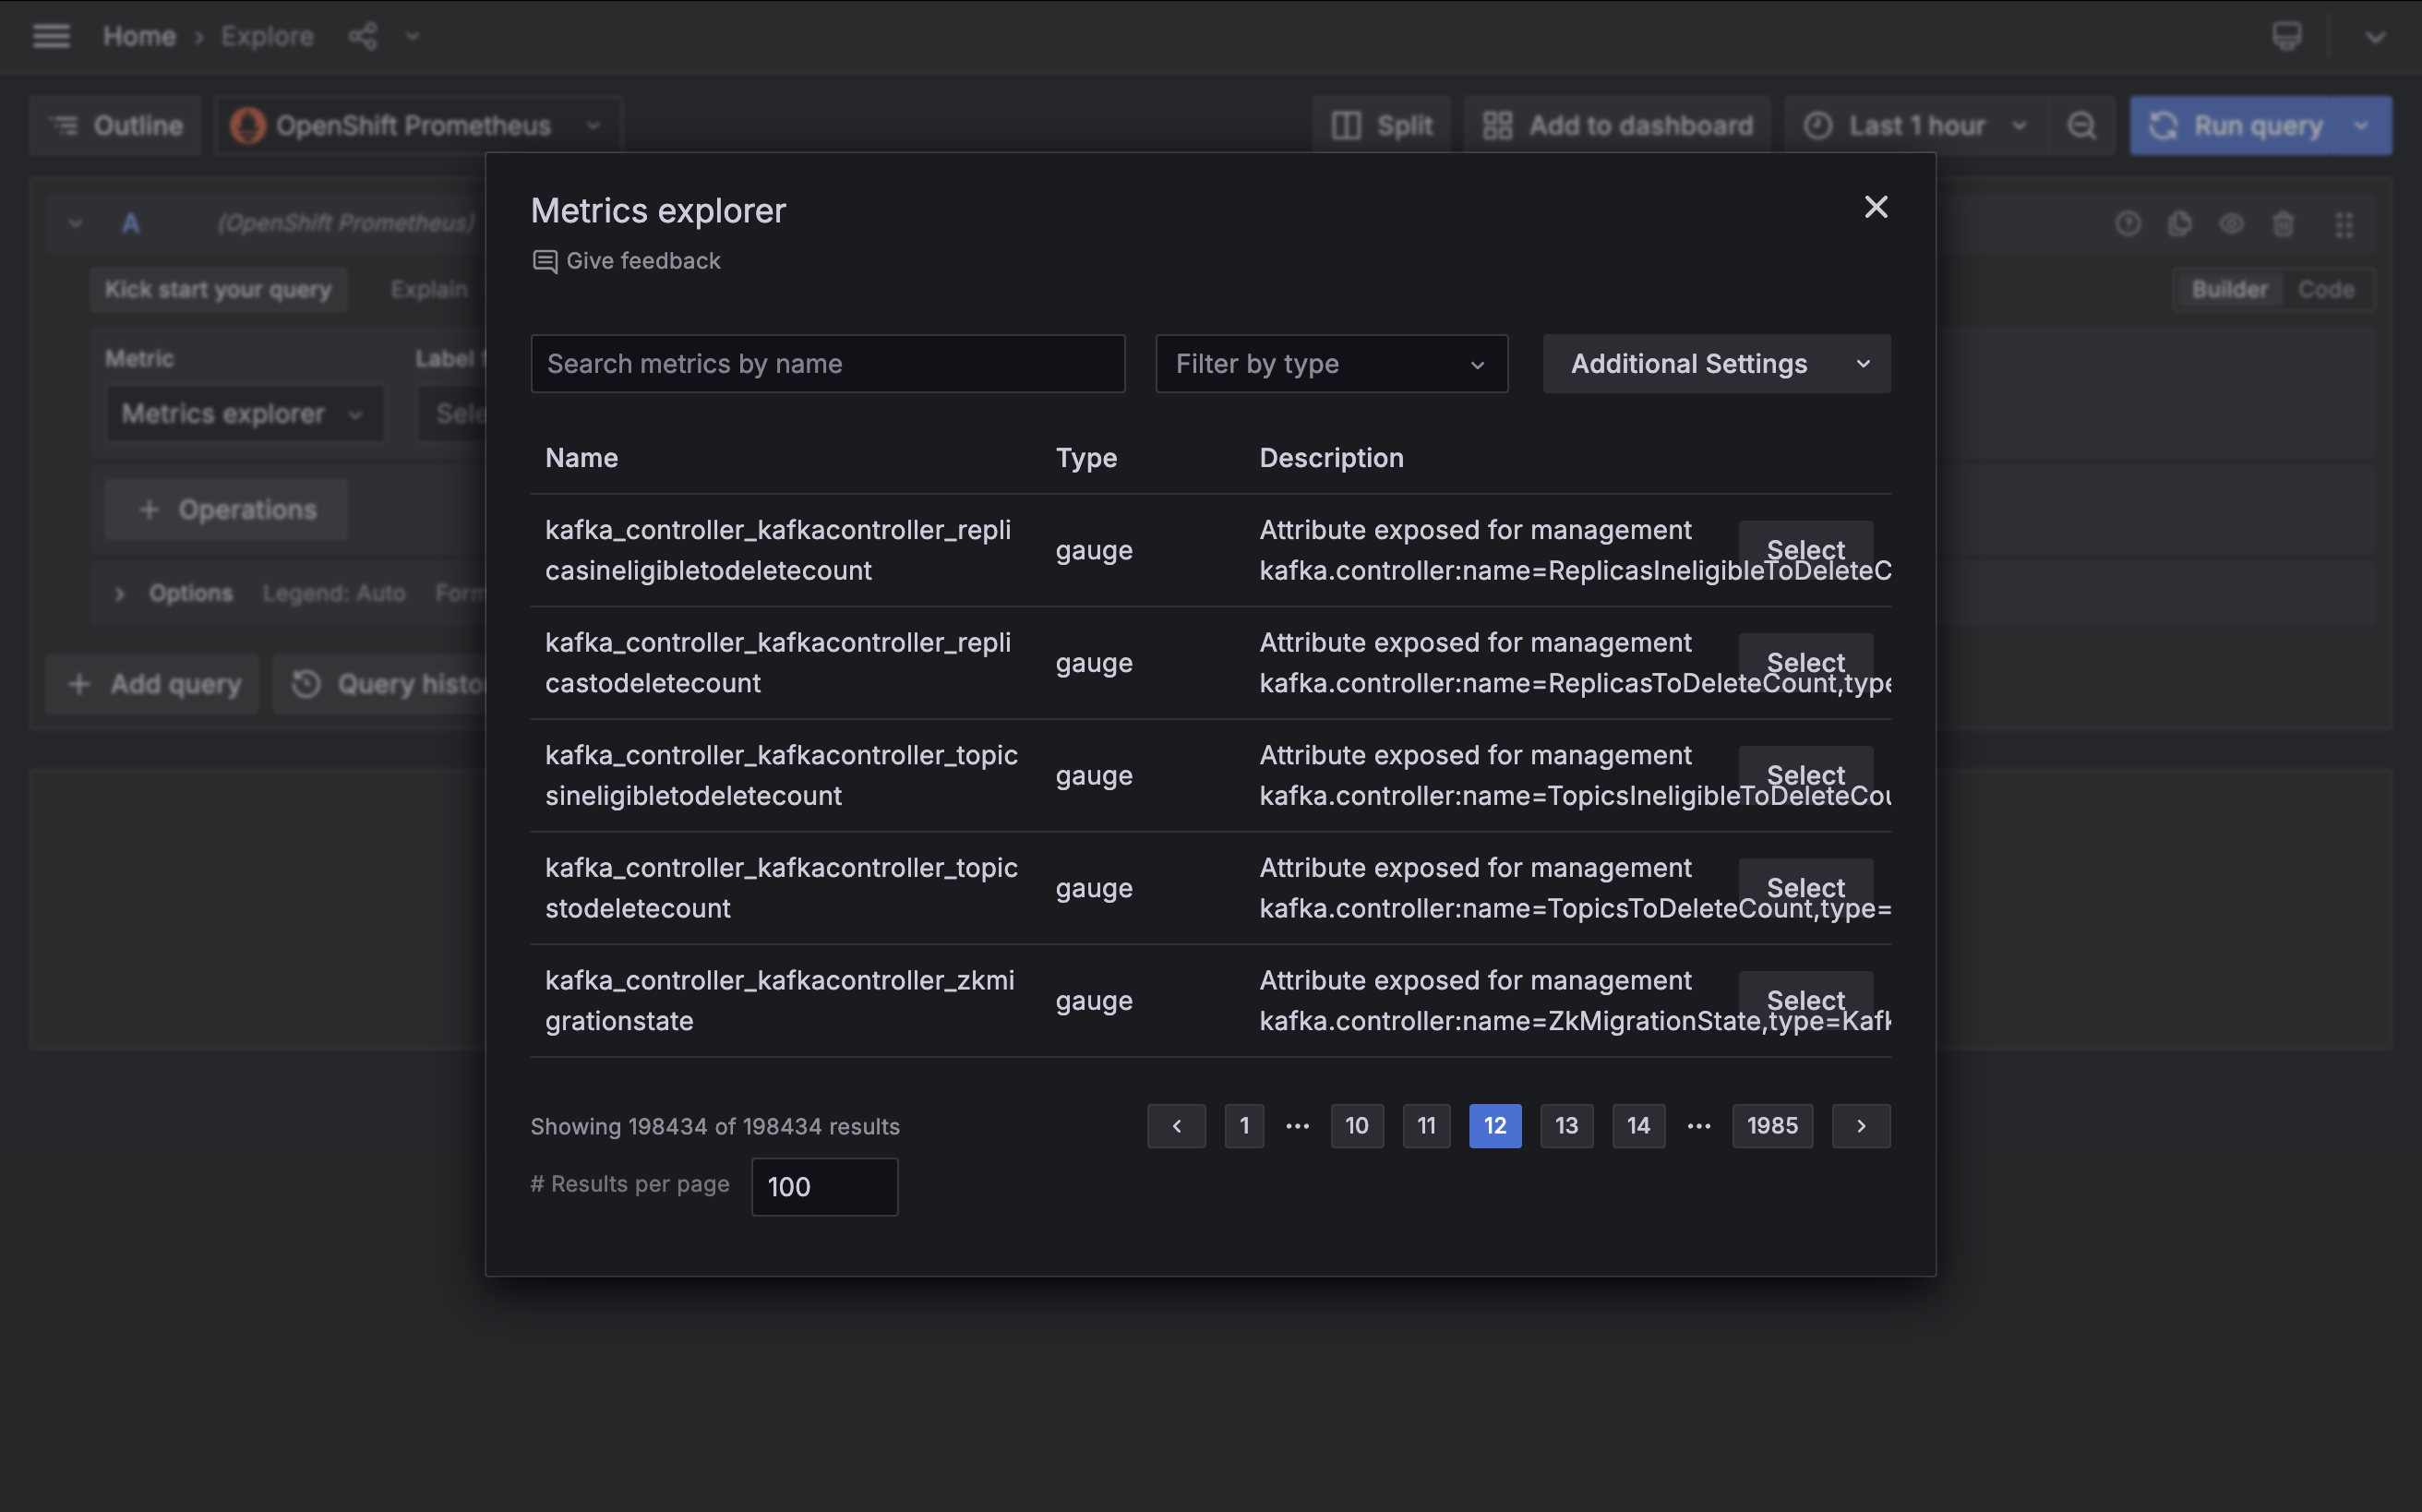
You can use the Grafana installation provided by the demo playbook to explore and experiment with the metrics that are available in the Grafana dashboard. The Explore section for the data source is a useful way to try this.
After you have identified the metrics you want to collect, you can follow the instructions for configuring monitoring to collect these metrics in your (non-demo) Event Streams clusters.
Next steps
If you have not yet explored the options for monitoring Event Endpoint Management, you can follow the Monitoring Event Endpoint Management tutorial, which uses the same Grafana instance as this tutorial. This is an example of how you can collect metrics for your whole IBM Event Automation deployment into a single place.
