Interval join
When looking for patterns in an event stream, sometimes we need to examine events from more than one topic. We talk of this as a “join” between the streams - the same term we would use when working with databases and correlating data between two tables.
Filter
When processing events we can use filter operations to select a subset that we want to use. Filtering works on individual events in the stream.
Scenario: Identify suspicious orders
Many interesting situations need us to combine multiple streams of events that correlate events across these inputs to derive a new, interesting situation.
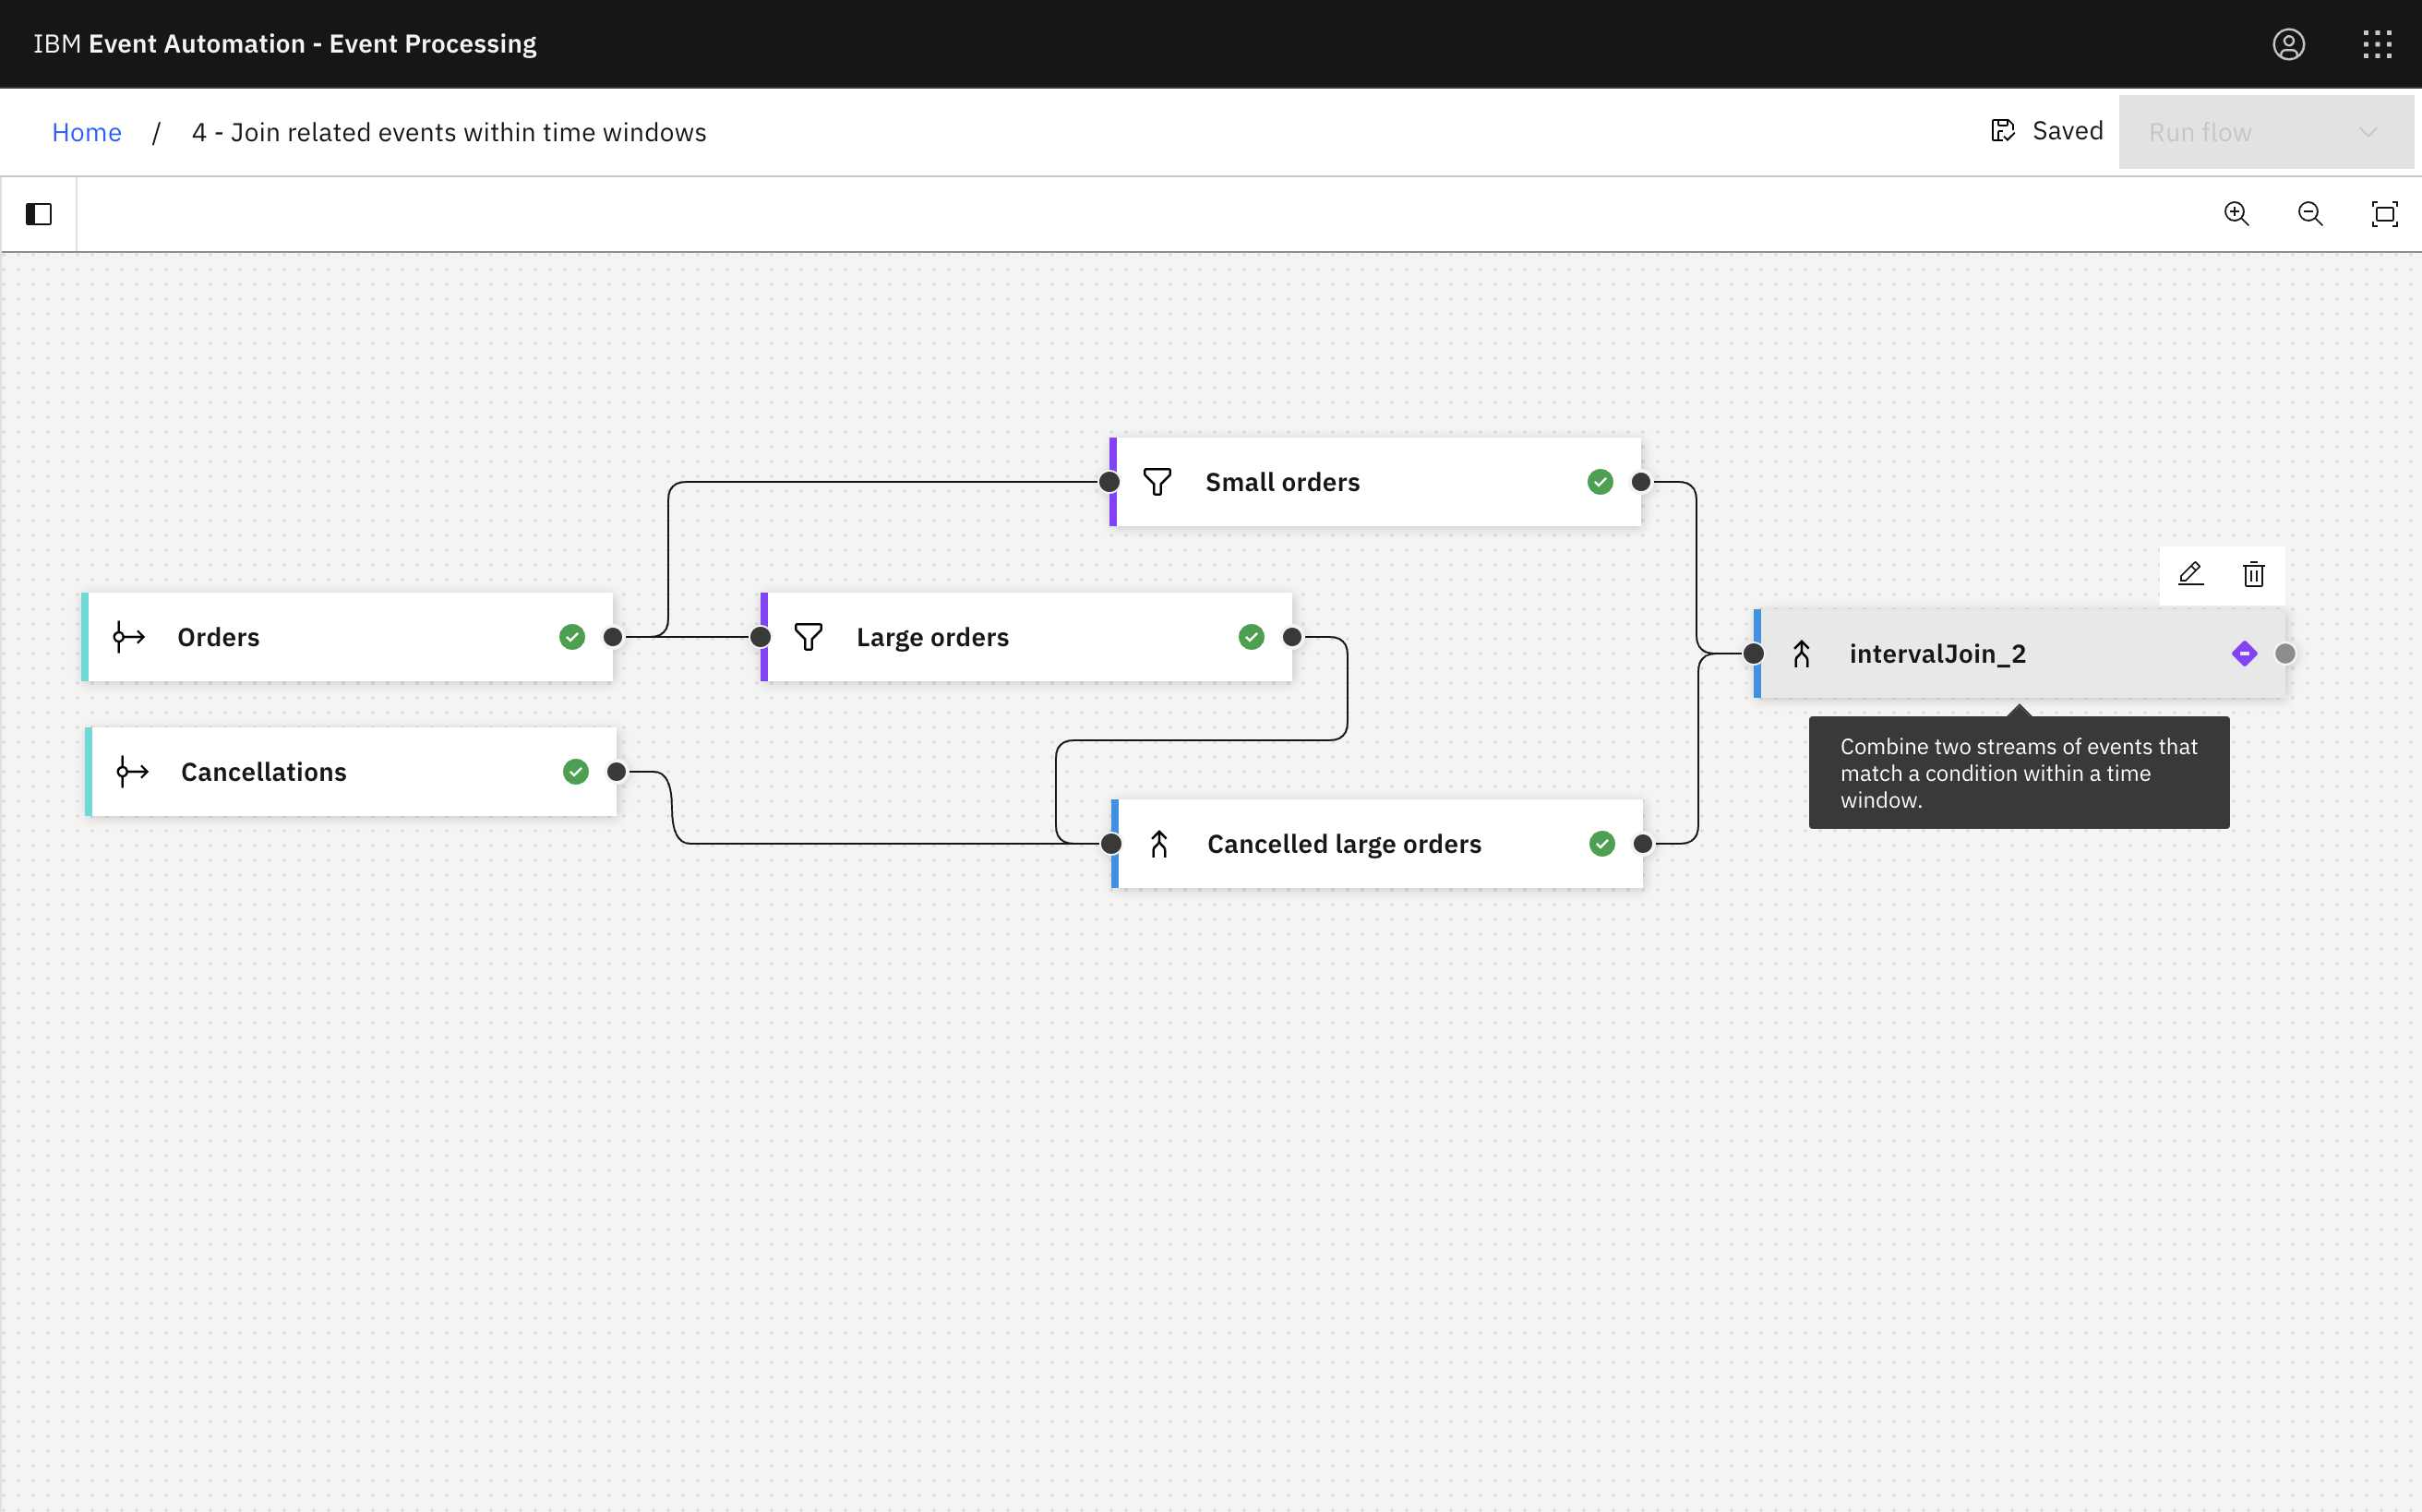
In this scenario, we will look for suspicious orders. Specifically, we will be looking for a particular pattern of behavior where large orders have been placed, followed by a smaller order, but the large order was at some point cancelled. This pattern would suggest an attempt to manipulate prices, since the presence of the large order might result in a subsequent reduction in prices, which the smaller order can take advantage of.
To find this pattern, we will use the “join” capability to compare a stream of “orders” with a stream of “cancellations”.
Before you begin
The instructions in this tutorial use the Tutorial environment, which includes a selection of topics each with a live stream of events, created to allow you to explore features in IBM Event Automation. Following the setup instructions to deploy the demo environment gives you a complete instance of IBM Event Automation that you can use to follow this tutorial for yourself.
Versions
This tutorial uses the following versions of Event Automation capabilities. Screenshots may differ from the current interface if you are using a newer version.
- Event Streams 12.1.0
- Event Endpoint Management 11.6.4
- Event Processing 1.4.6
Instructions
Step 1: Create a flow
-
Go to the Event Processing home page.
If you need a reminder of how to access the Event Processing home page, you can review Accessing the tutorial environment.
-
Create a flow, and give it a name and description that explains you will be using it to identify suspicious orders.
Step 2: Provide a source of events
The next step is to bring the stream of events to process into the flow. We will reuse the topic connection information from an earlier tutorial.
-
Update the Event source node.
Hover over the node and click
Edit to configure the node.
-
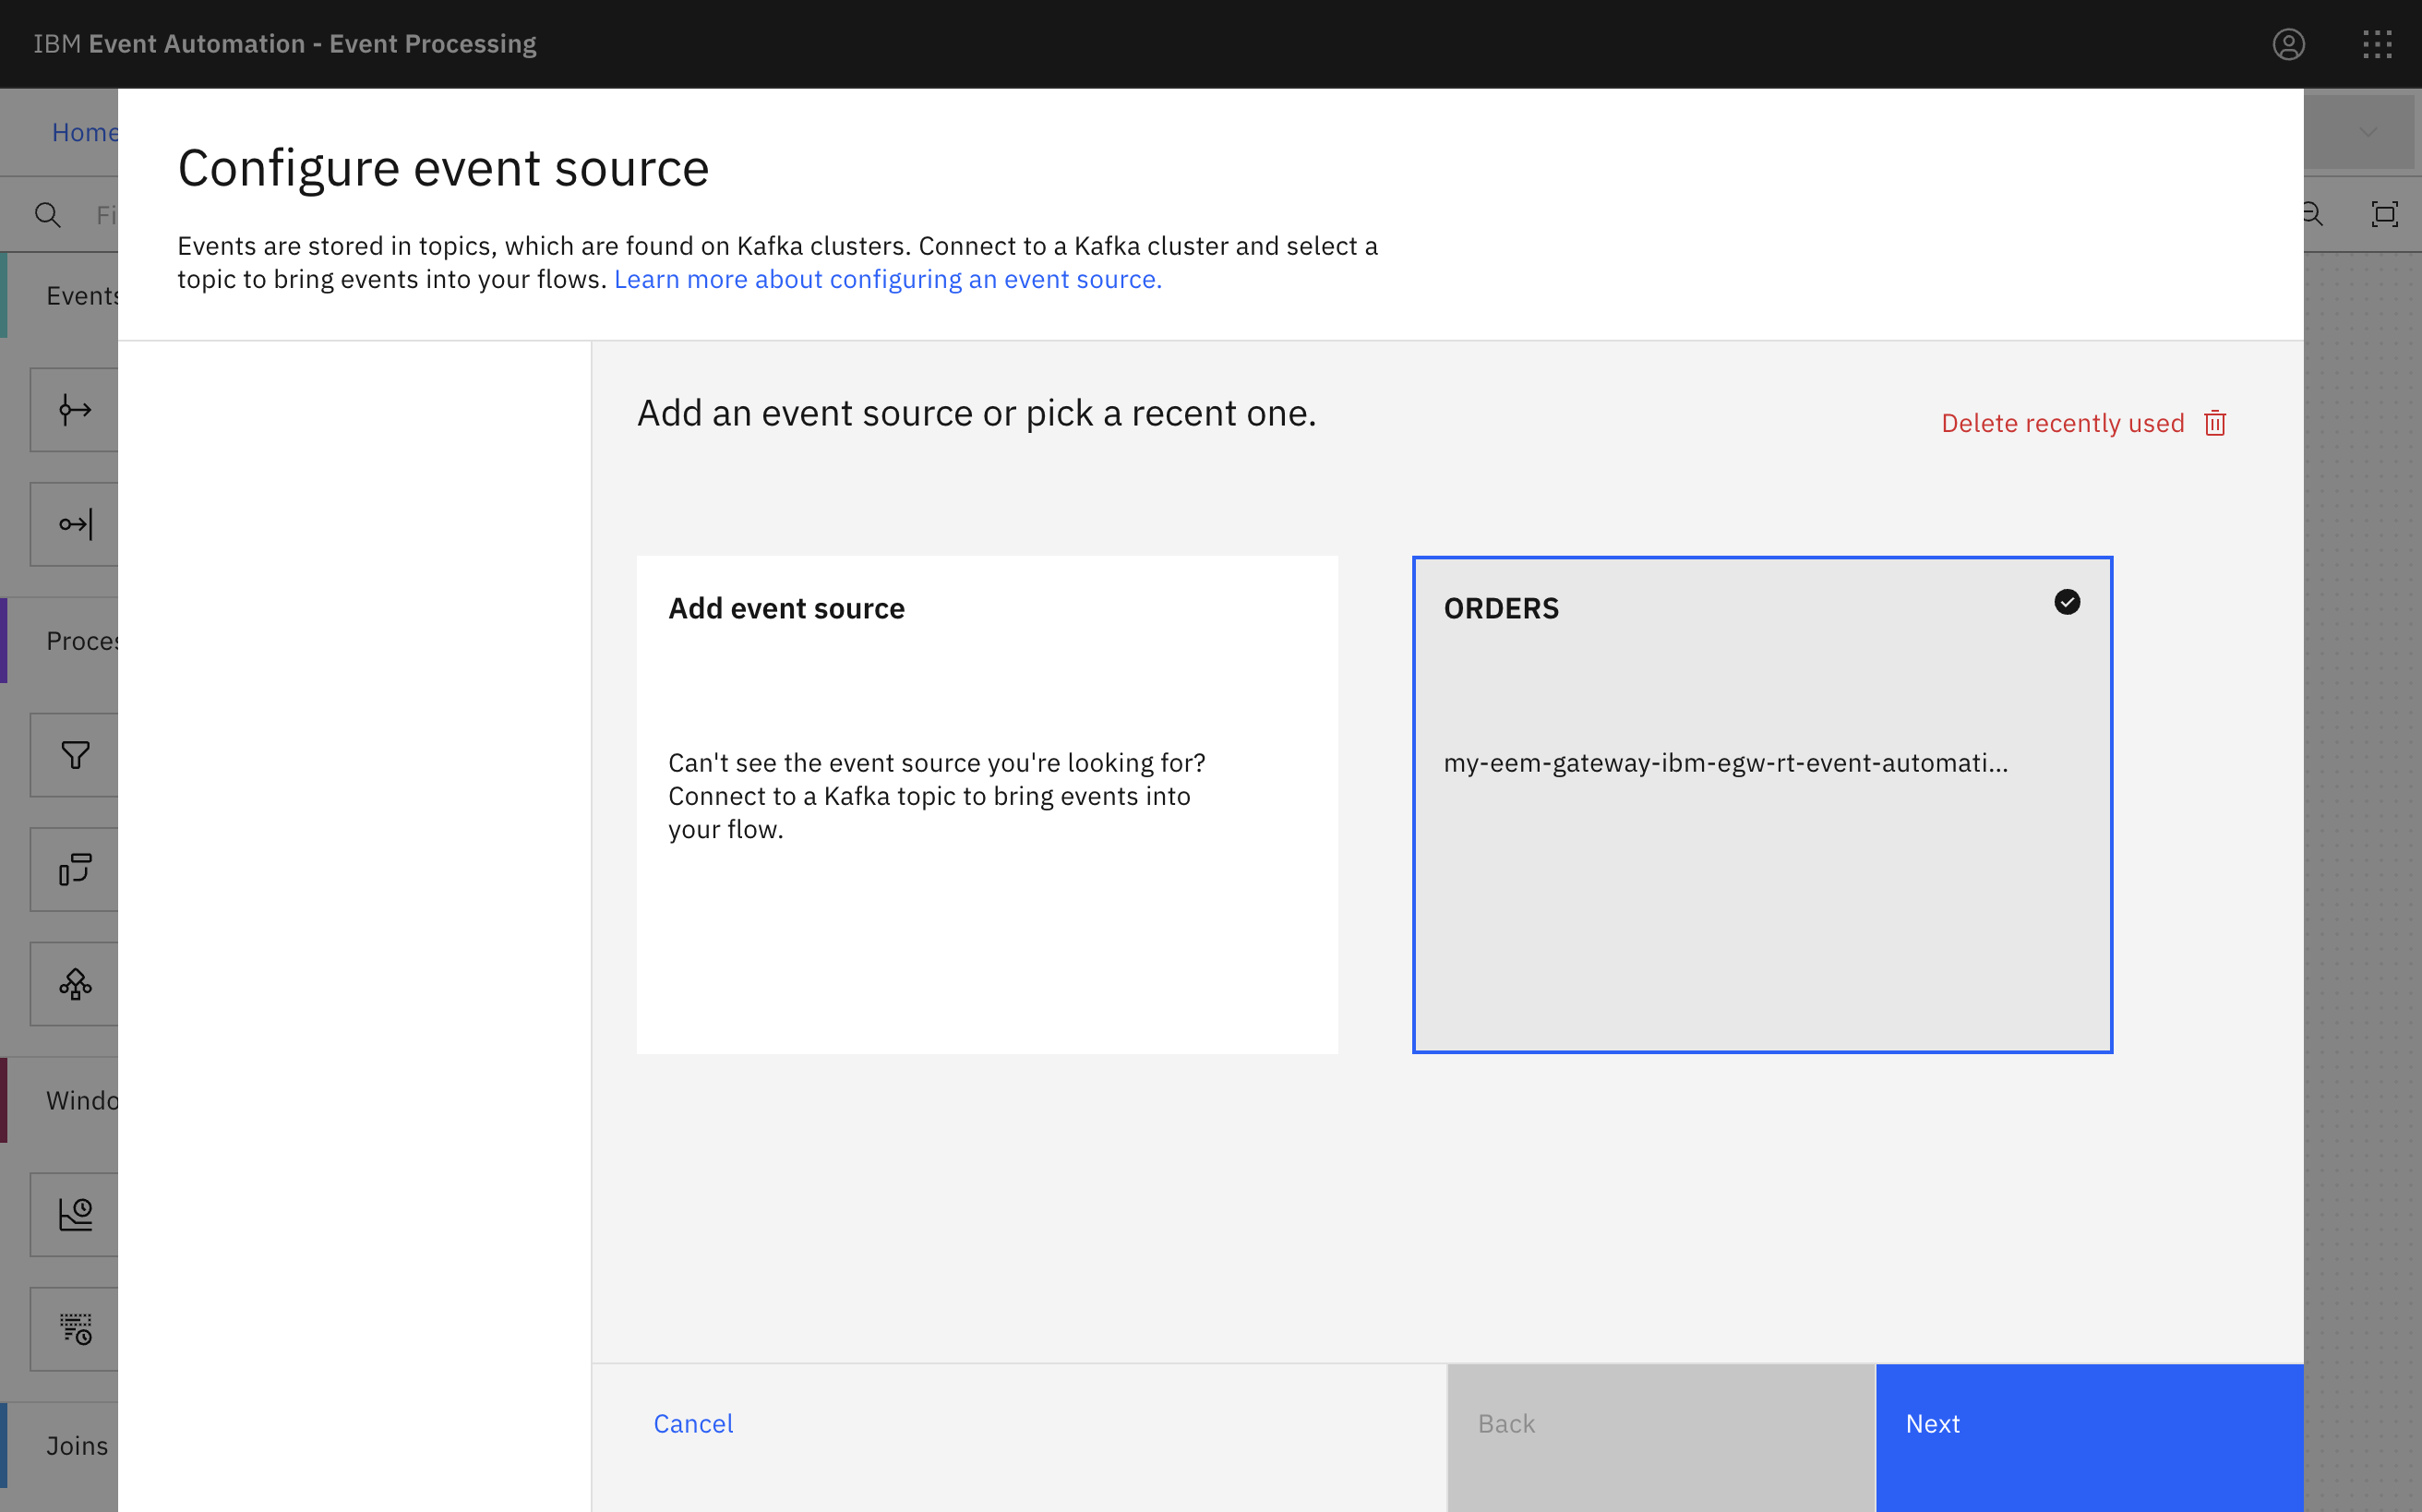
Choose the
ORDERStopic that you used in the Identify orders from a specific region tutorial.Tip: If you haven’t followed that tutorial, you can click Add new event source instead, and follow the Provide a source of events steps in the previous tutorial to define a new Event source from scratch.
Click Next.
-
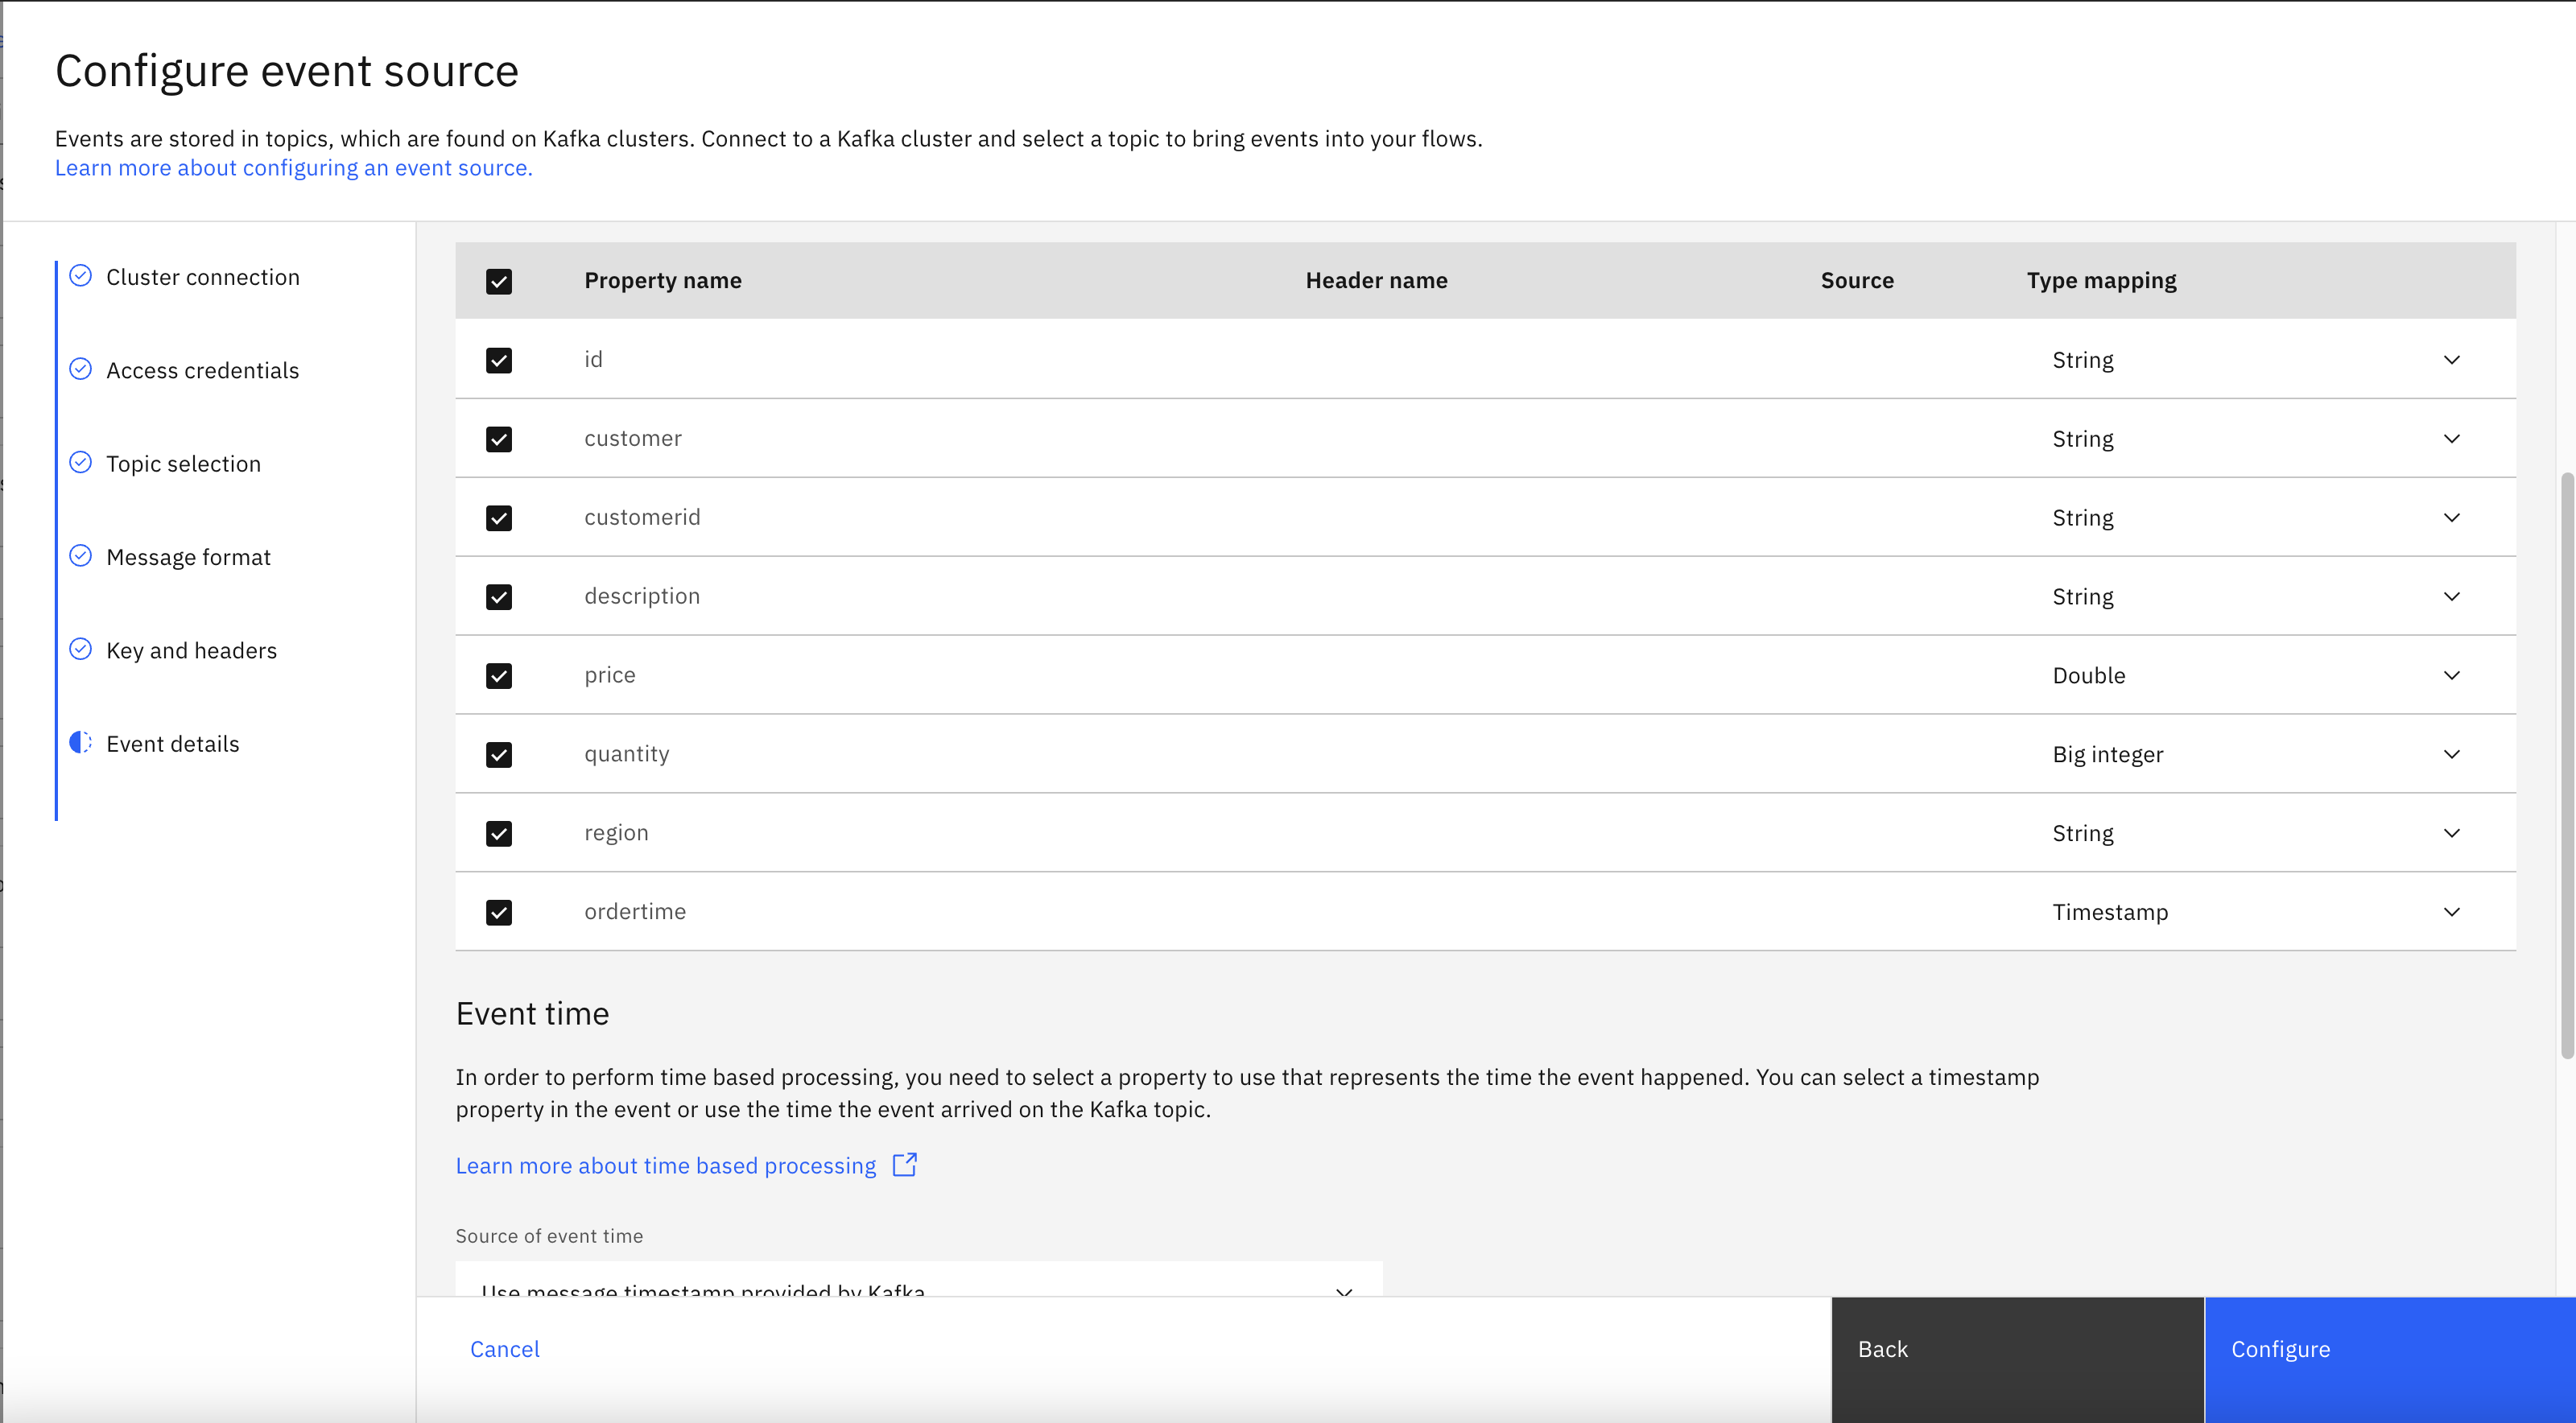
In the Event details pane, the schema for events on this topic defined before is displayed.
Click Configure.
Step 3: Identify large orders
In this scenario, you suspect that people may be attempting to manipulate prices by making large orders that are later cancelled.
The next step is to identify the large orders.
-
Add a Filter node to the flow.
Create a filter node by dragging one onto the canvas. You can find this in the Processors section of the left panel.
Click and drag from the small gray dot on the event source to the matching dot on the filter node.
Hover over the filter node and click
Edit to configure the node.
-
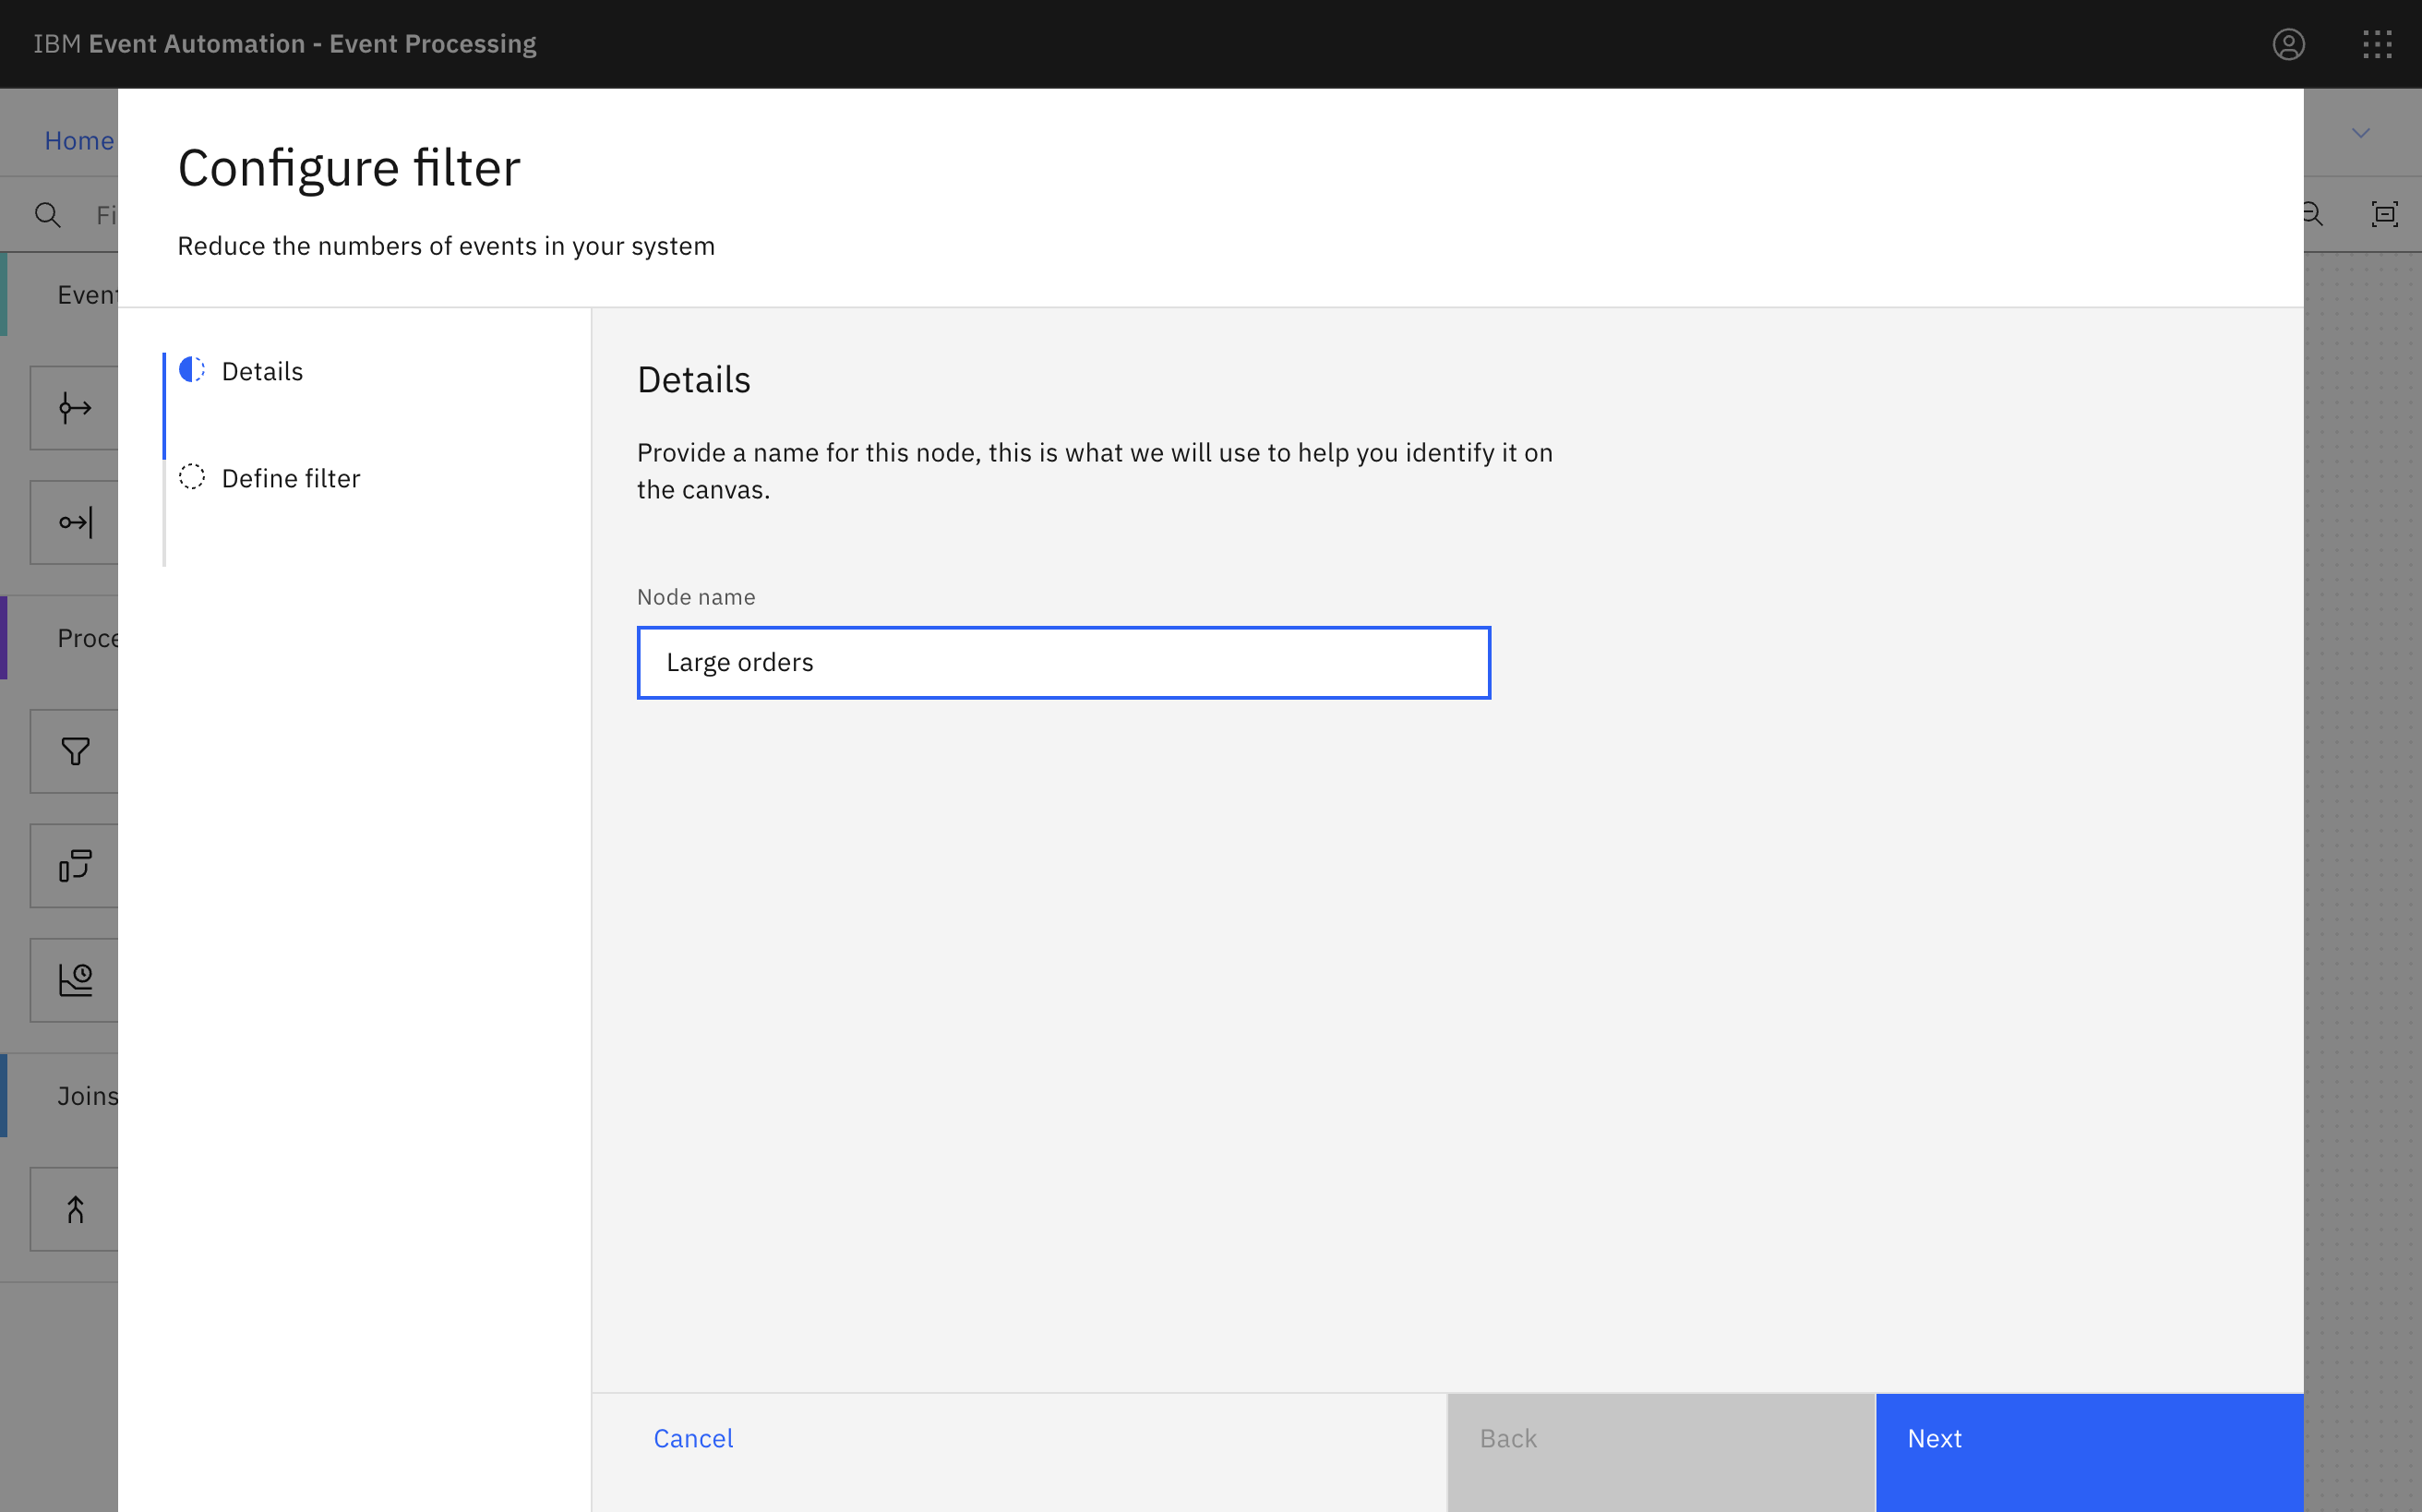
Give the filter node a name that describes the results:
Large orders.Click Next. In the Define filter pane, click the Filter assistant to open the assistant pane.
-
Create an expression that selects orders for more than
5items.`quantity` > 5Tip: You don’t need to use the assistant if you know the expression you would like. You can type the expression in directly, and use the auto-complete and syntax-checking to make sure you enter it correctly.
Click Insert expression.
-
Click Next to open the Output properties pane. Choose the properties to output.
-
Click Configure to finalize the filter.
Step 4: Test the flow
The next step is to test your event processing flow and view the results.
-
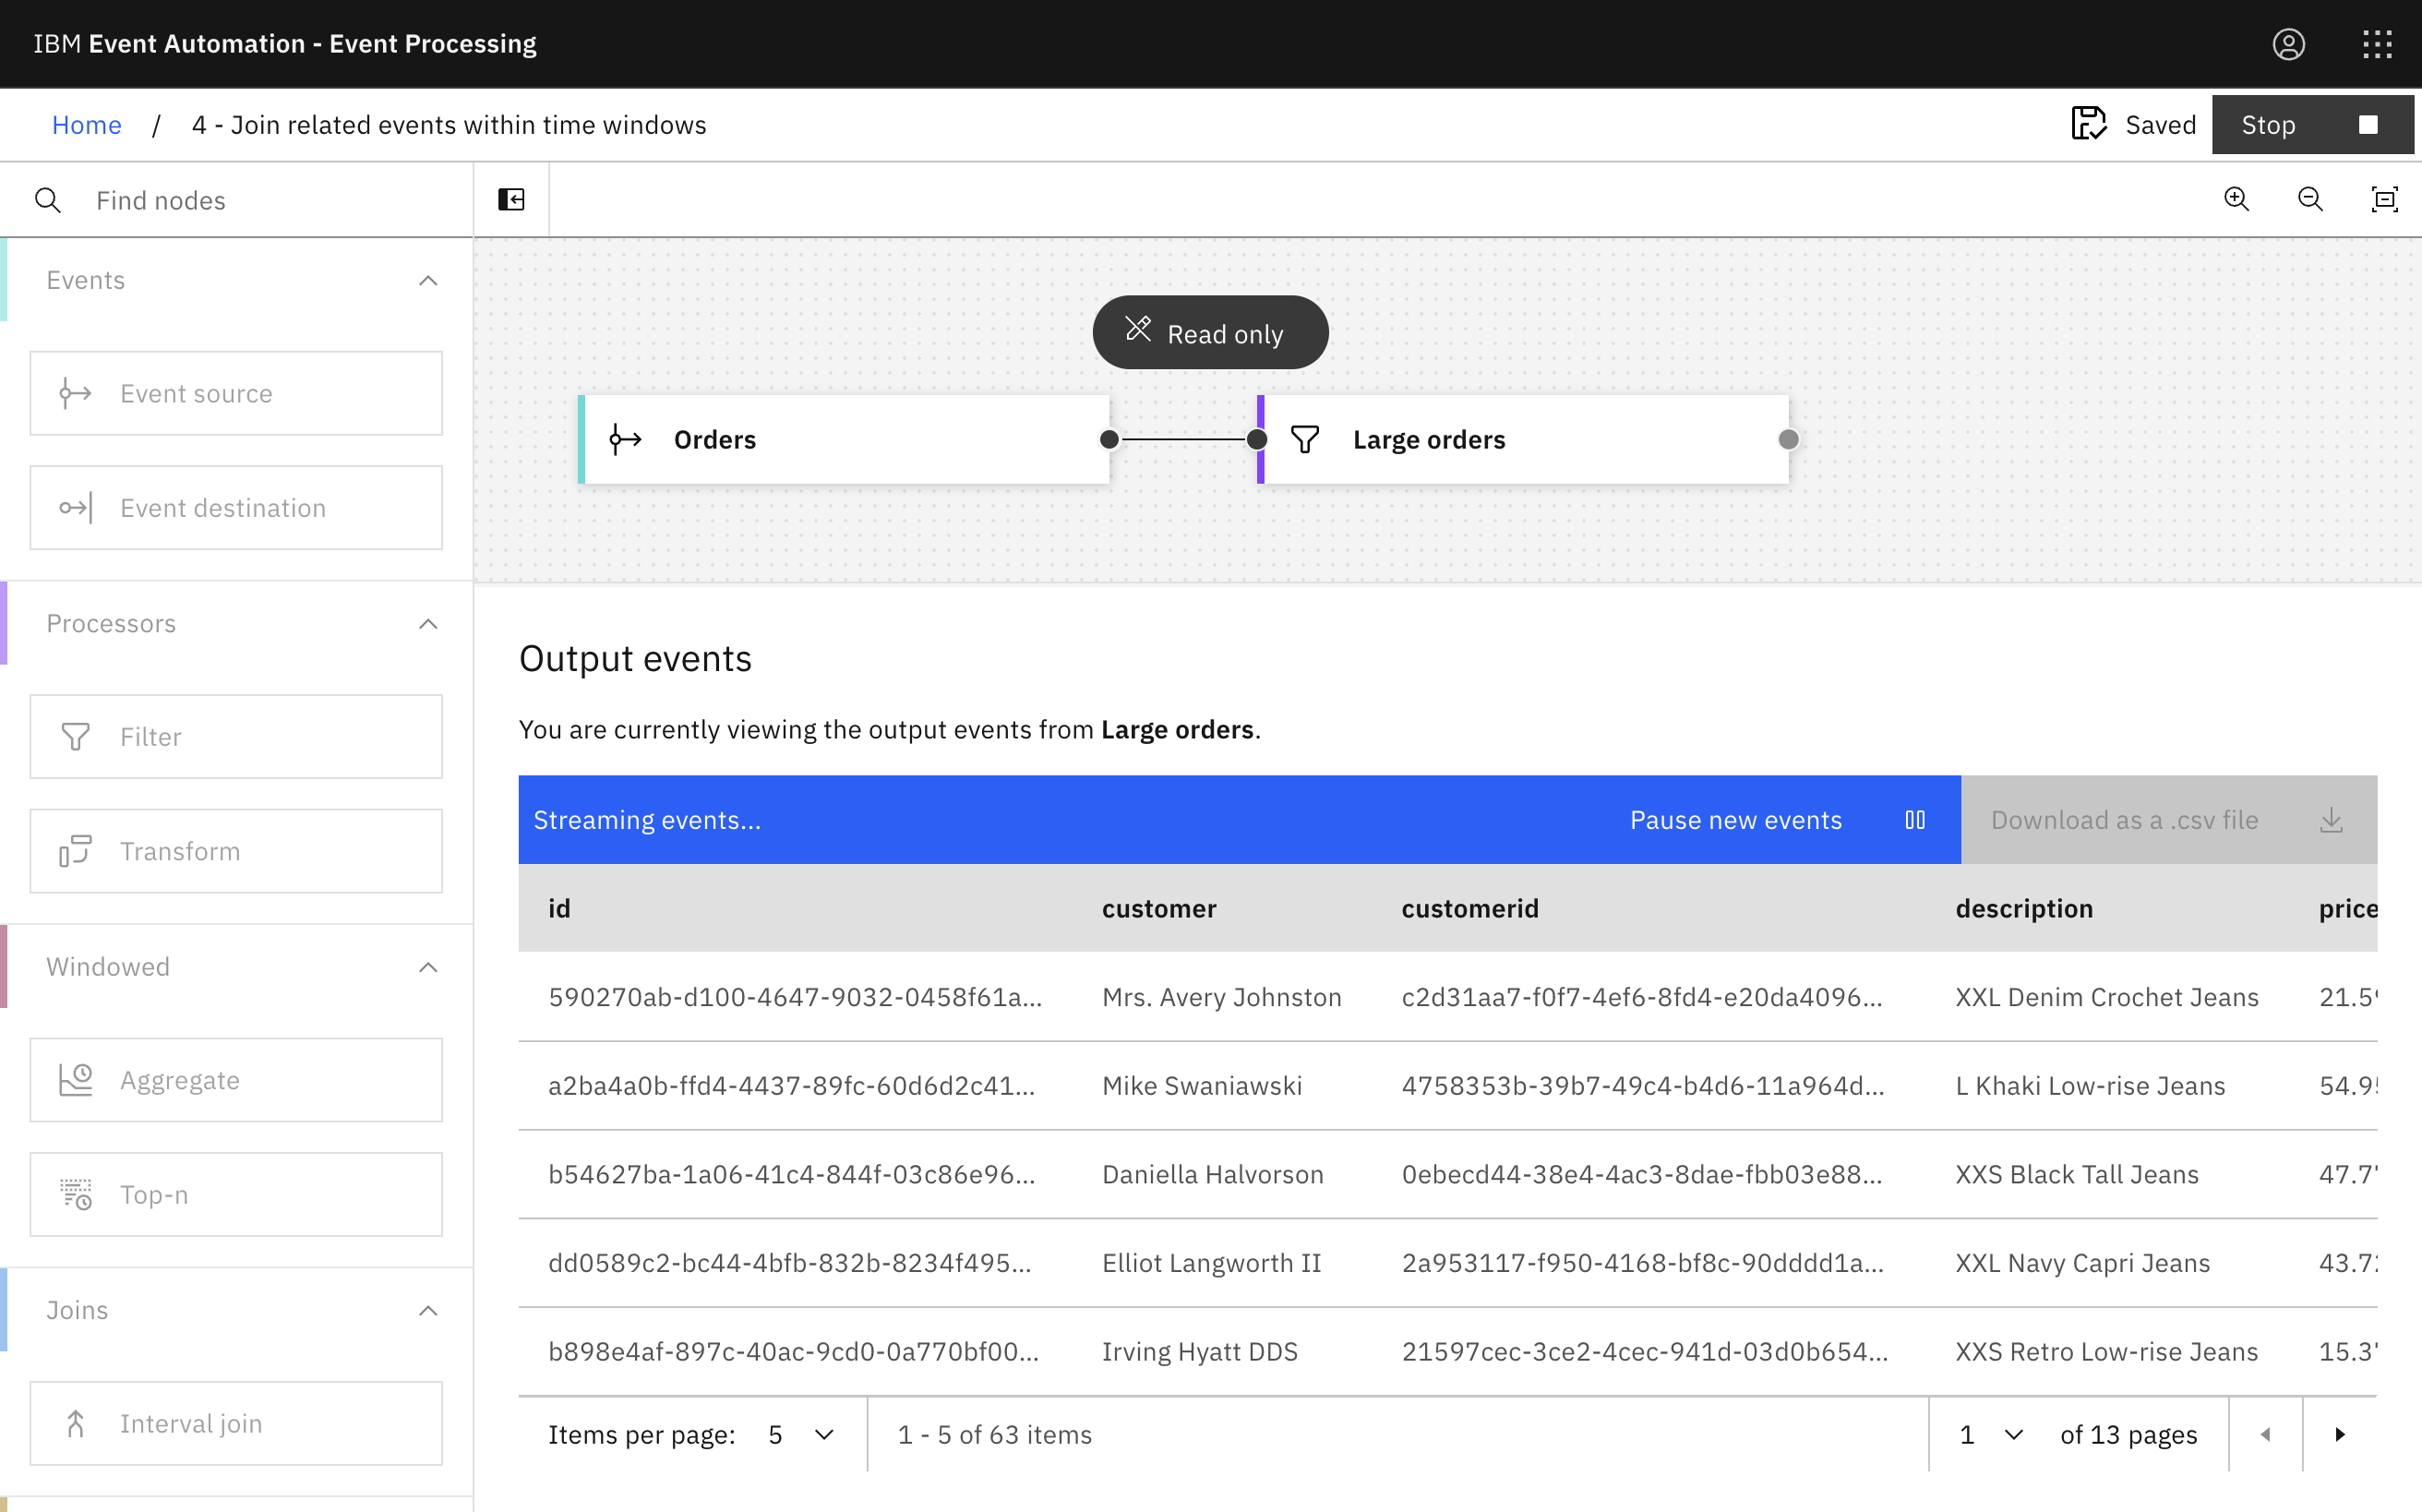
Use the Run menu, and select Include historical to run your filter on the history of order events available on this Kafka topic.
Tip: It is good to regularly test as you develop your event processing flow to confirm that the last node you have added is doing what you expected.
-
Confirm that all of the order events displayed have a quantity of more than five items. Once you’re happy with your flow, you can stop it.
Tip: Keep this page open, as you will need it again in a moment. Do the following steps in a separate browser window or tab.
Step 5: Discover an additional source of events
For this scenario, you want to identify which of these large orders are cancelled within 30 minutes of being made.
The next step is to find a stream of order cancellation events to add to your flow. A good place to discover sources of event streams to process is the catalog in Event Endpoint Management.
-
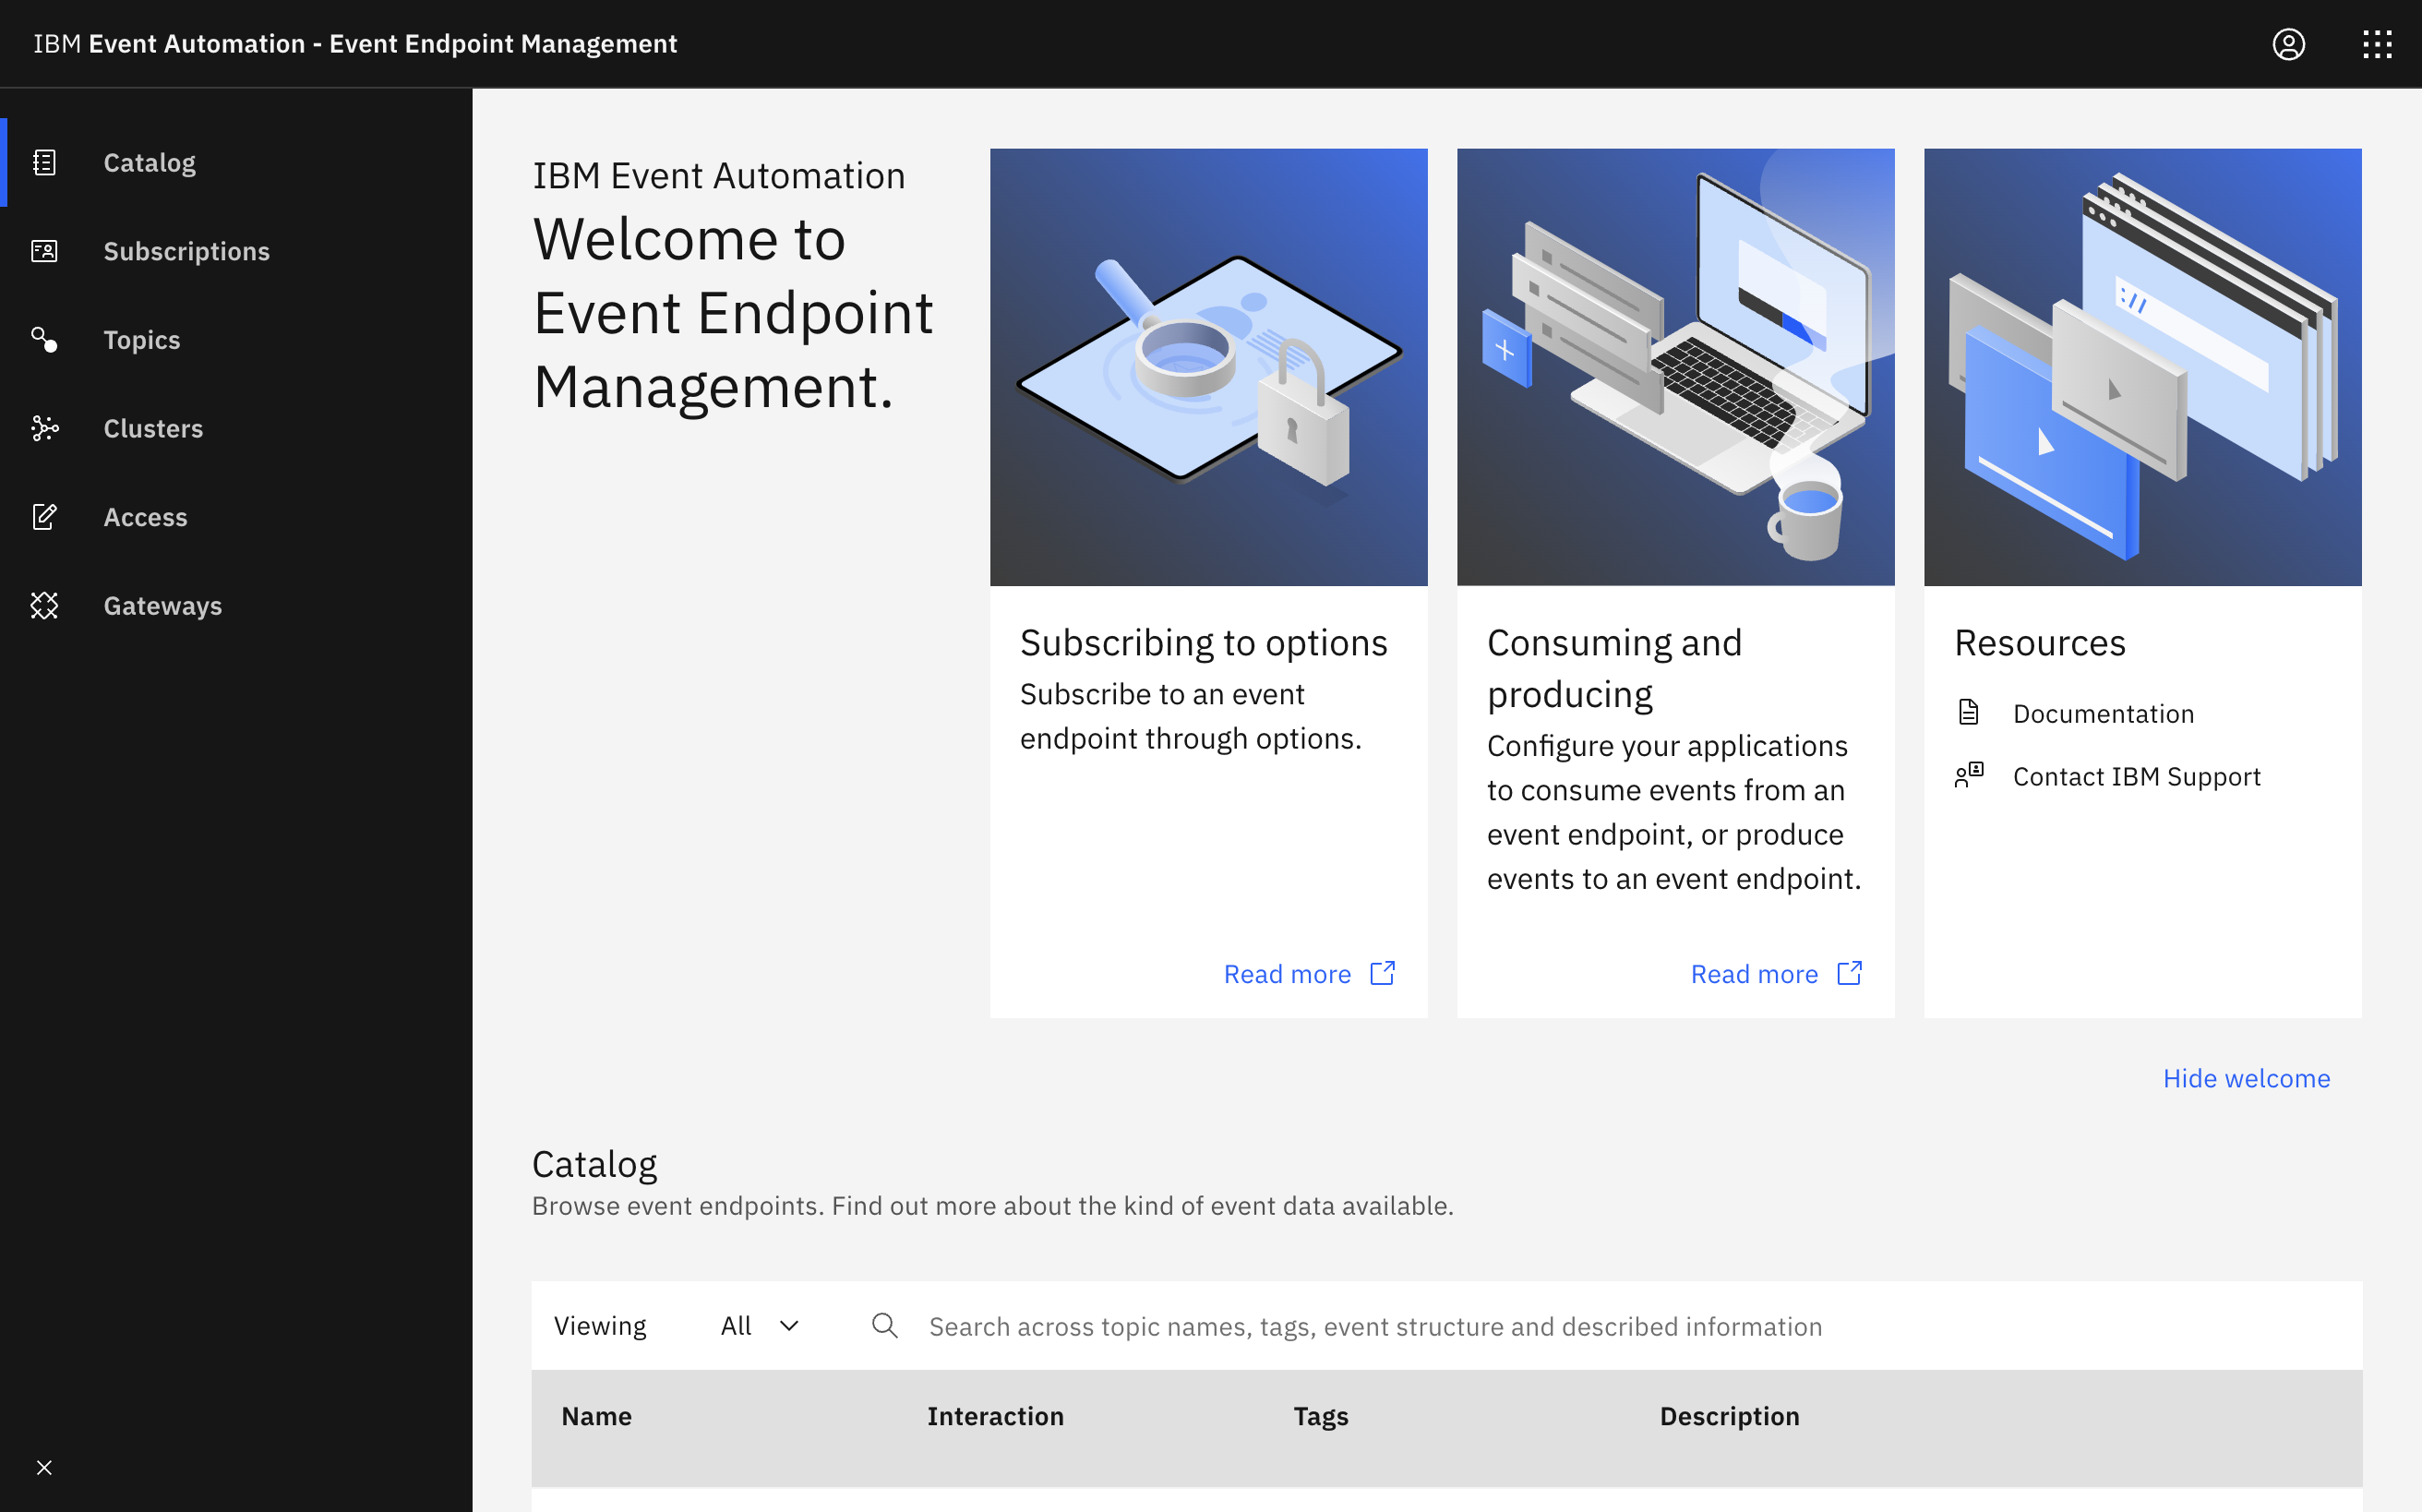
Go to the Event Endpoint Management catalog.
If you need a reminder of how to access the Event Endpoint Management catalog you can review Accessing the tutorial environment.
If there are no topics in the catalog, you may need to complete the tutorial setup step to populate the catalog.
-
Find the
Cancellationstopic. -
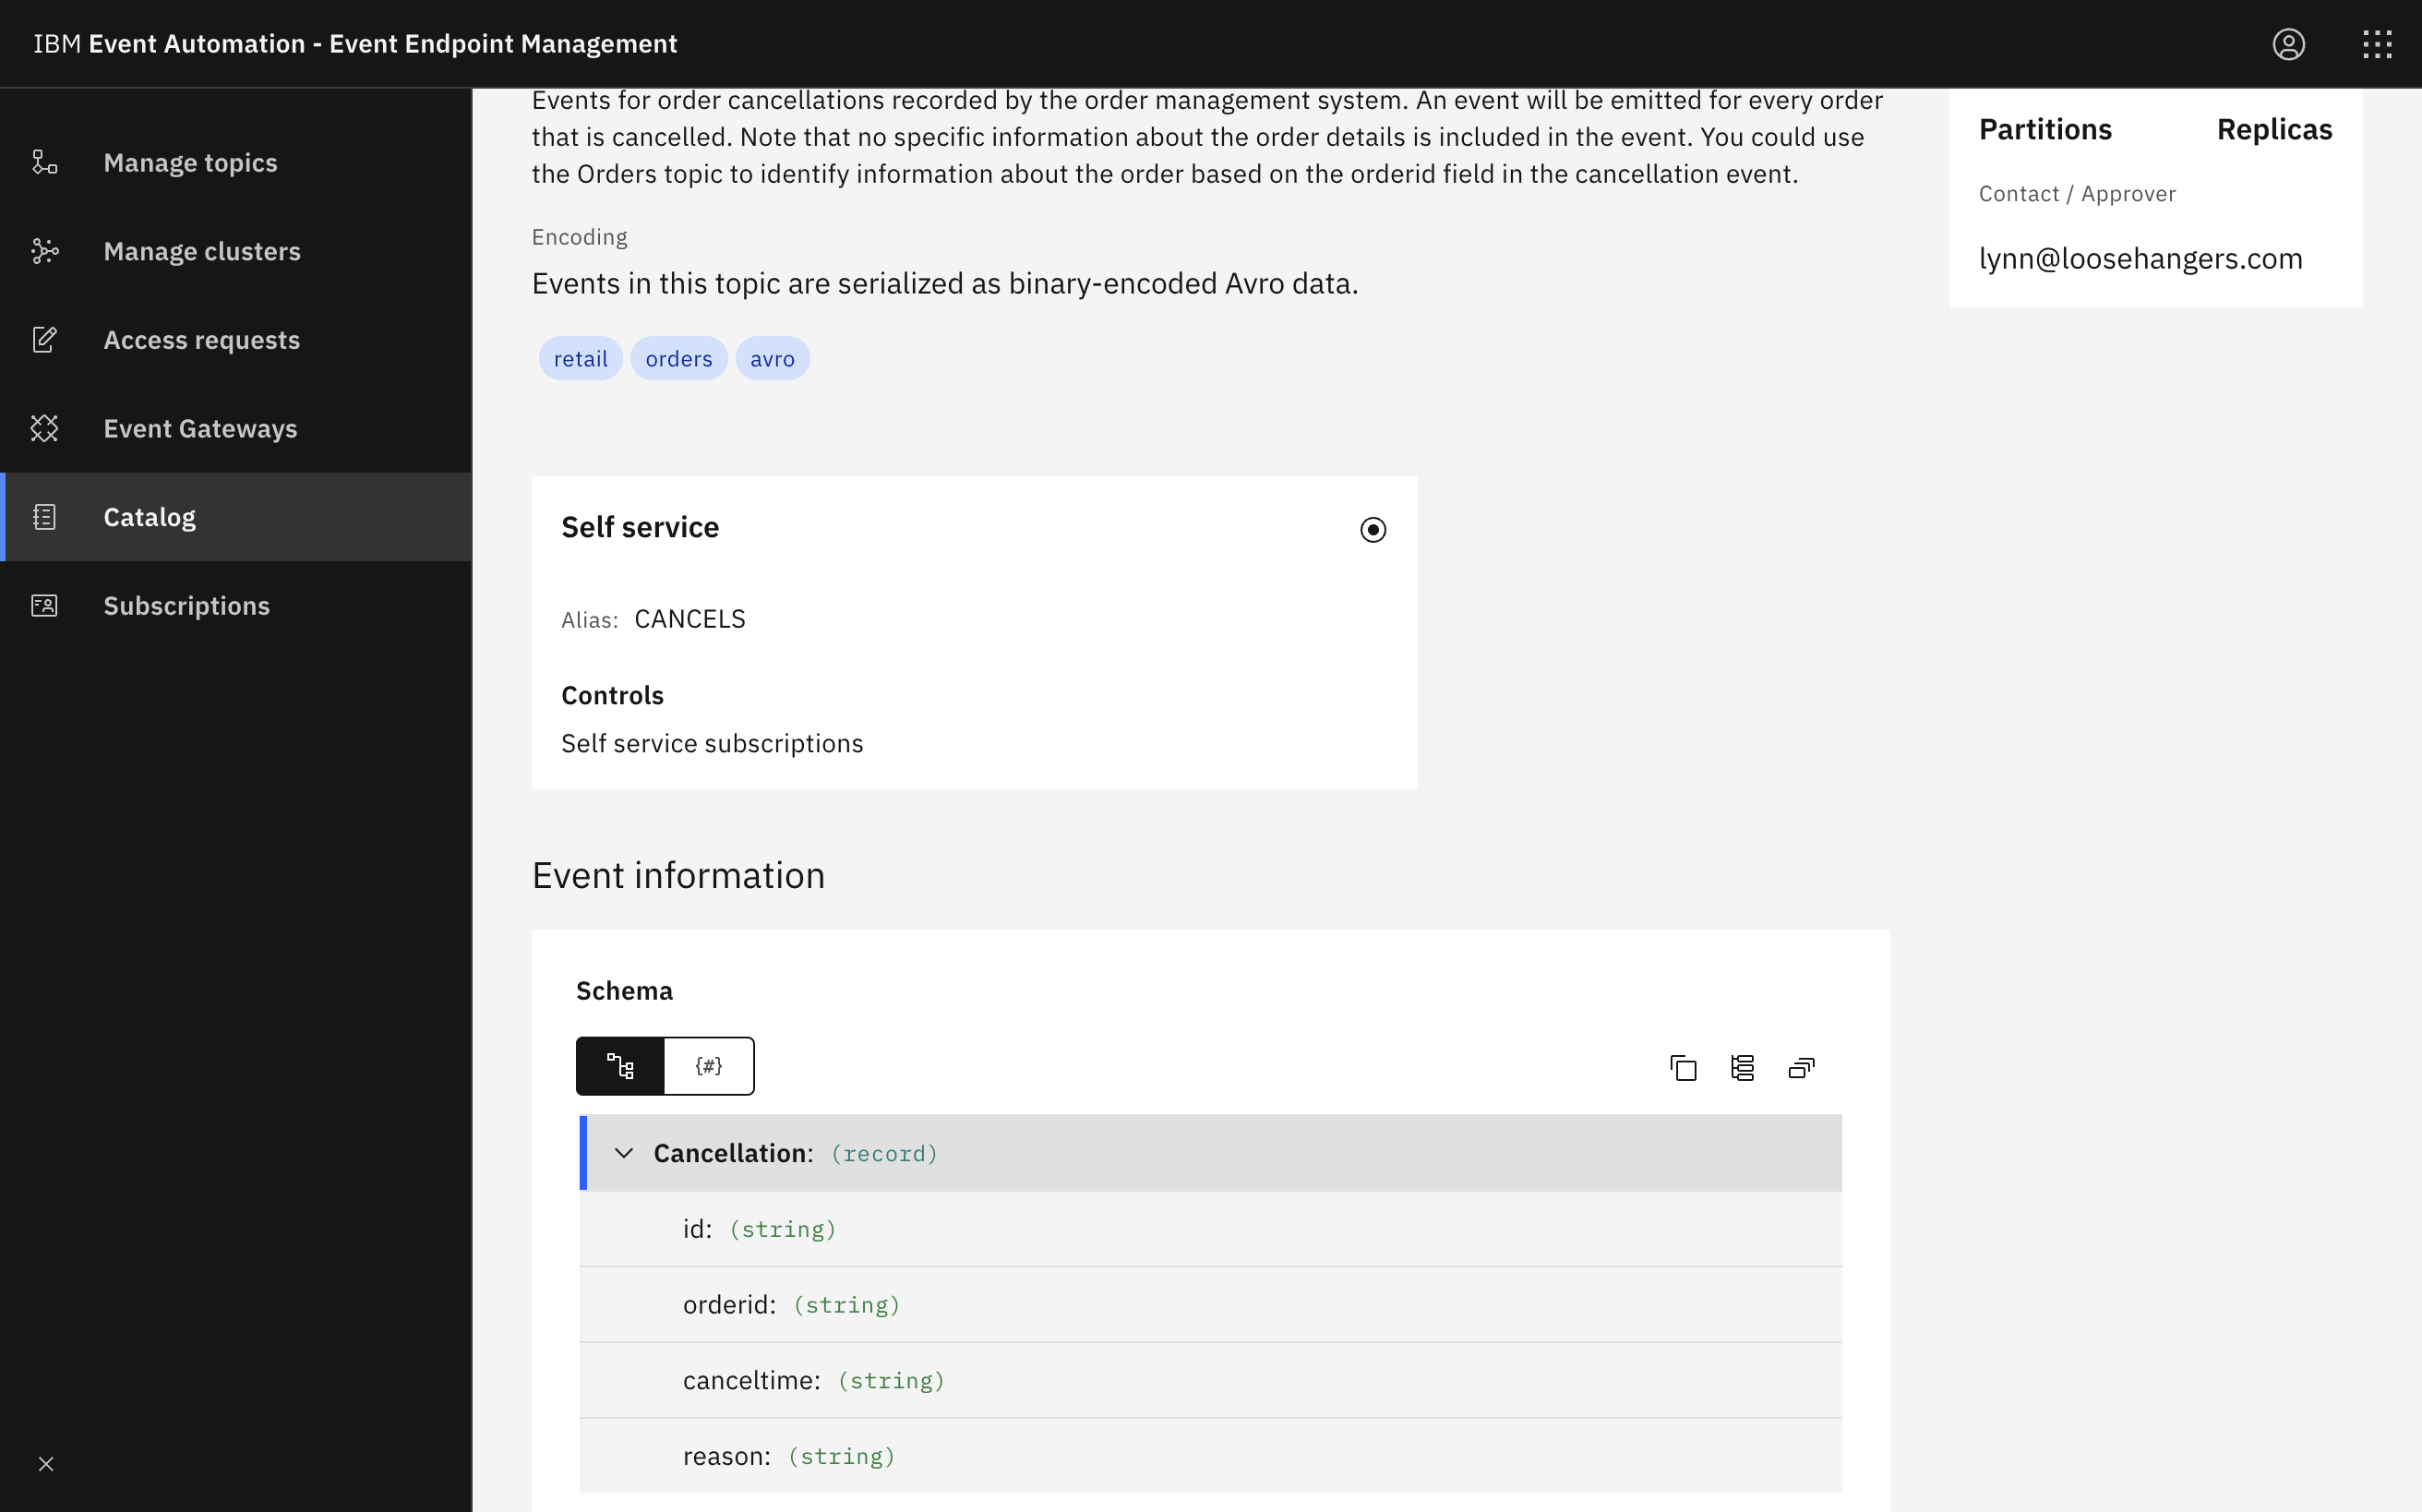
Click into the topic to review the information about the events that are available here.
Look at the schema to see the properties in the order events, and get an idea of what to expect from events on this topic.
Tip: Keep this page open, and use your first browser window to continue developing the event processing flow. It is helpful to have the catalog available while you work on your event processing flows, as it allows you to refer to the documentation about the events as you work.
Step 6: Add an additional source of events to the flow
The next step is to bring this additional stream of events that you discovered in the catalog into Event Processing.
-
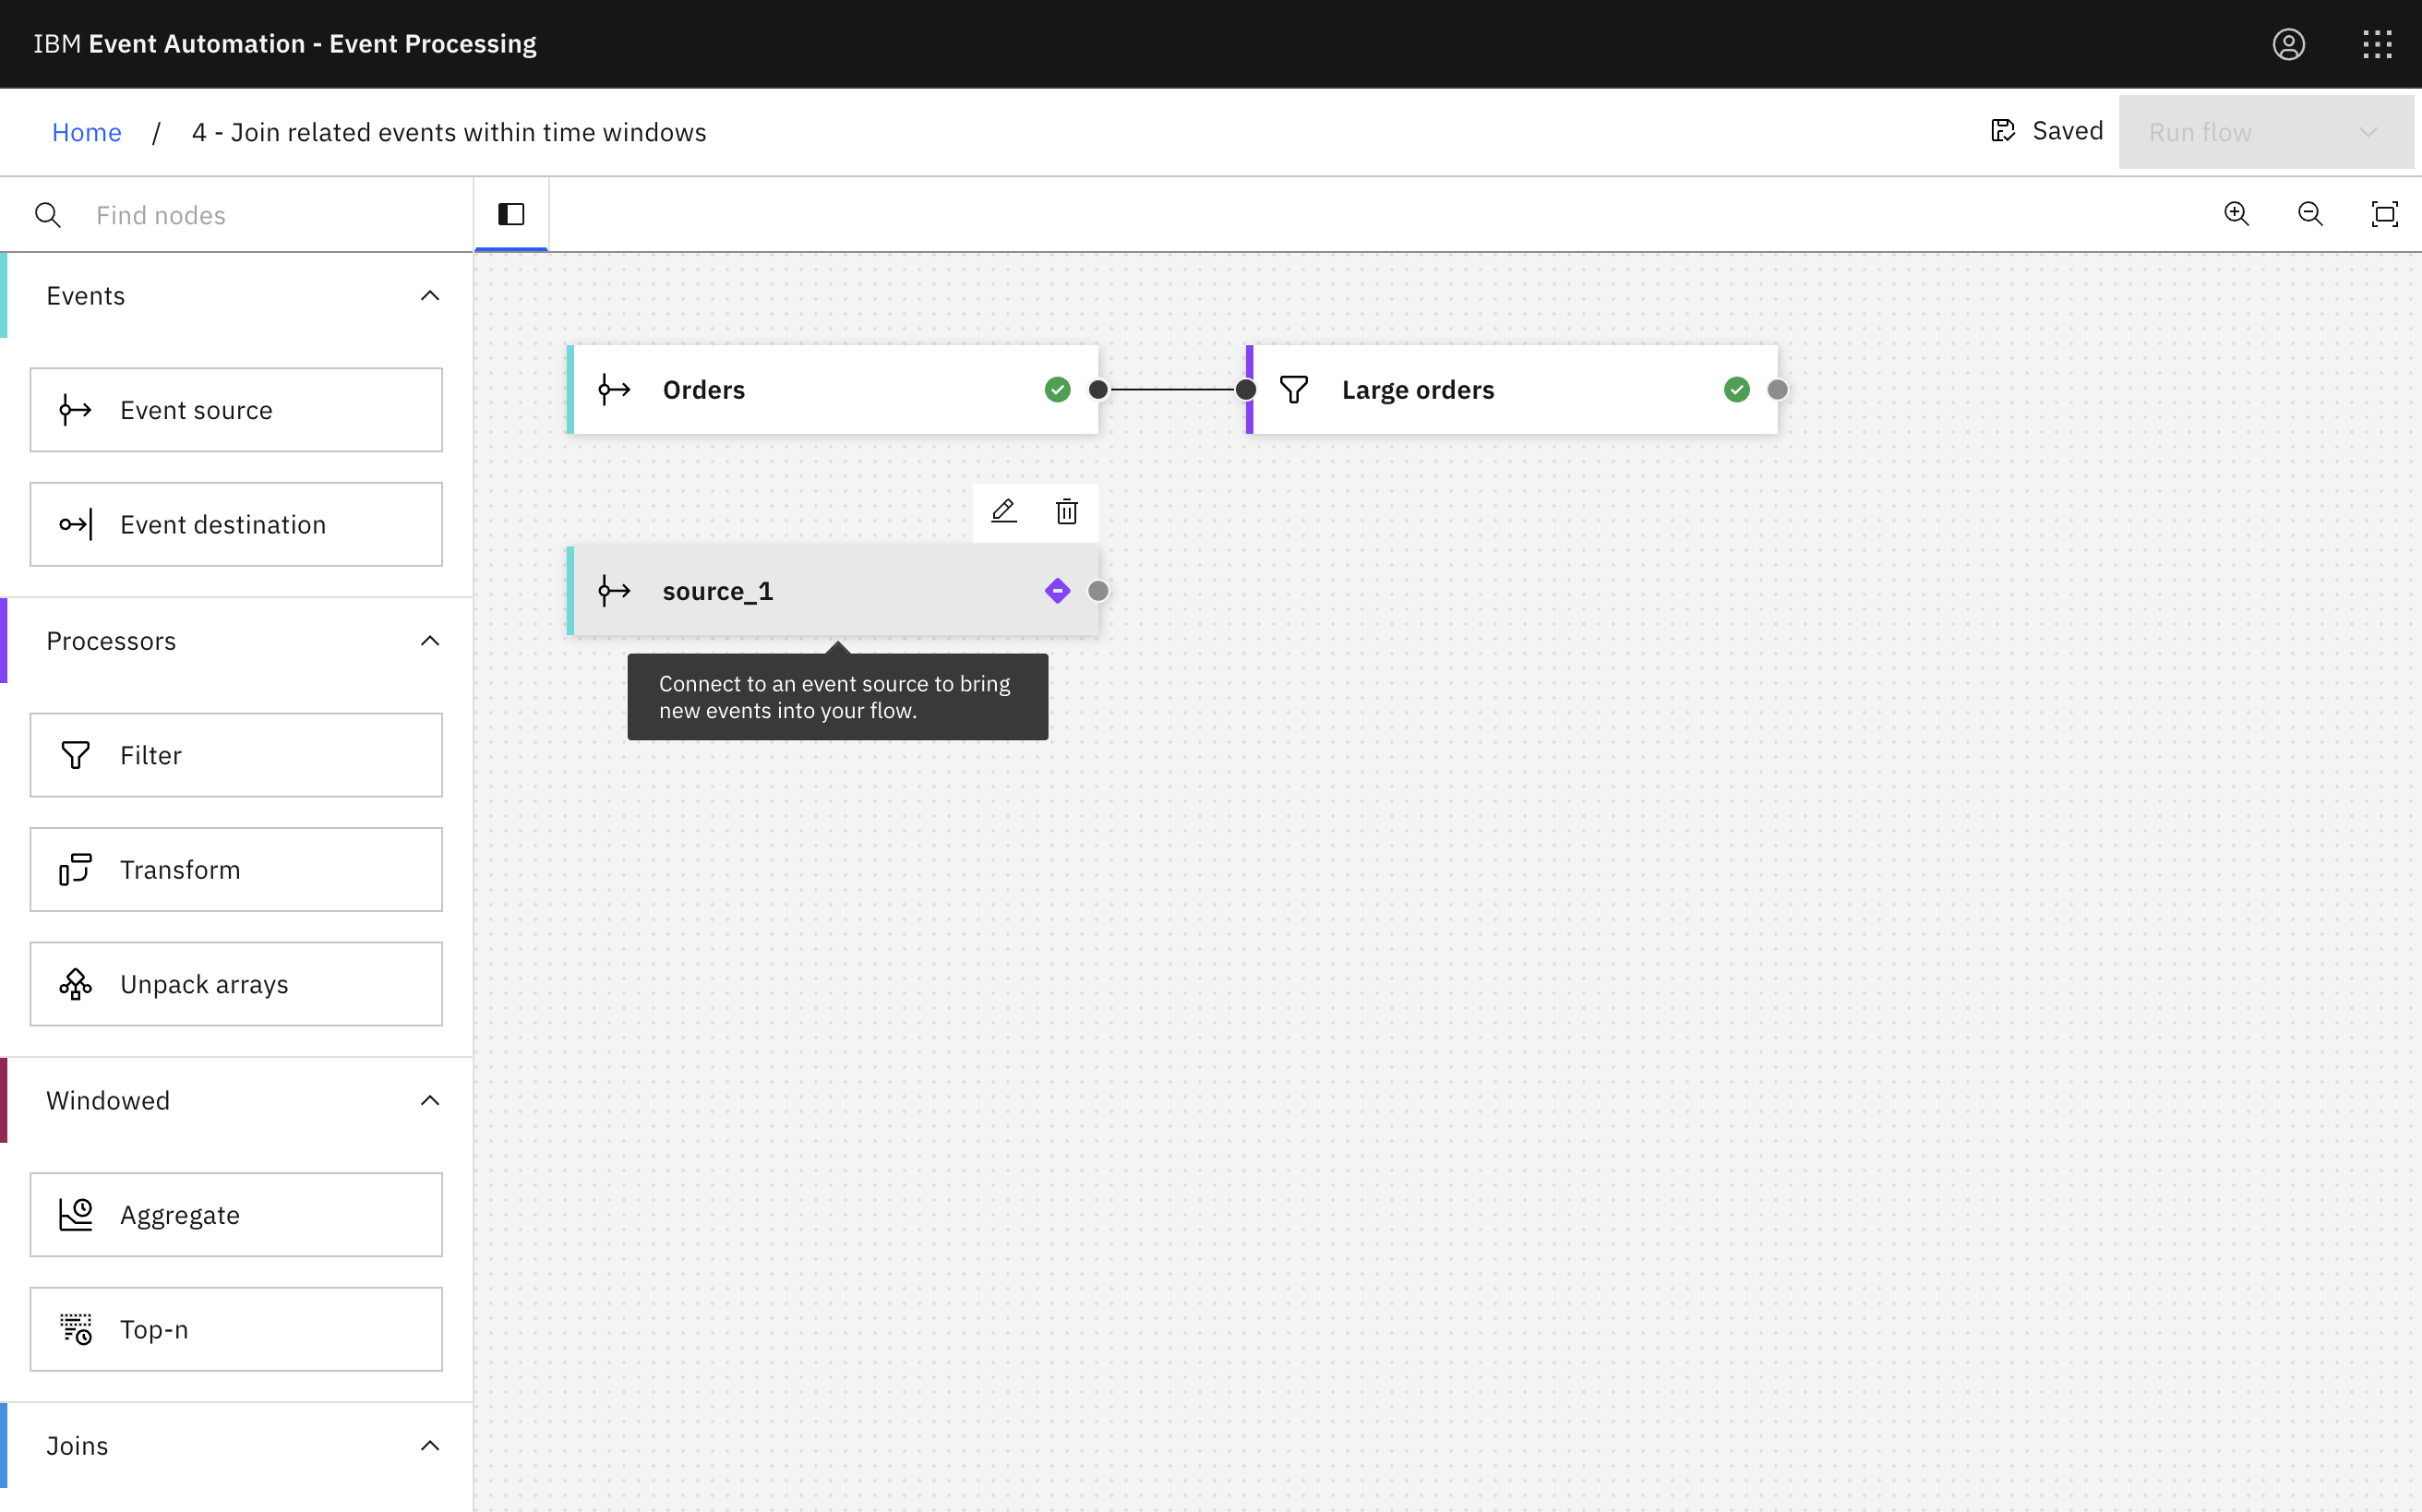
Create an Event source node.
Create an event source node by dragging one onto the canvas. You can find this in the Events section of the left panel.
-
Add a new event source.
Hover over the event source node and click
Edit to configure the node.
-
Get the server address for the event source from the Event Endpoint Management topic page.
Click the Copy icon next to the Servers address to copy the address to the clipboard.
-
Configure the new event source.
Give the node a name that describes this stream of events:
Cancellations.Paste in the server address that you copied from Event Endpoint Management in the previous step.
-
Generate access credentials for accessing this stream of events from the Event Endpoint Management page.
Click Subscribe, and provide your contact details.
-
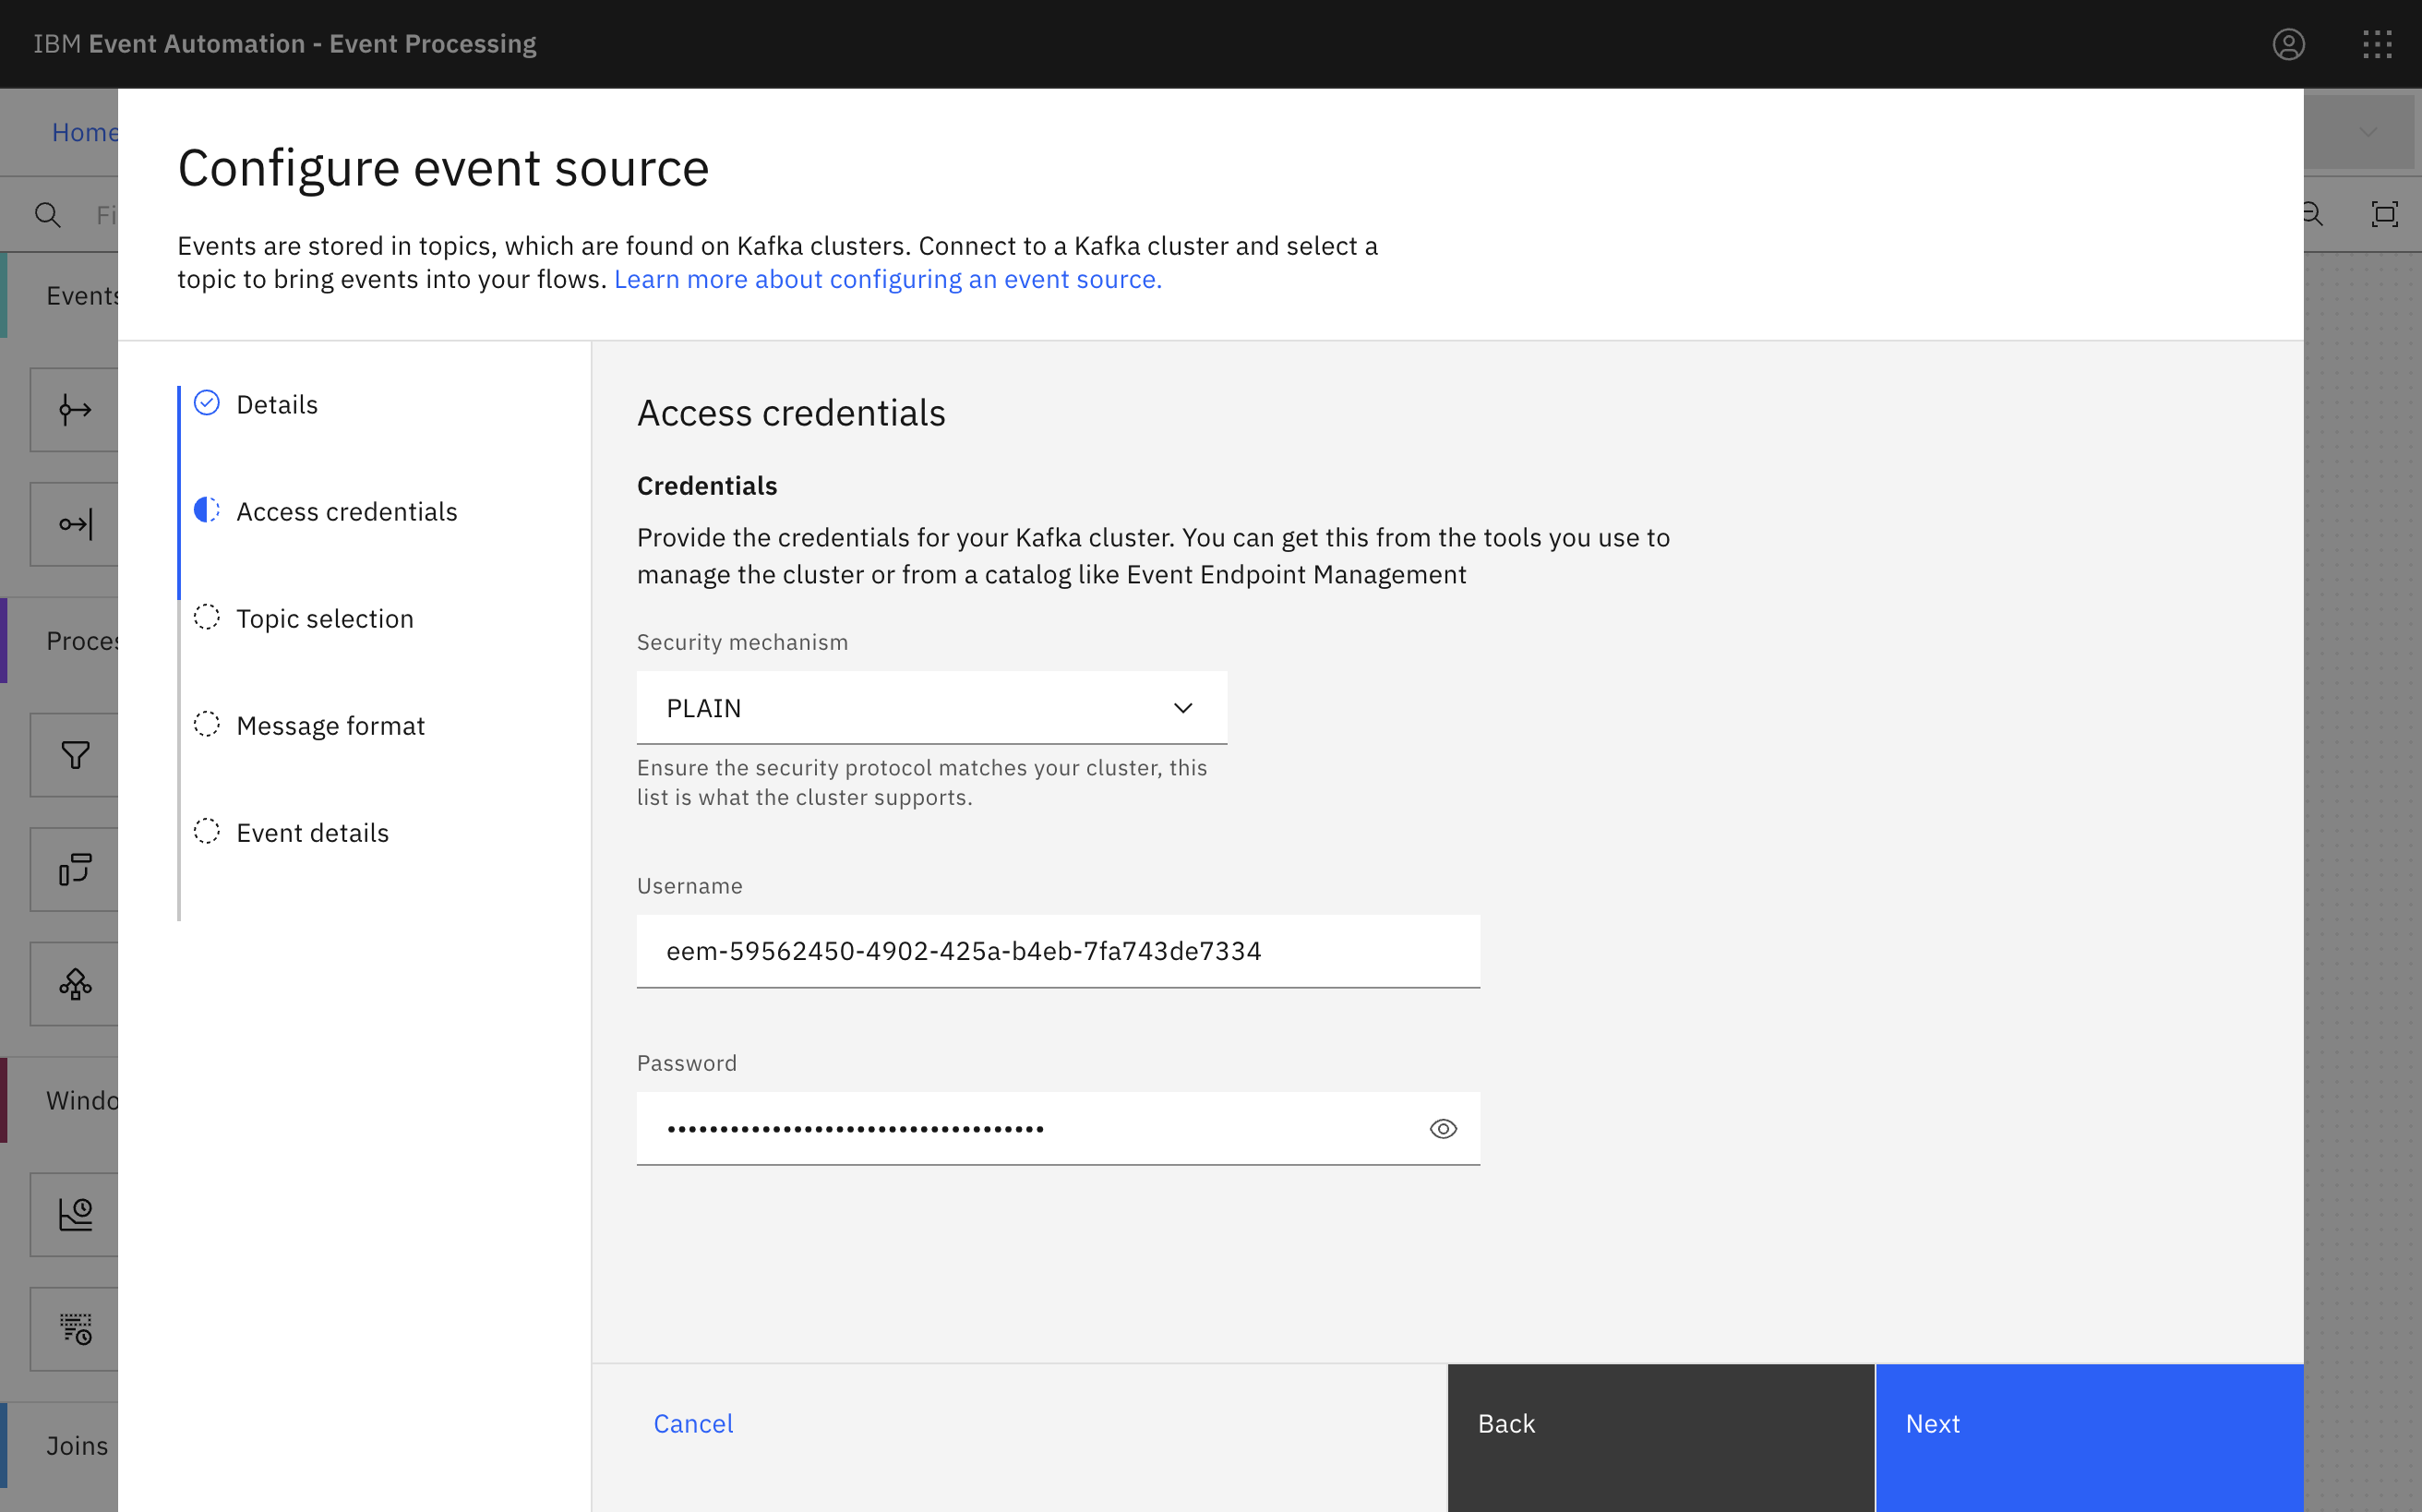
Copy the username and password from Event Endpoint Management and paste into Event Processing to allow access to the topic.
The username starts with
eem-.Did you know? The username and password you created is unique to you, and is only for accessing this topic. If you need to revoke this password, you can do it without impacting other users of this topic.
-
Confirm that you will be processing the
CANCELStopic.Click Next.
-
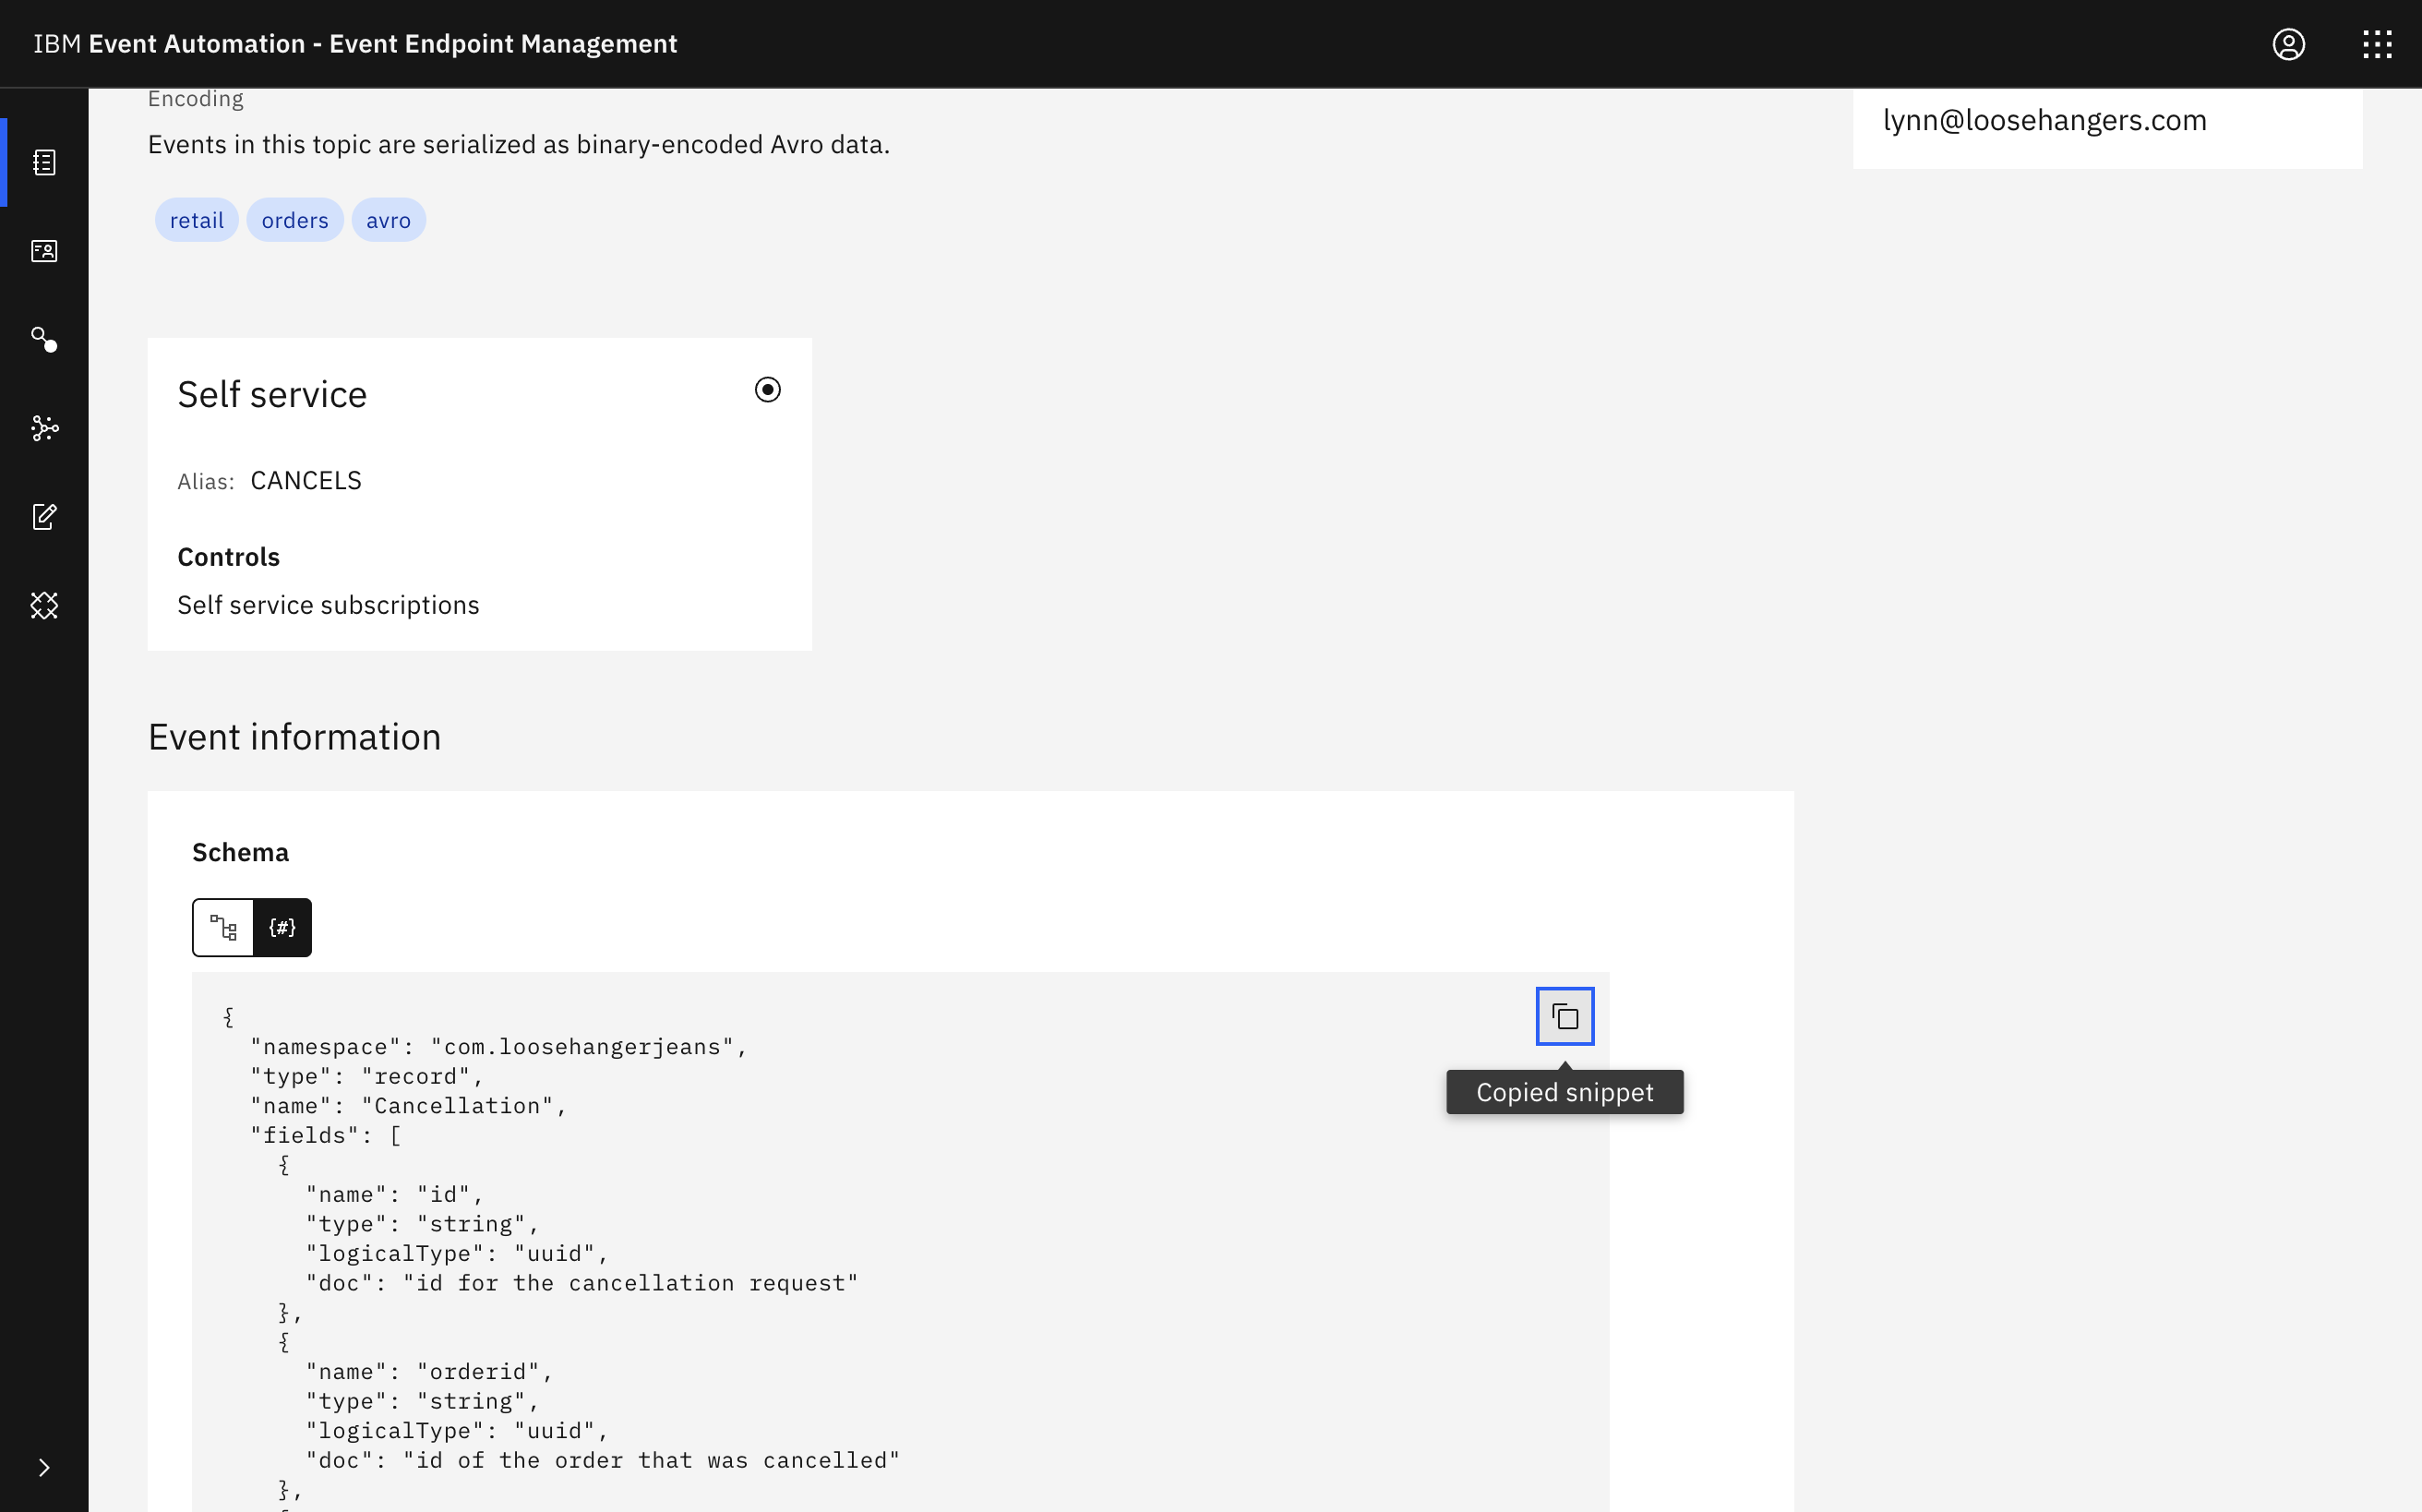
Get the schema for cancellation events from Event Endpoint Management.
Switch to the JSON schema view, and then click the Copy icon for the schema to copy it to the clipboard.
You need to give Event Processing a description of the events available from the topic. The information in the schema will enable Event Processing to give guidance for creating event processing nodes.
-
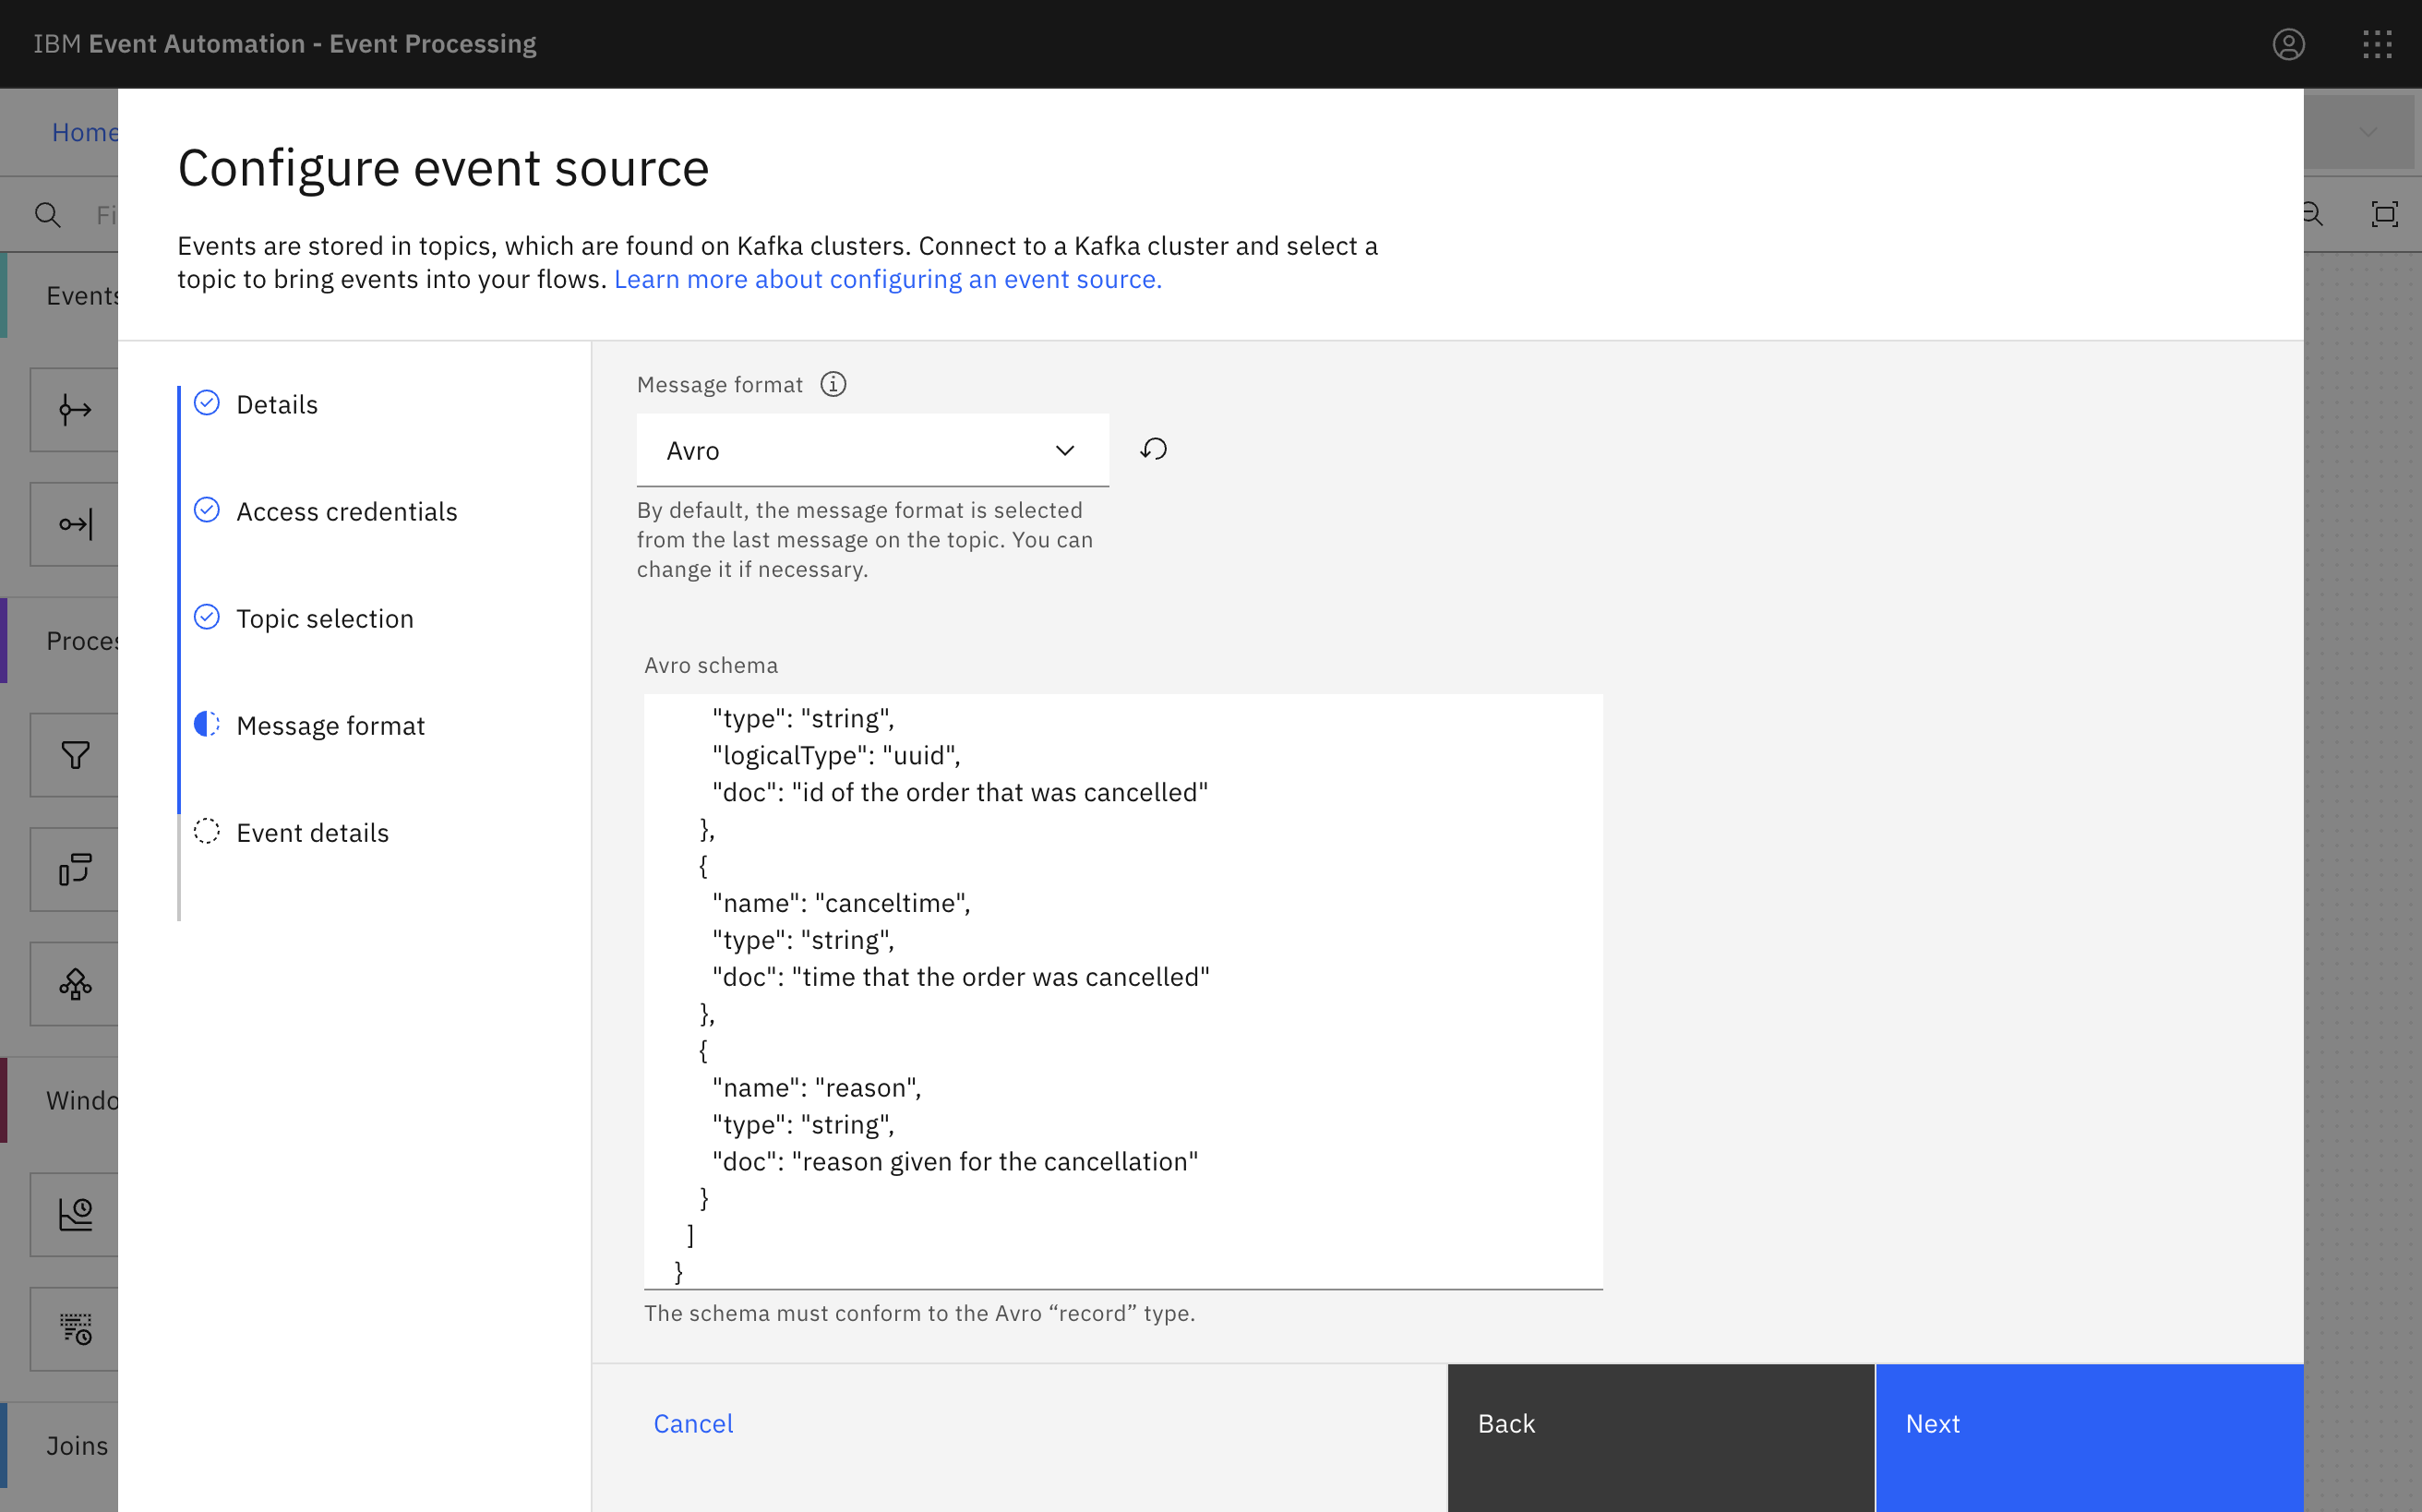
Paste the schema into the event source config in the Avro schema box.
Notice that the message format of
Avrowas automatically detected from the most recent message on the topic.Click Next.
-
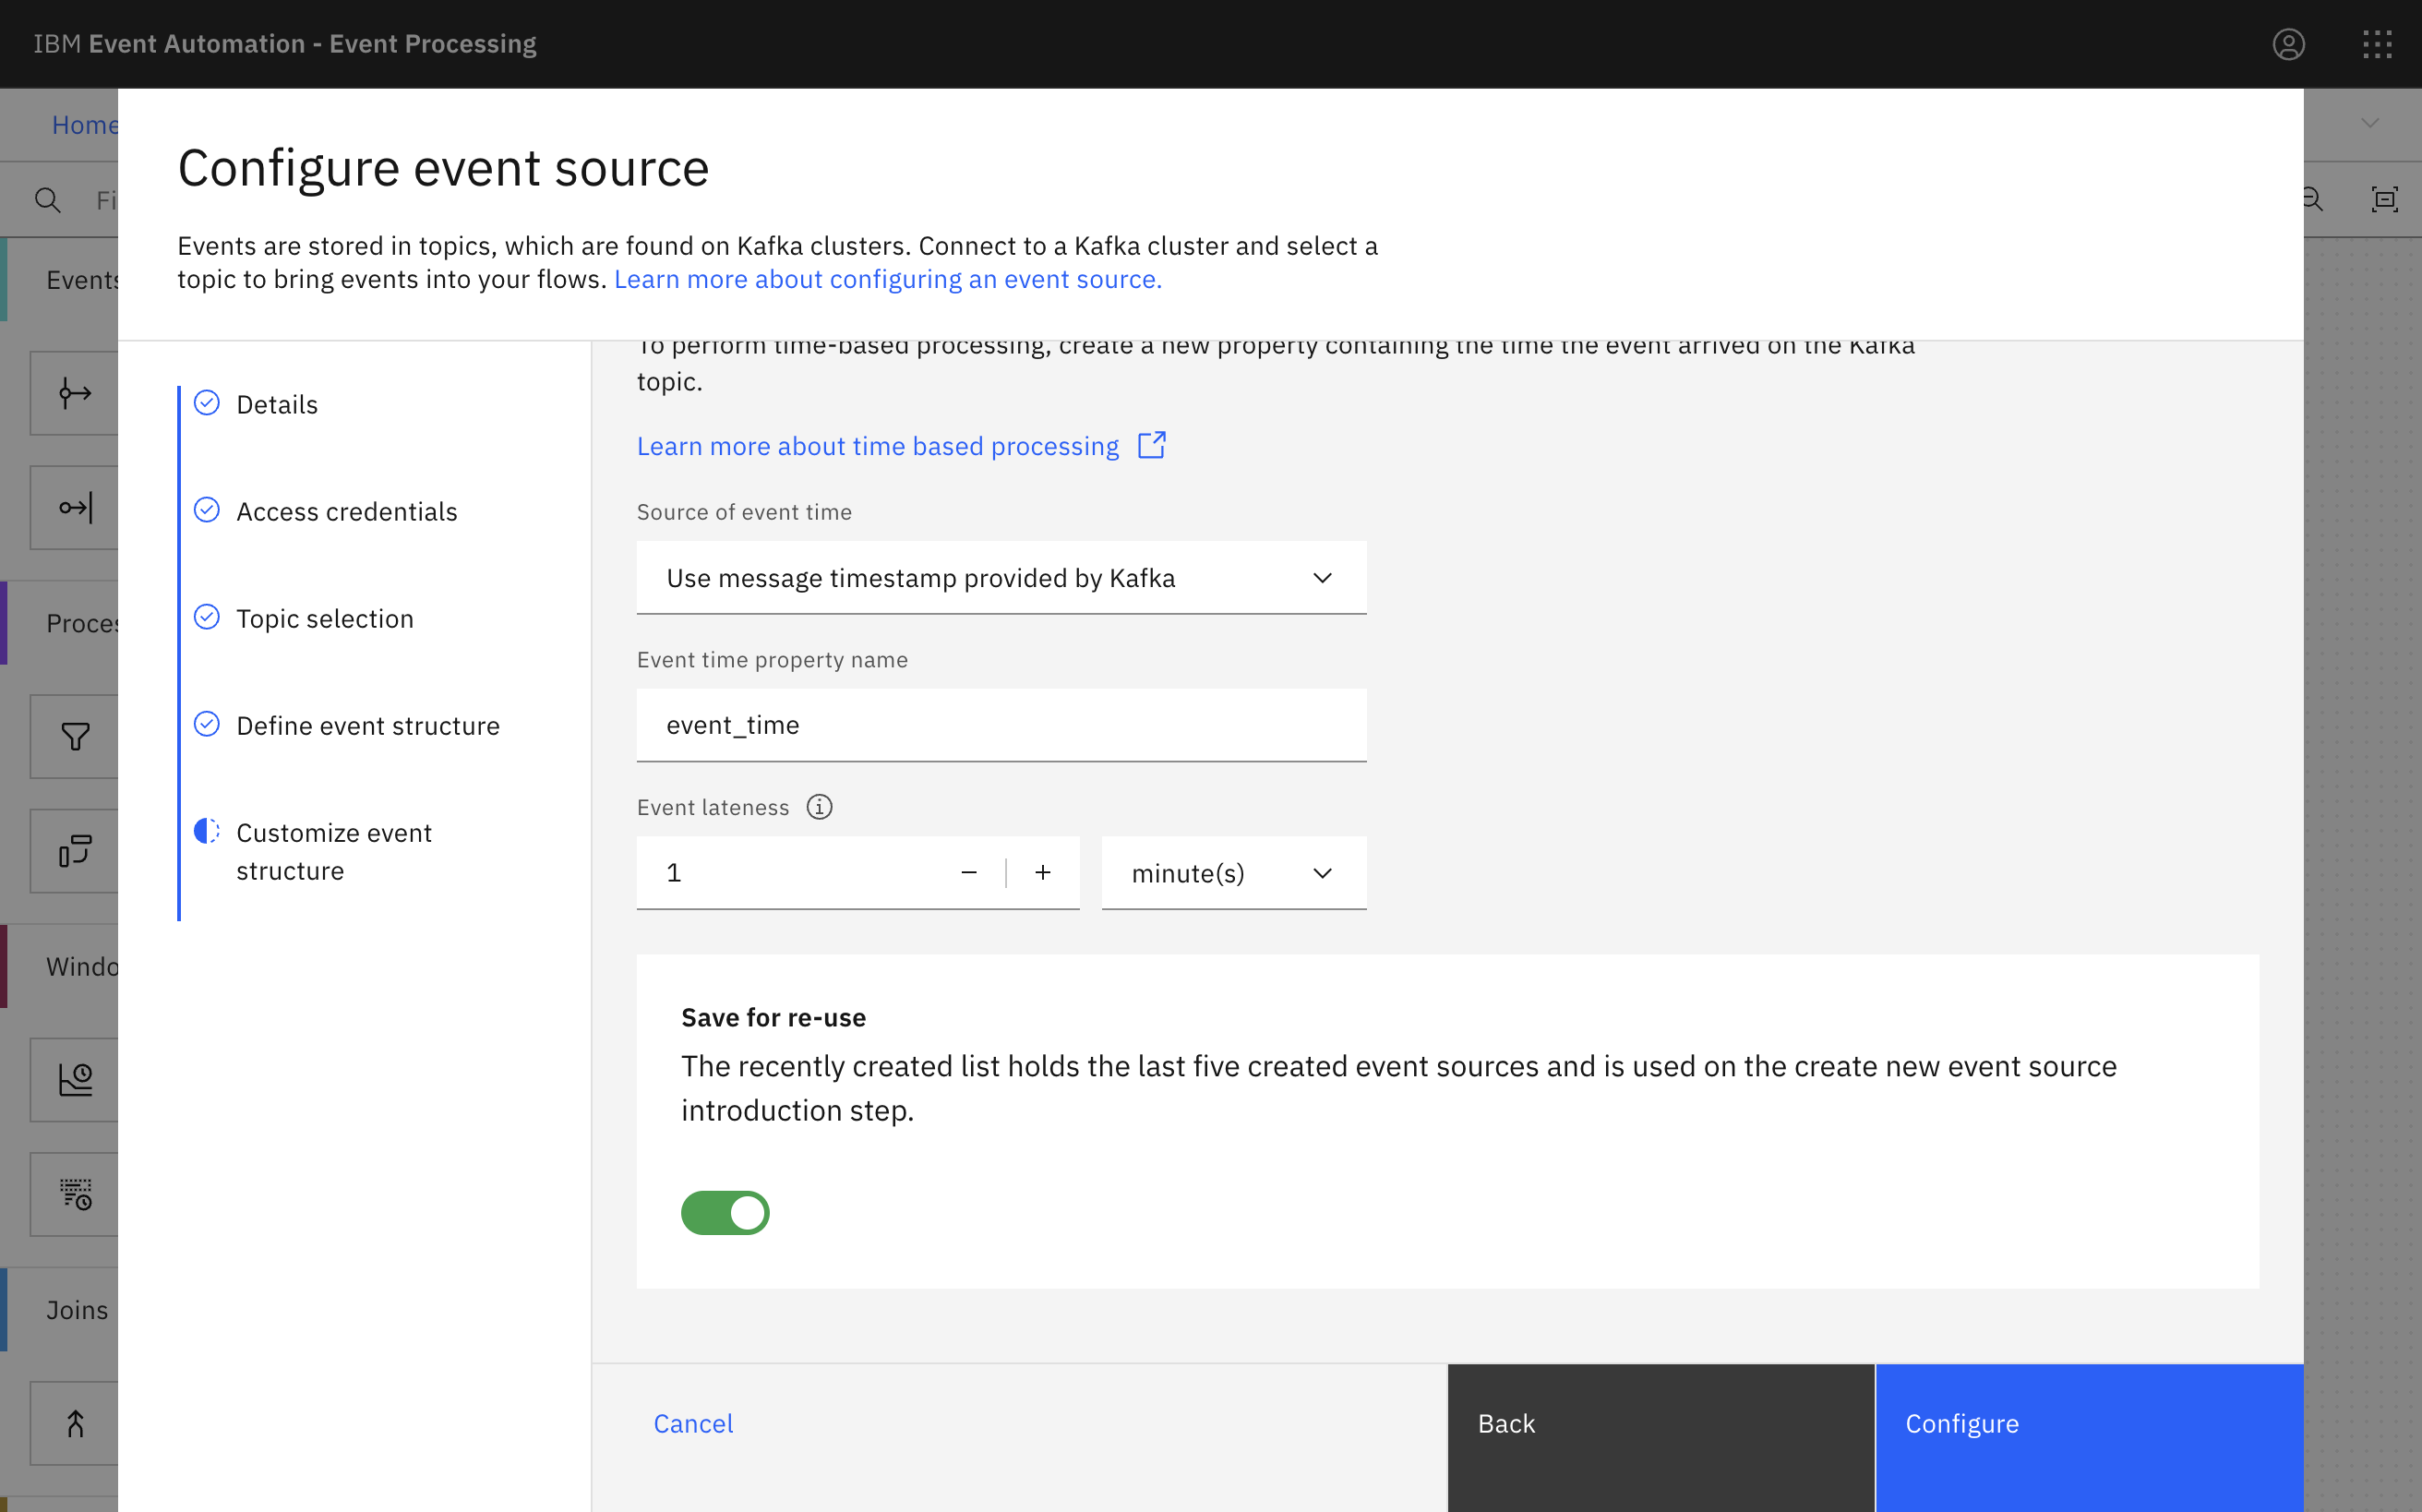
Leave the event source to be saved for later reuse.
Tip: Saving the connection details makes the later steps in the tutorial that use this same topic quicker. It avoids you needing to enter these details again.
-
Click Configure to finalize the event source.
Step 7: Join the two streams
The next step is to specify how to correlate the large orders with the cancellations.
-
Add an Interval join node and link it to the two streams.
Create an interval join node by dragging one onto the canvas. You can find this in the “Joins” section of the left panel.
Click and drag from the small gray dot on the cancellations event source to the matching dot on the filter node. Do the same for the large orders filter node.
Hover over the join node and click
Edit to configure the node.
-
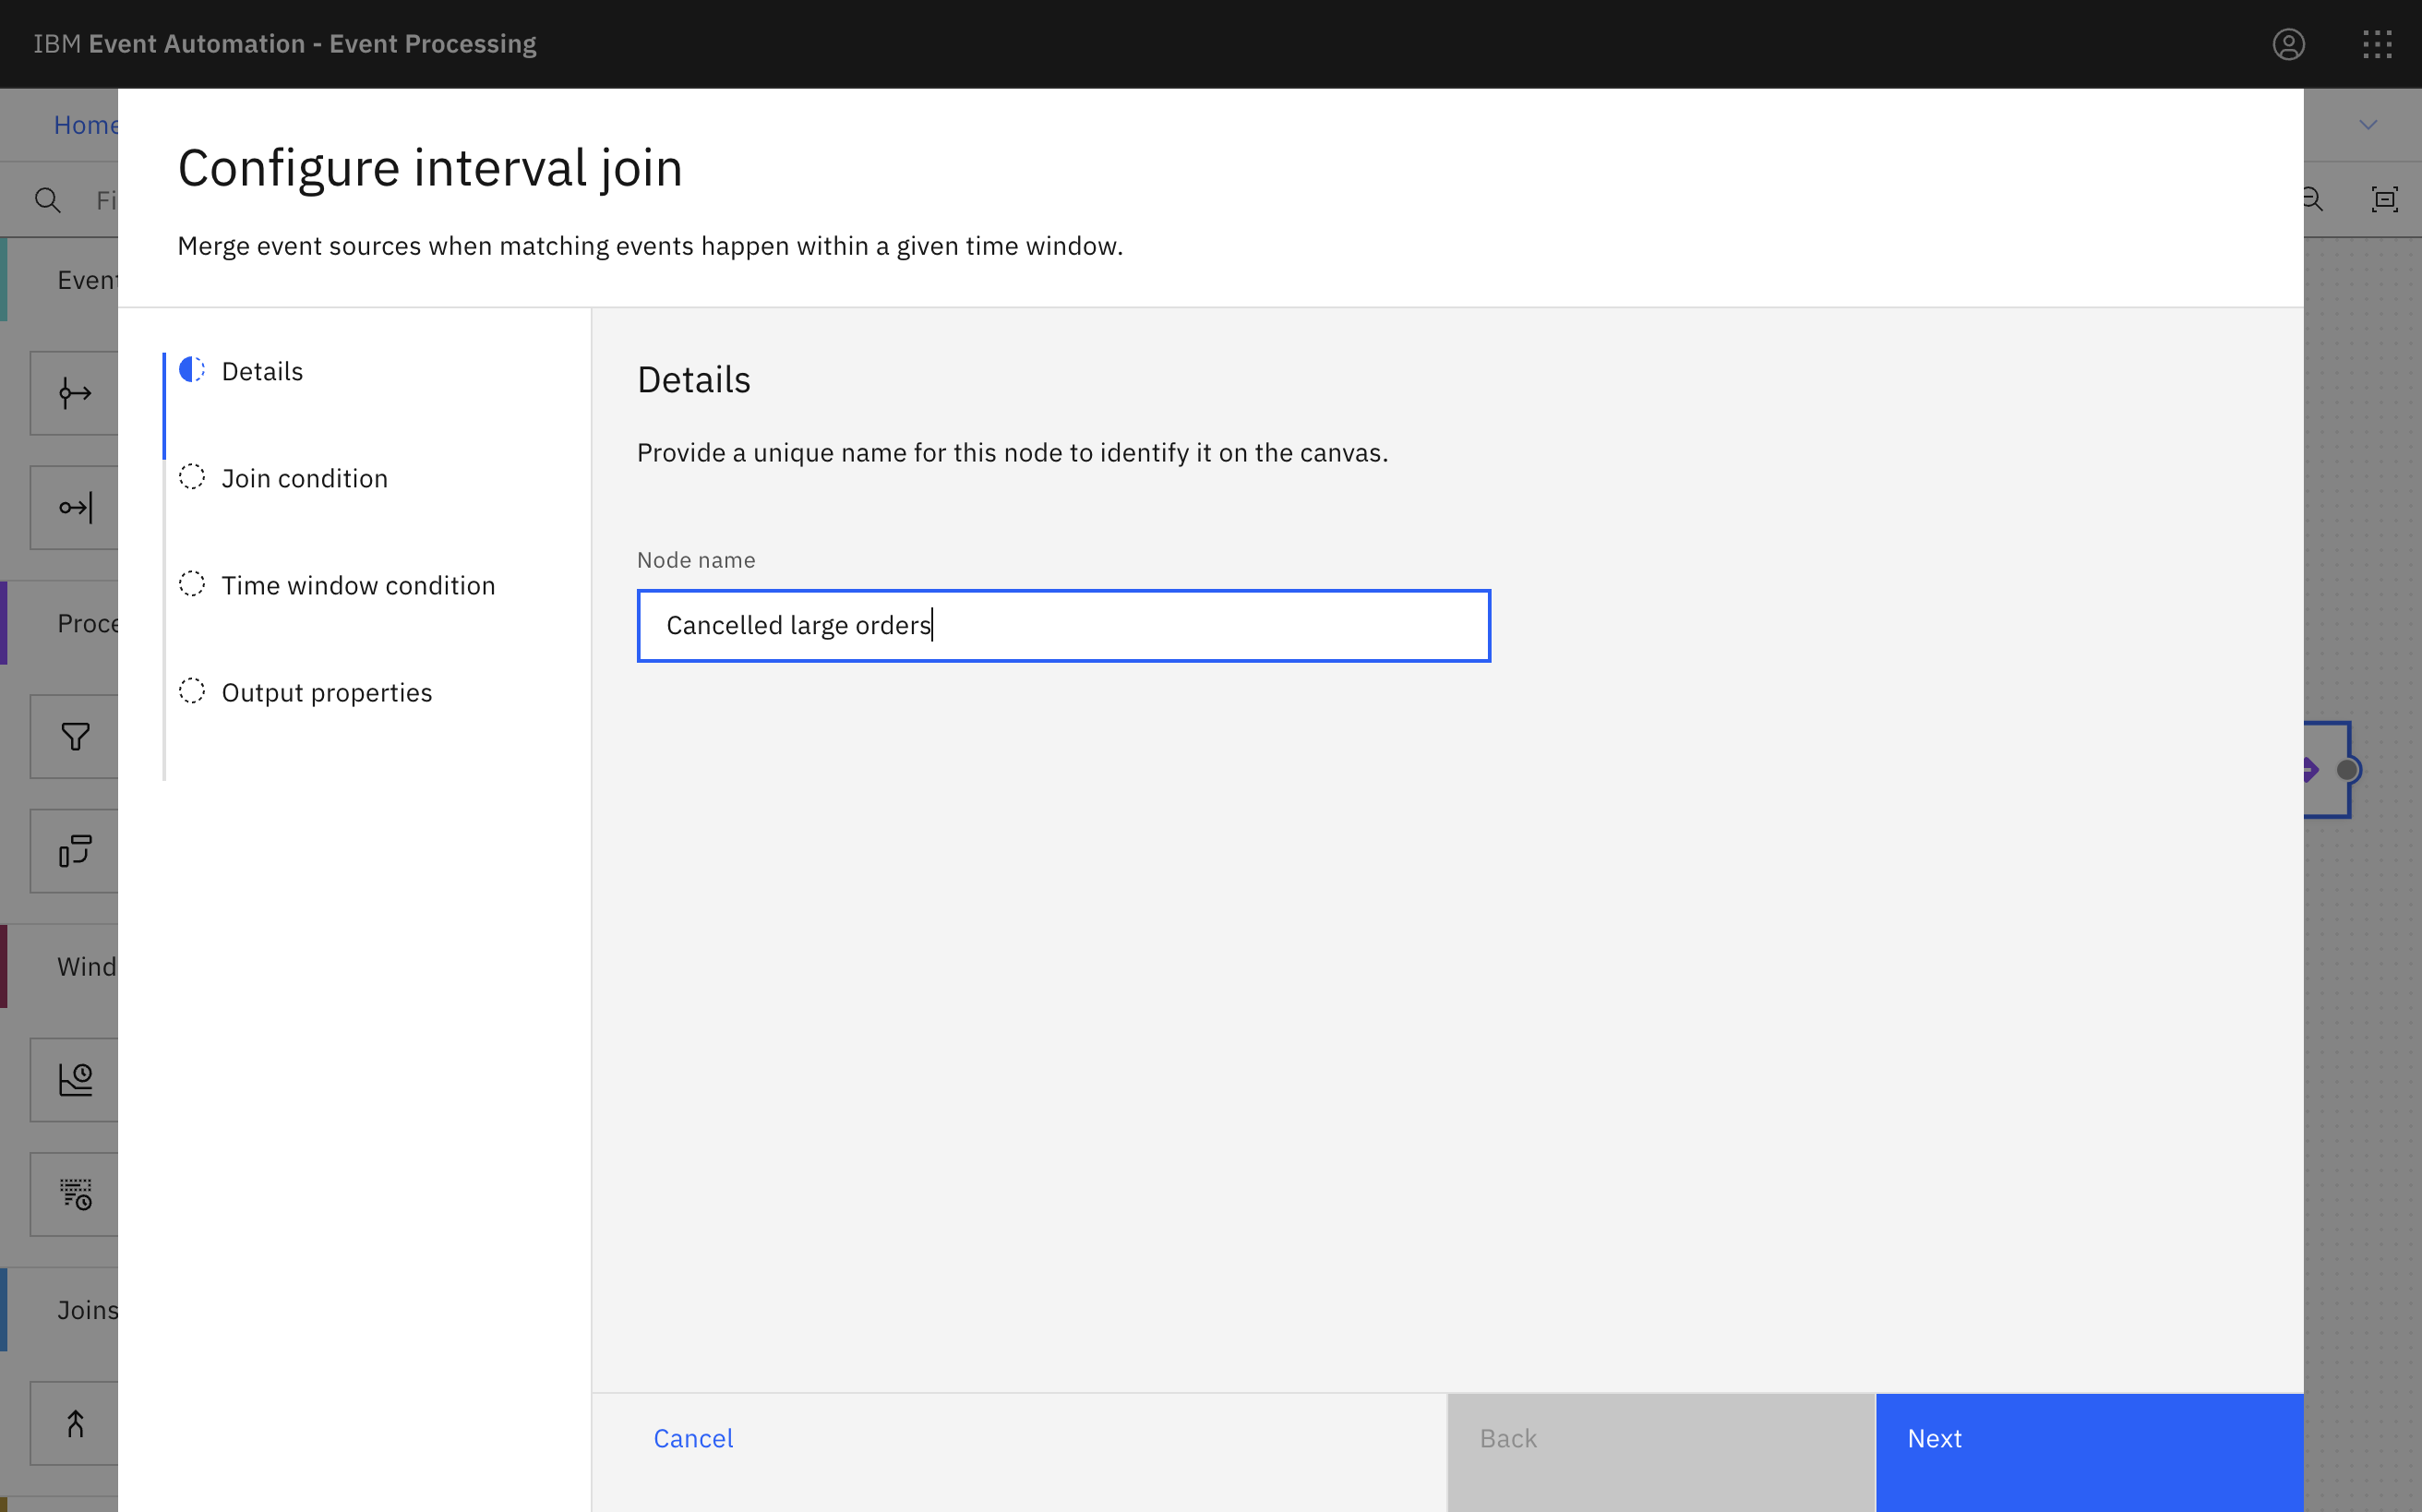
Give the join node a name that describes the events it should identify:
Cancelled large orders. -
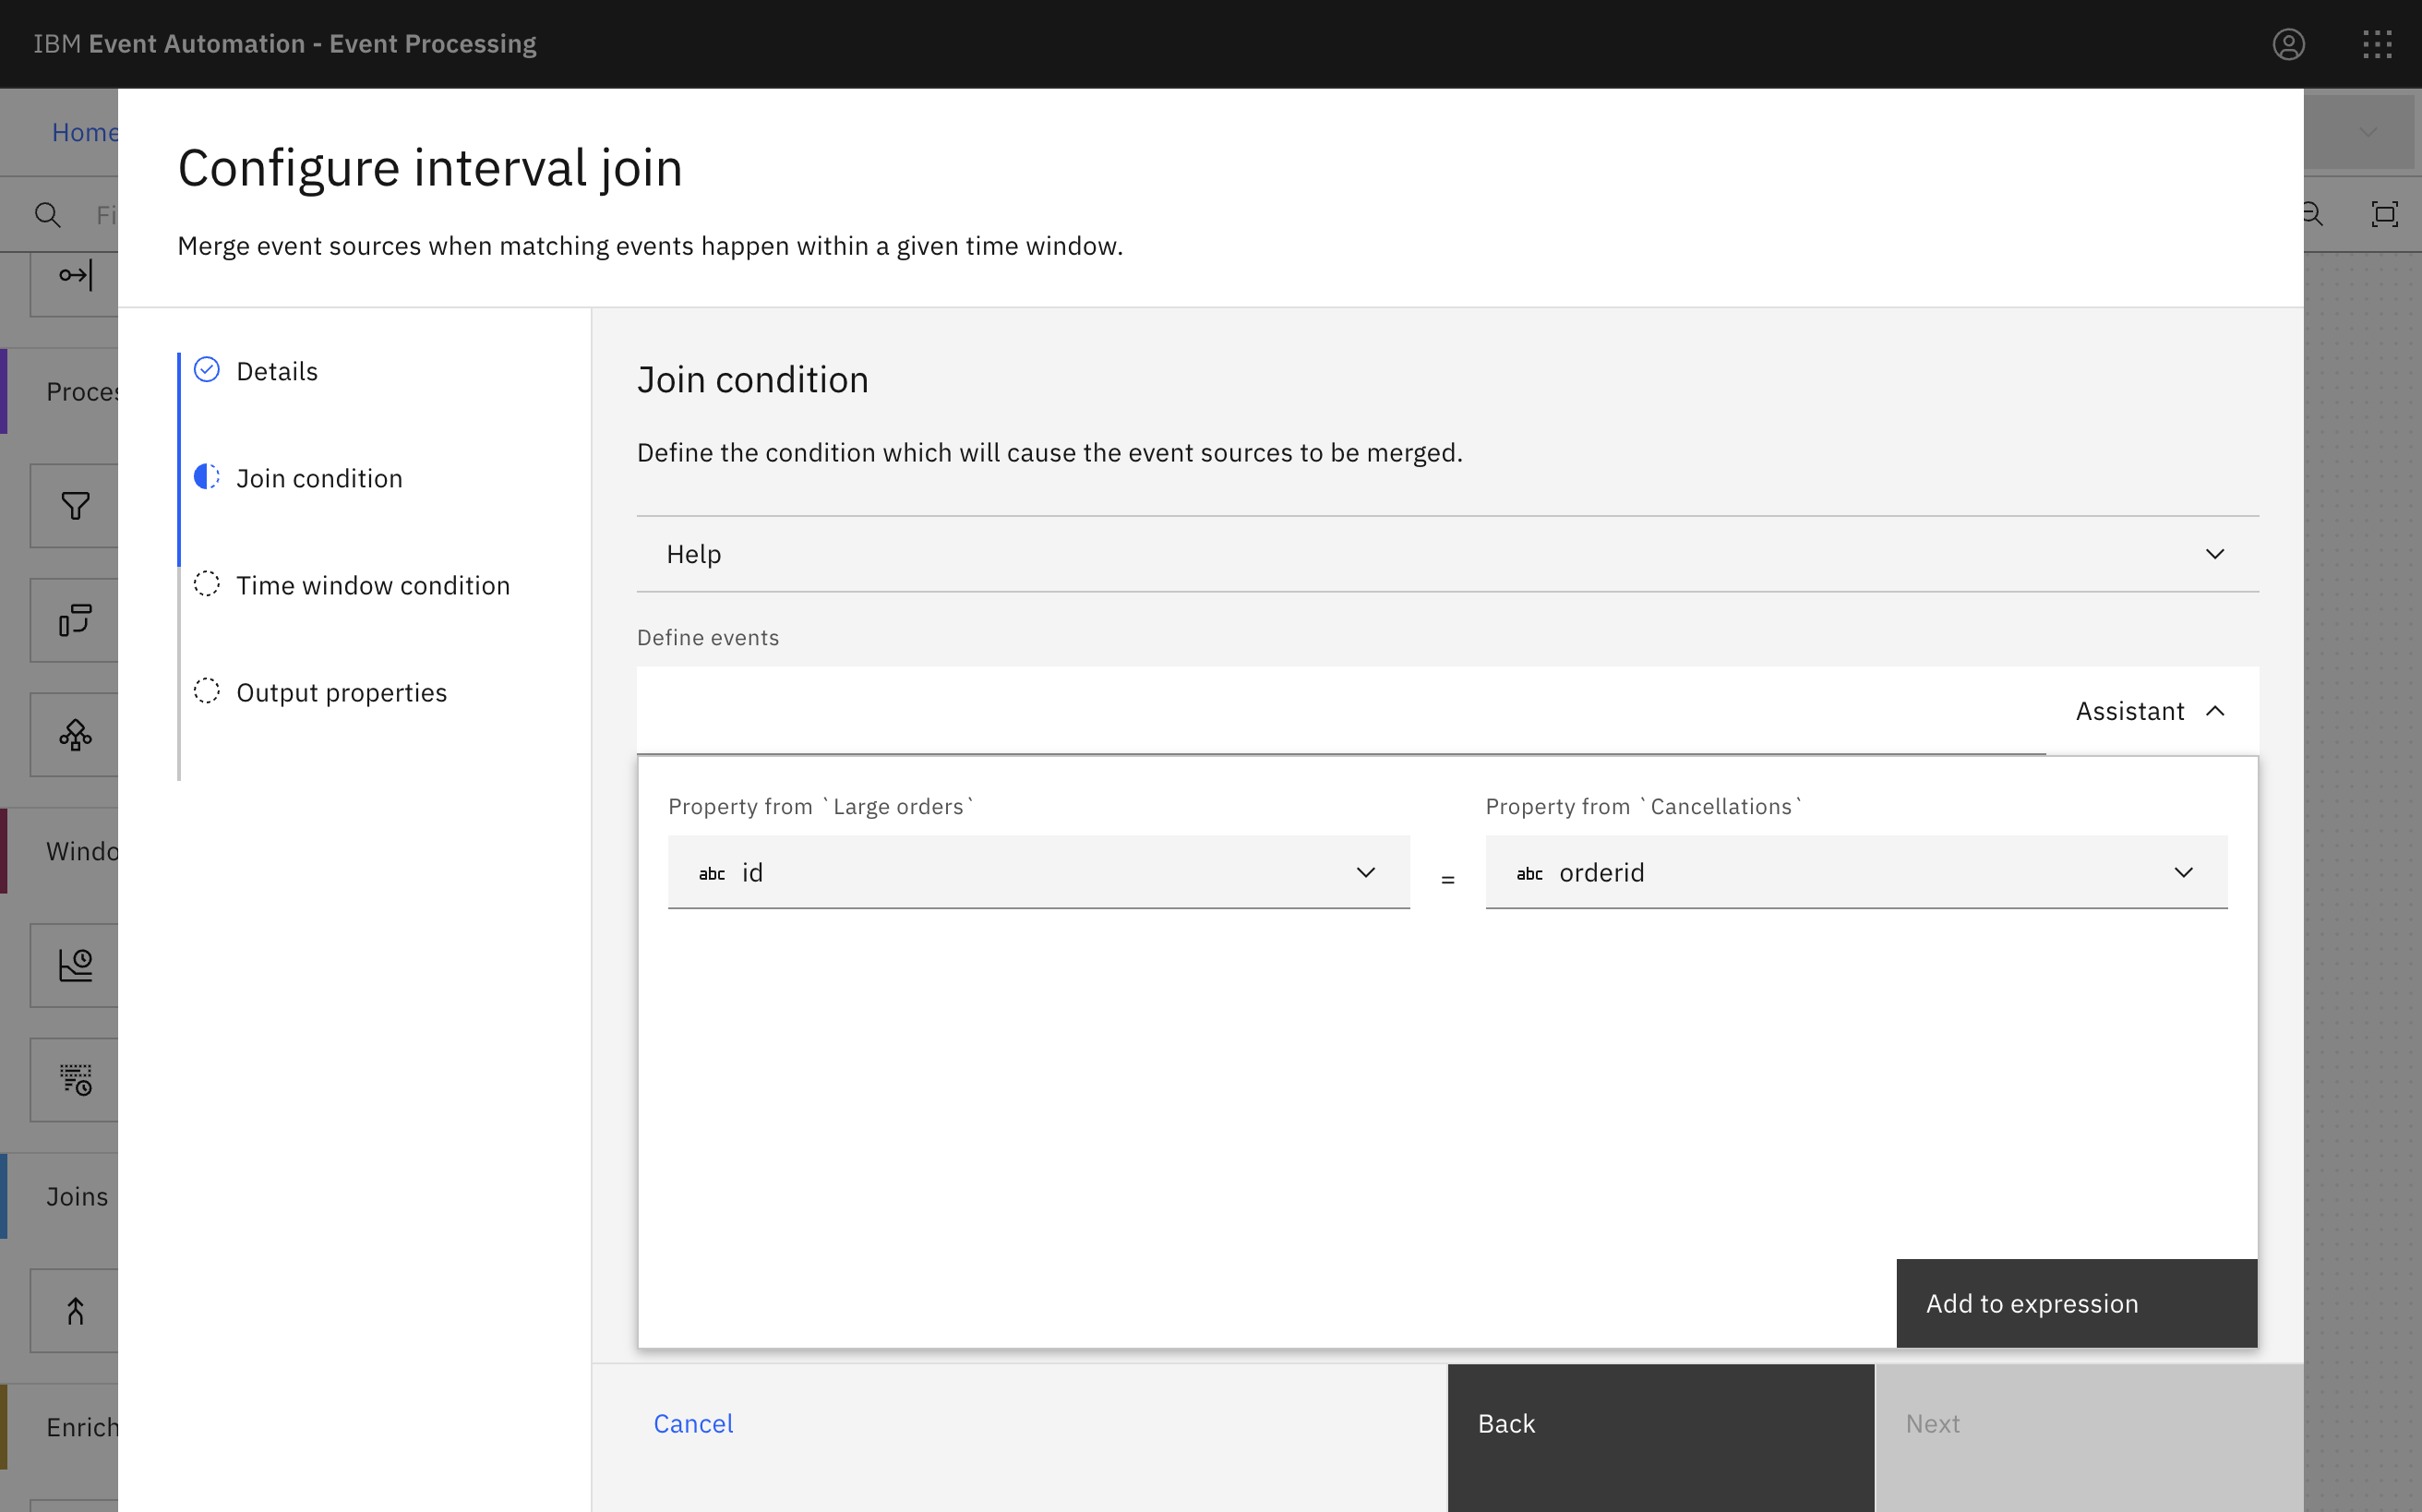
Define the join by matching the
orderidfrom cancellation events with theidfrom order events.Click Add to expression and then click Next.
-
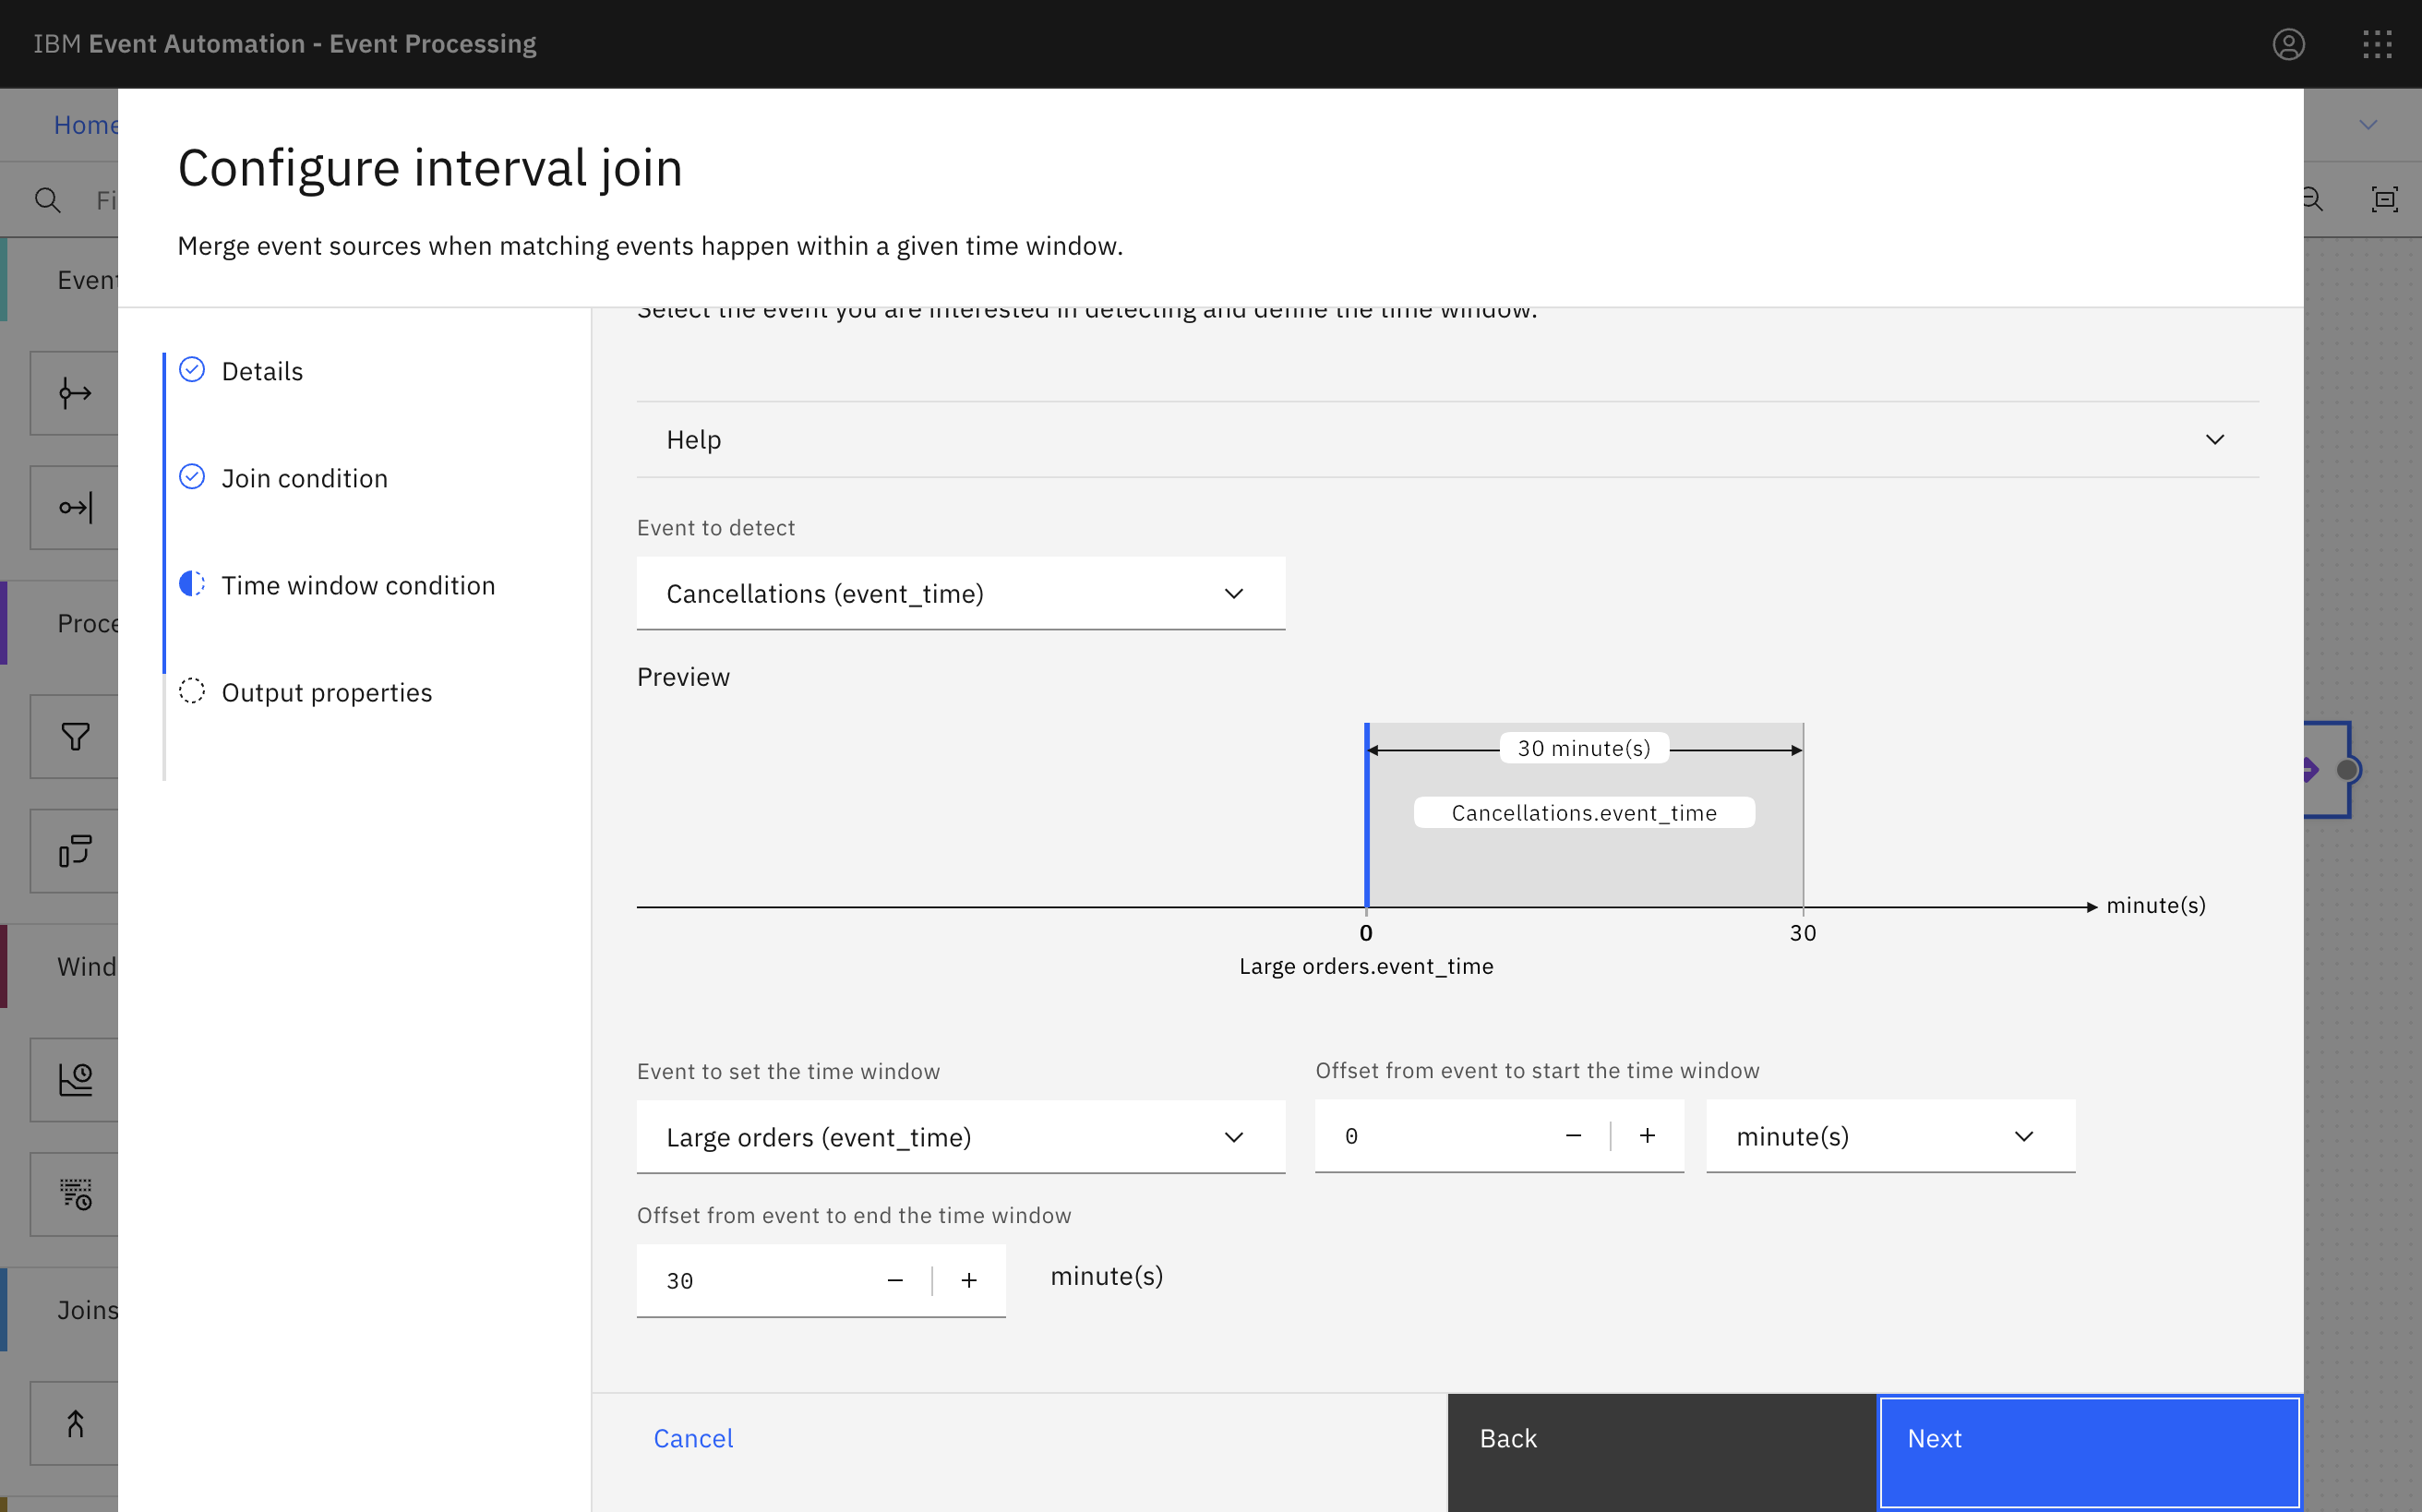
Specify that you are interested in detecting cancellations that are made within 30 minutes of the (large) order.
-
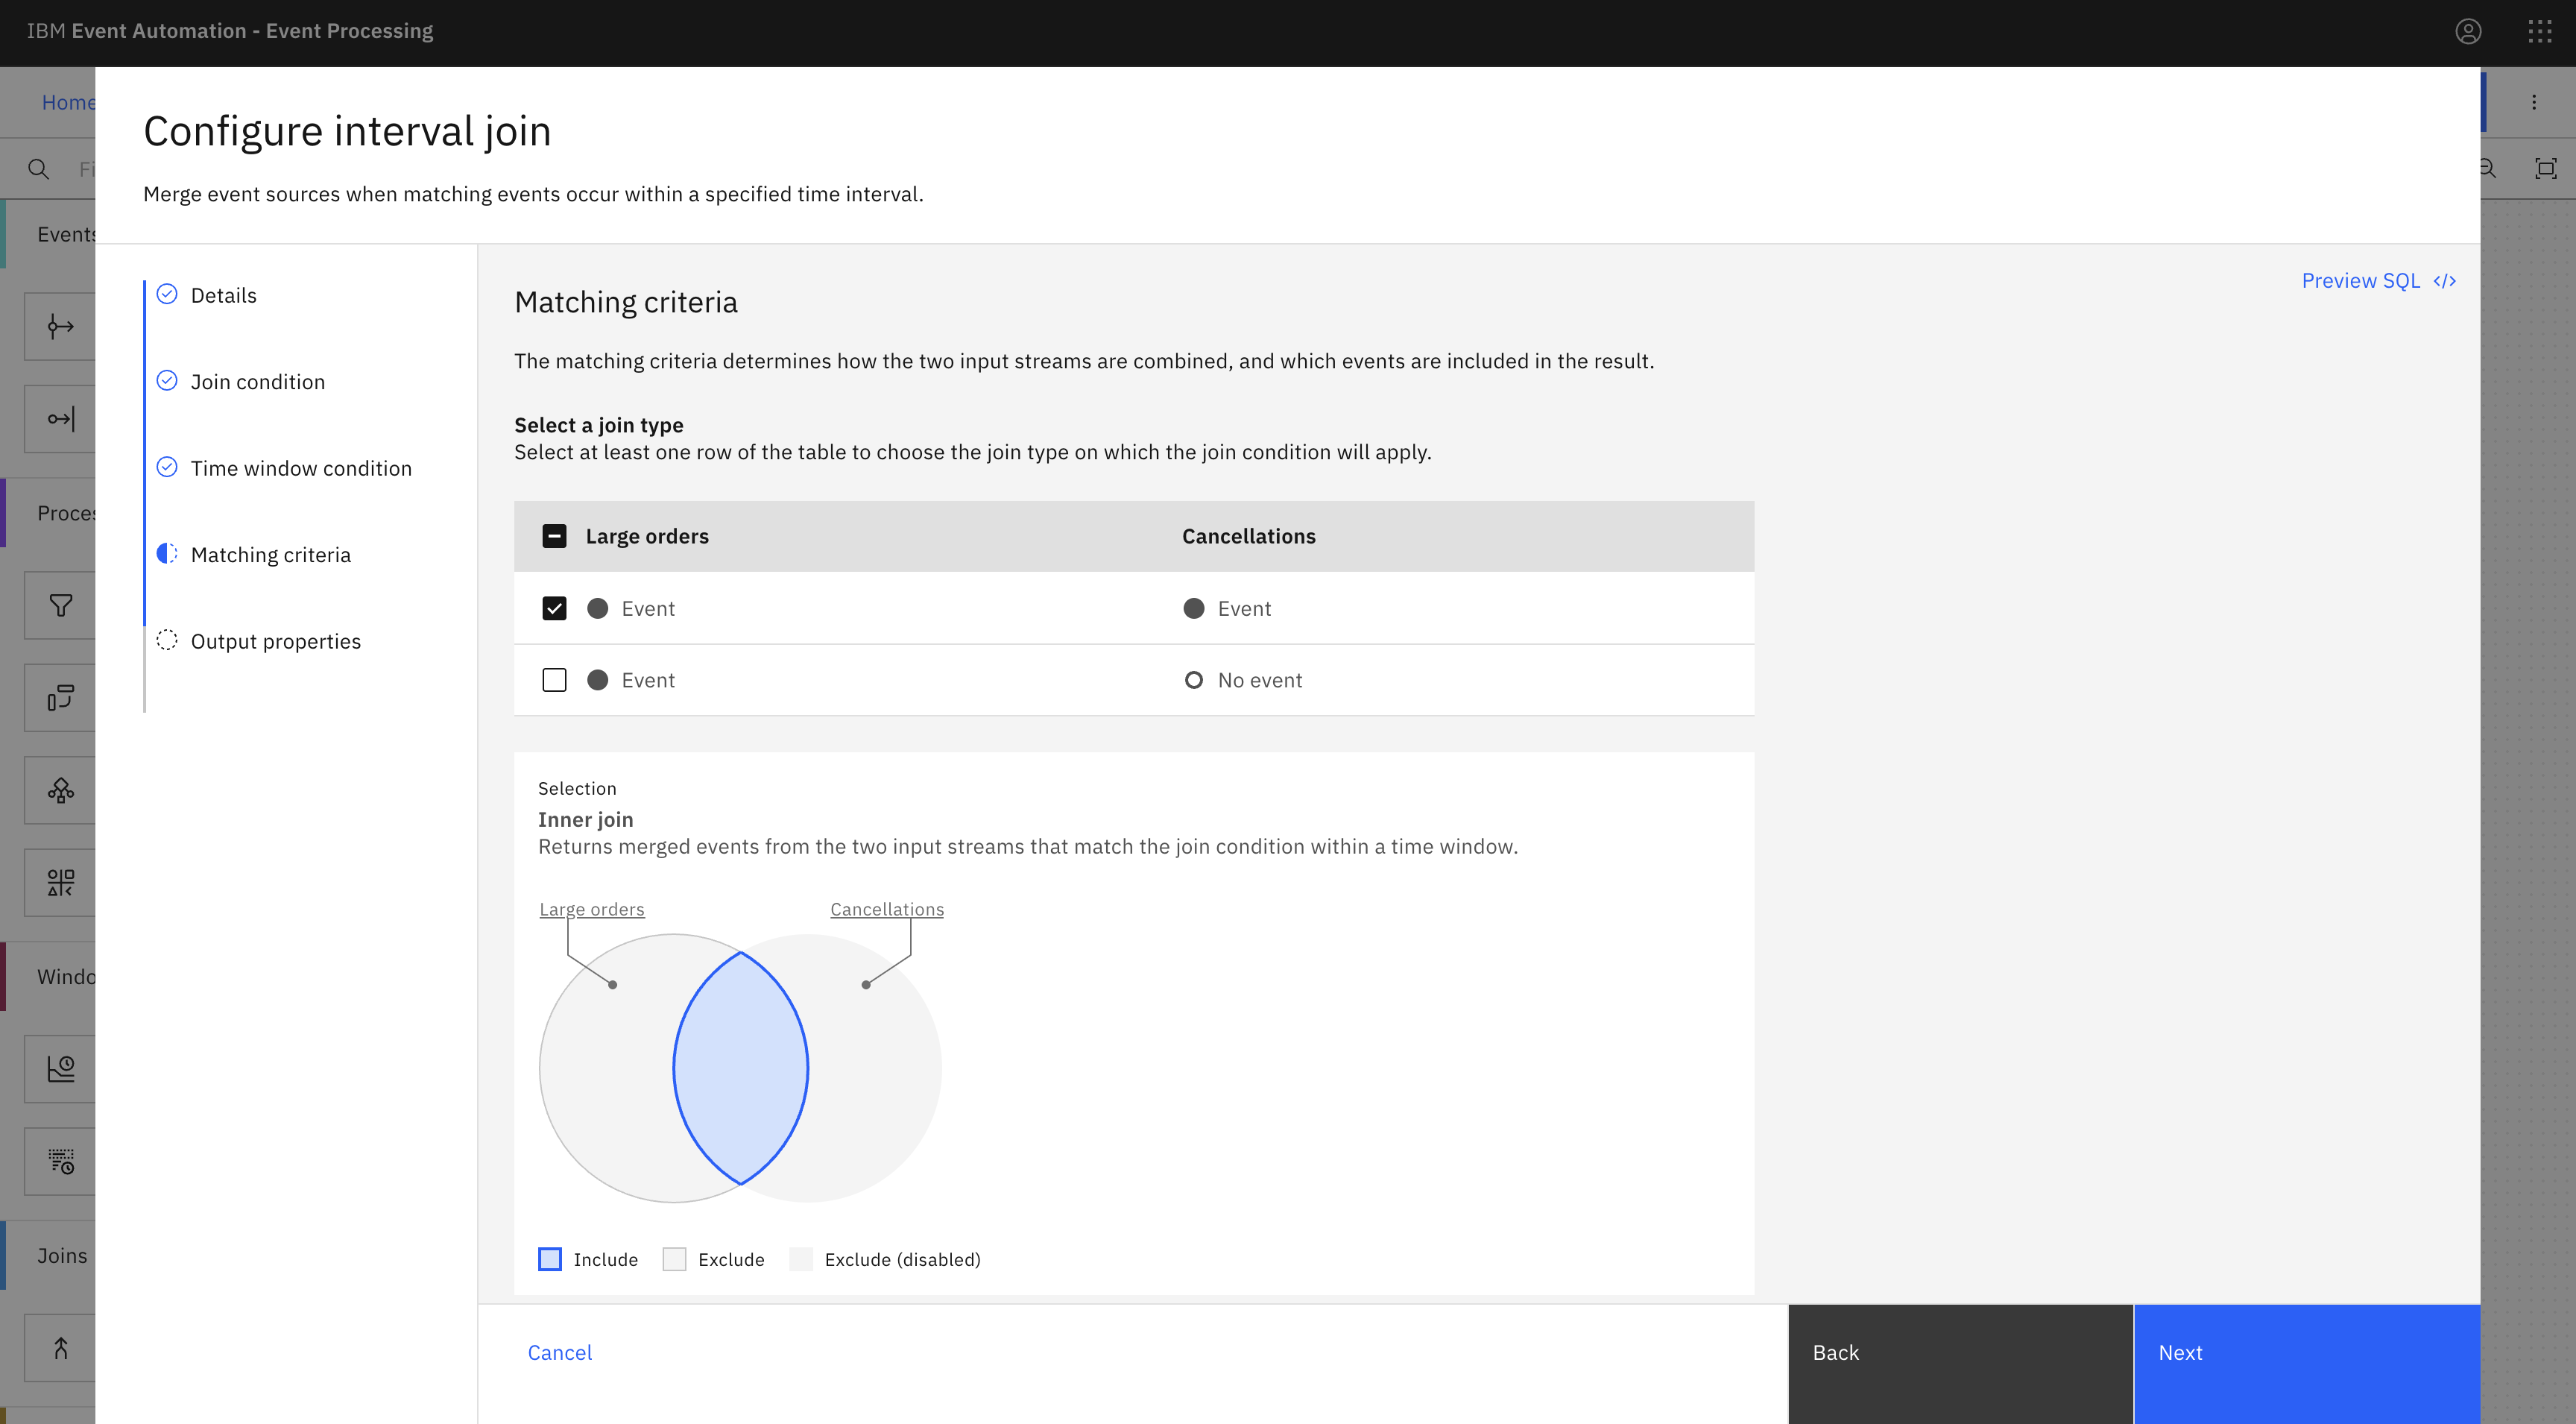
Specify how you want to join the small orders and cancelled large orders. Several types of joins exist, however in this tutorial, select an inner join to merge the large orders events and the cancellations orders events that match the join condition (that is, with the same order ID).
-
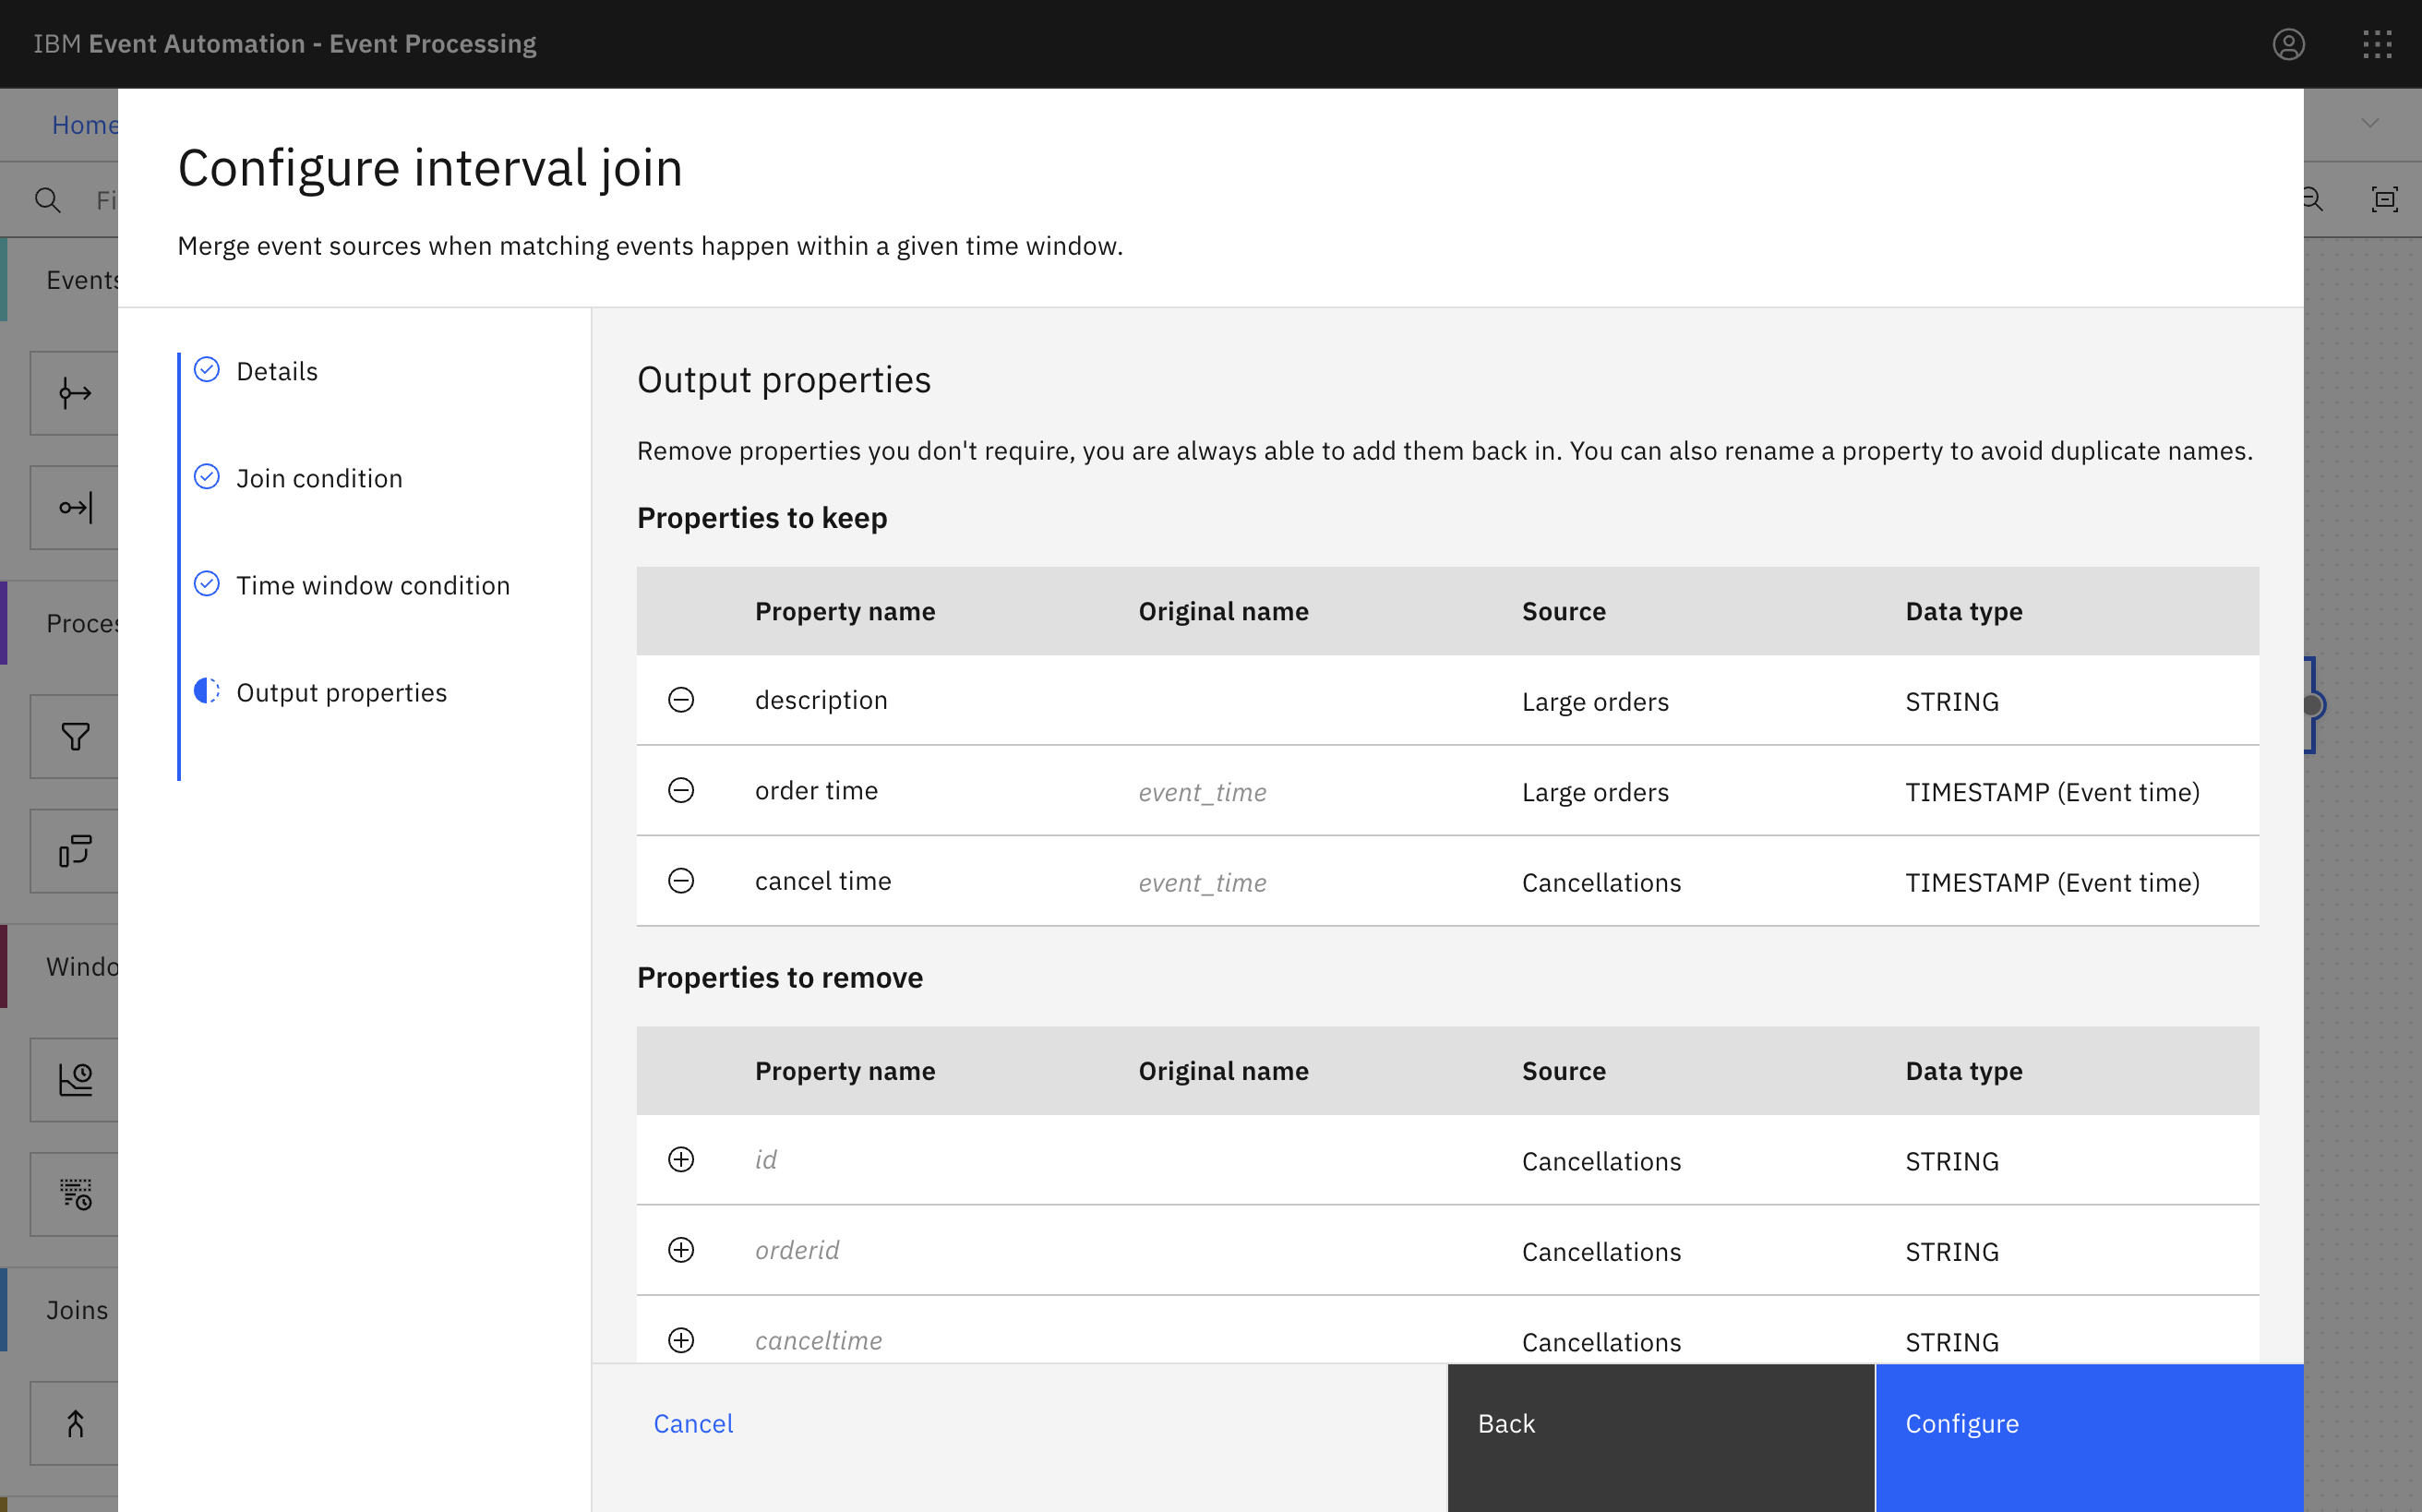
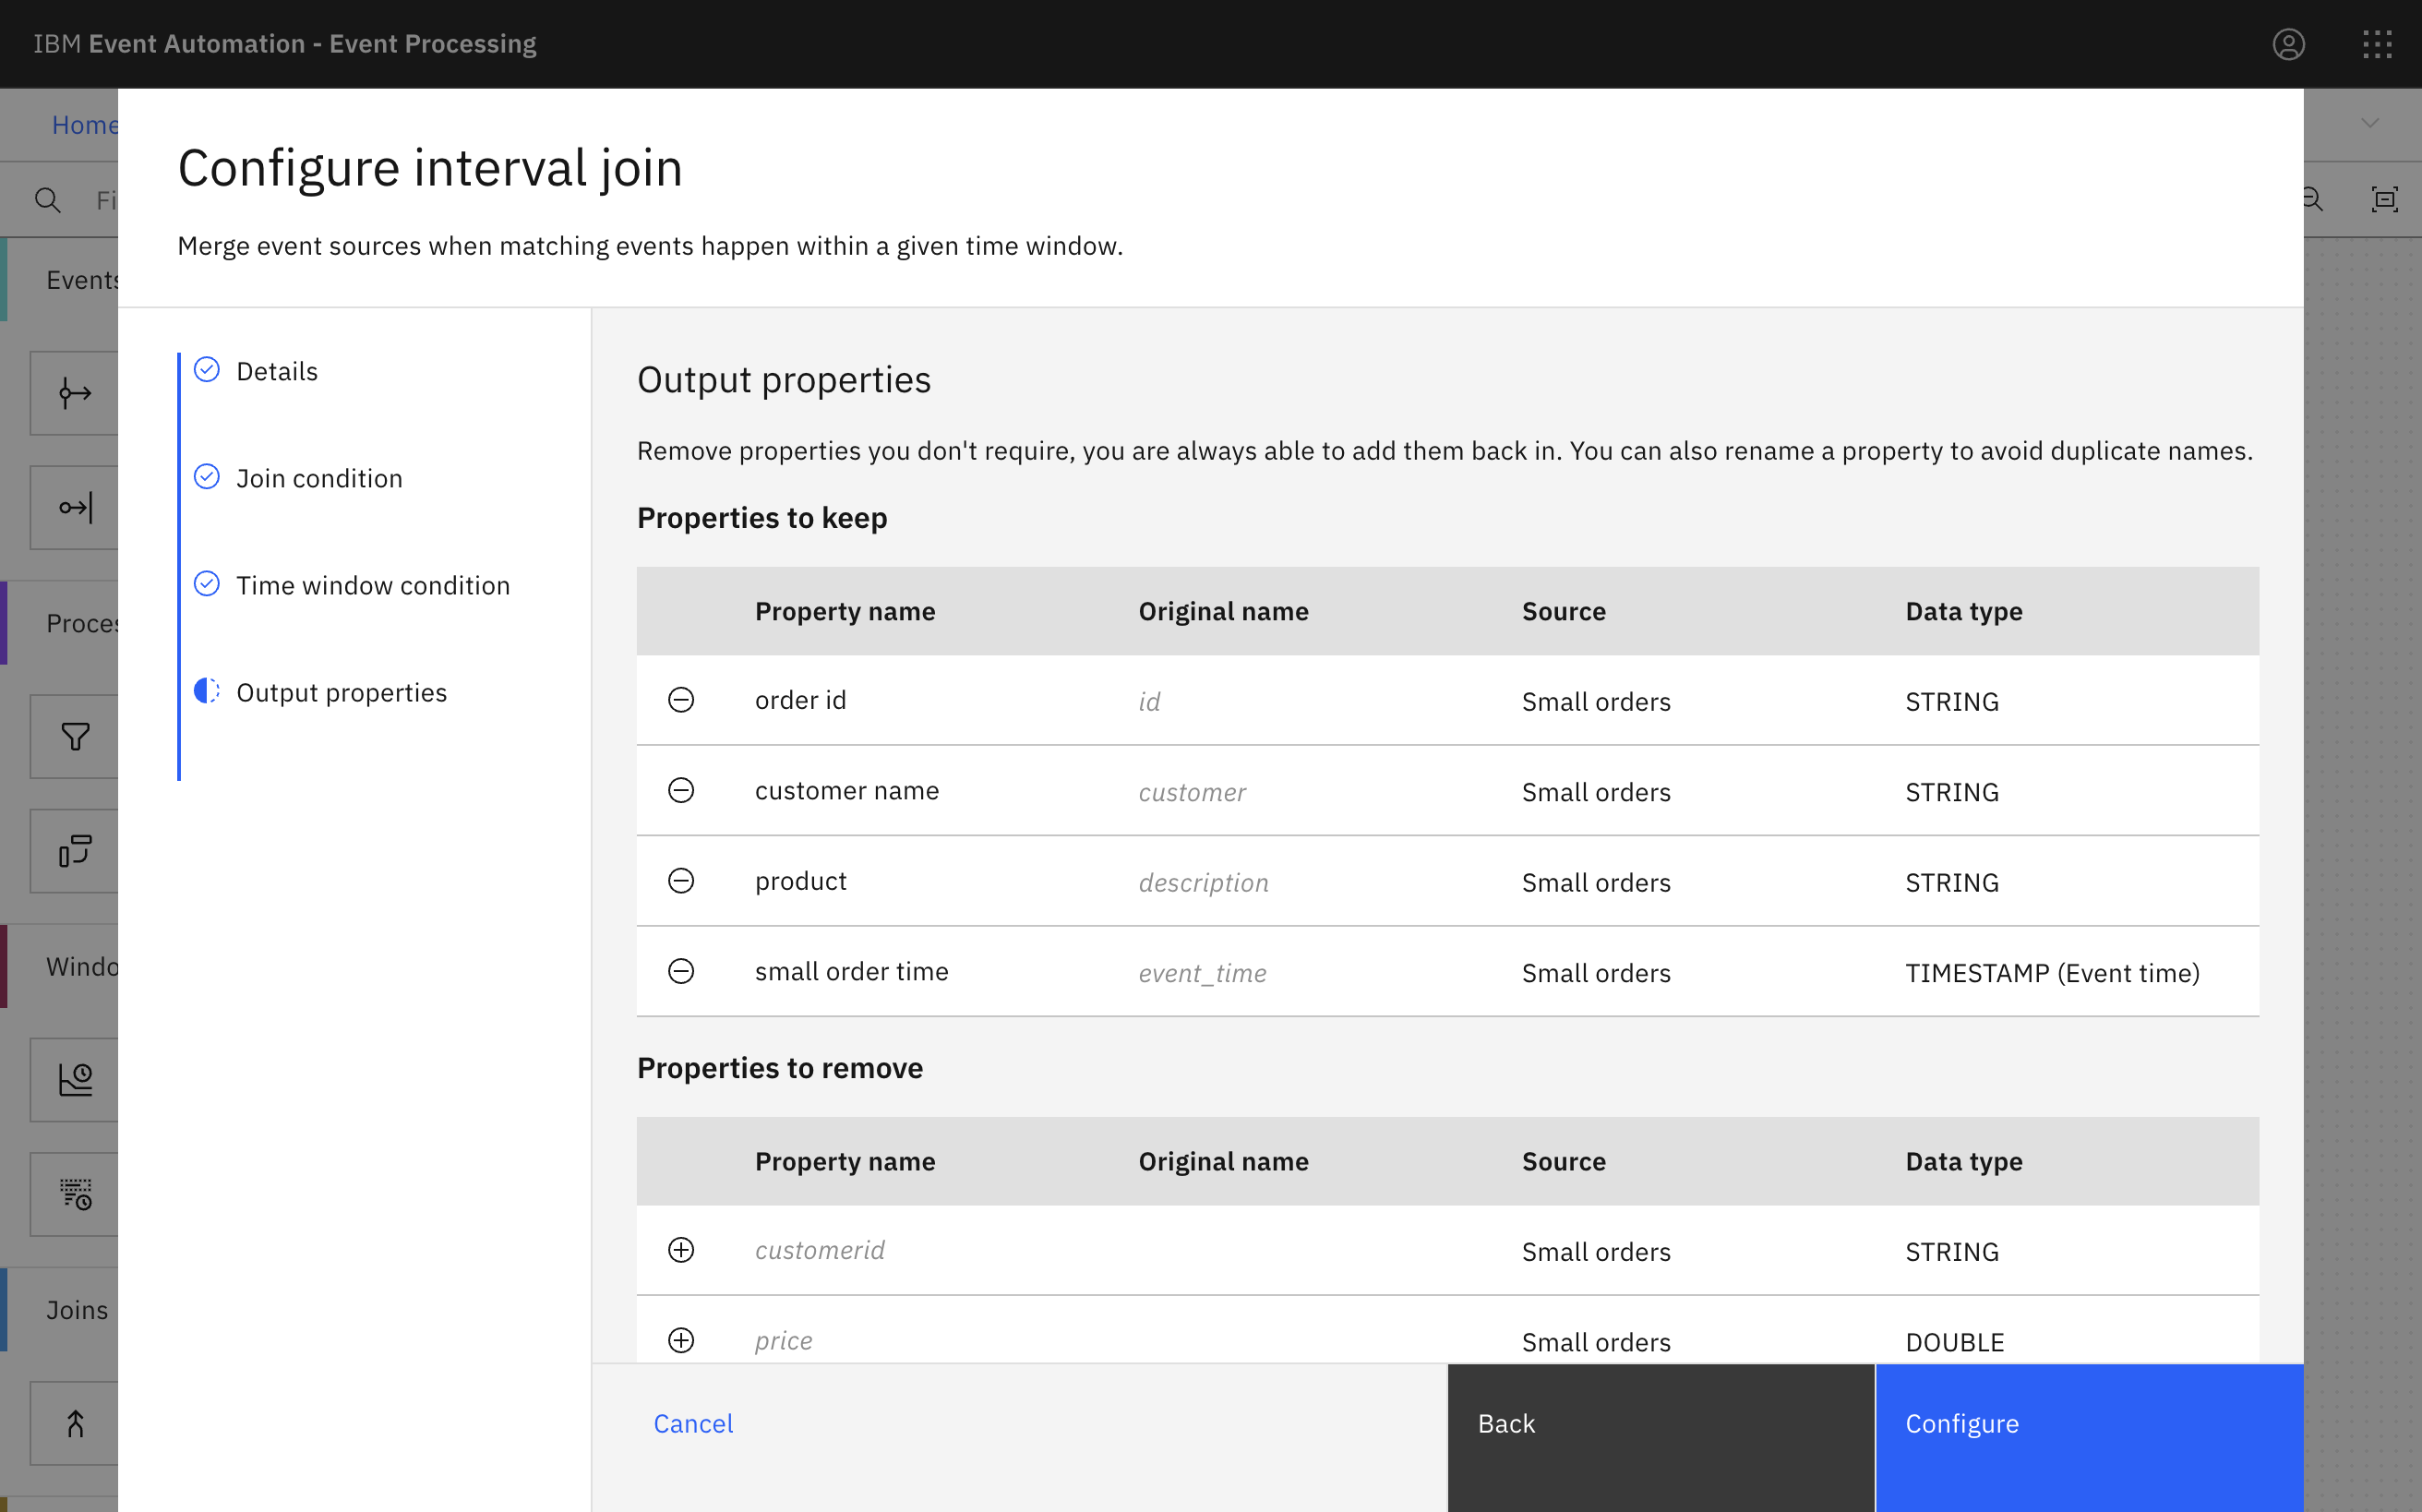
Remove the properties that we do not need to simplify the output. We only need to know when it happened, and what product was cancelled.
Keep the
descriptionproperty.Keep the two “Event time” properties - both are called
event_time. Rename them to make them unique, and to explain what they are.Tip: Renaming properties to explain what they mean in your joined stream makes the output easier to use. For this join, instead of having two properties called “event_time”, naming them “order time” and “cancel time” makes the meaning clearer.
-
Click Configure to finalize the join.
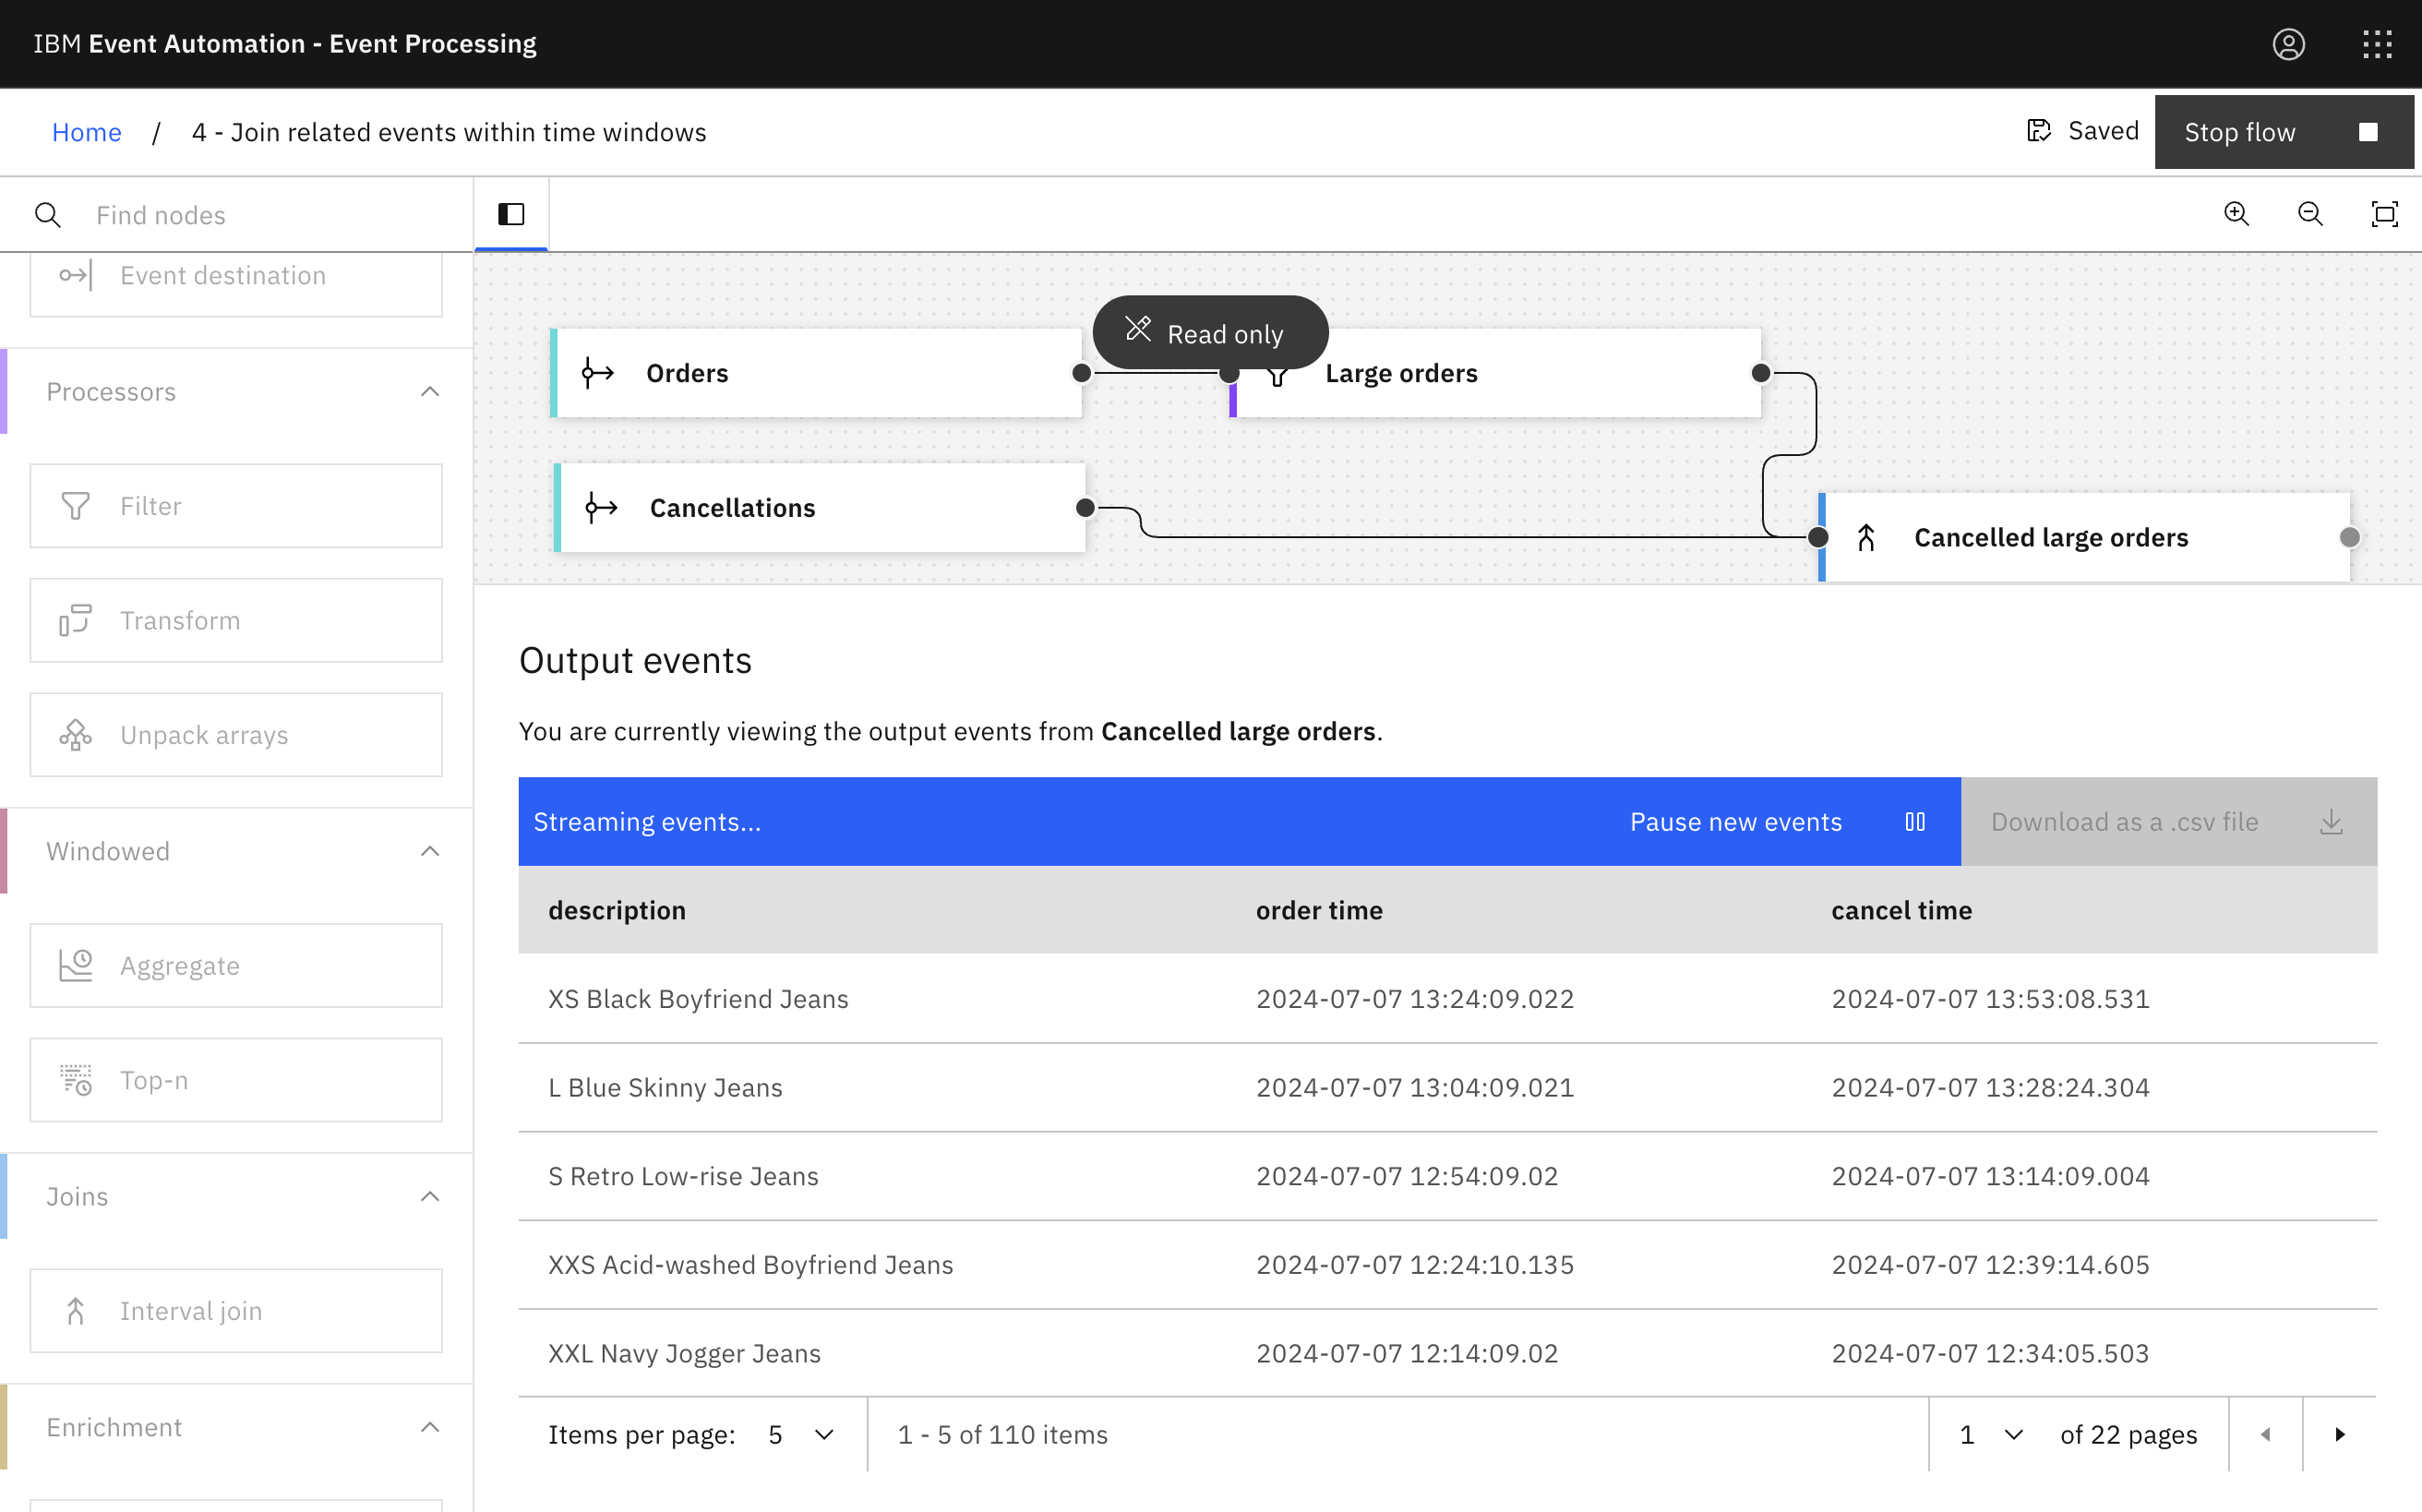
Step 8: Test the flow
The next step is to test your event processing flow and view the results.
When you have finished reviewing the results, you can stop this flow.
Step 9: Identify small orders
The next step is identify small orders (that we will later correlate with the cancelled large orders).
-
Add a Filter node to the flow and link it to the order events.
-
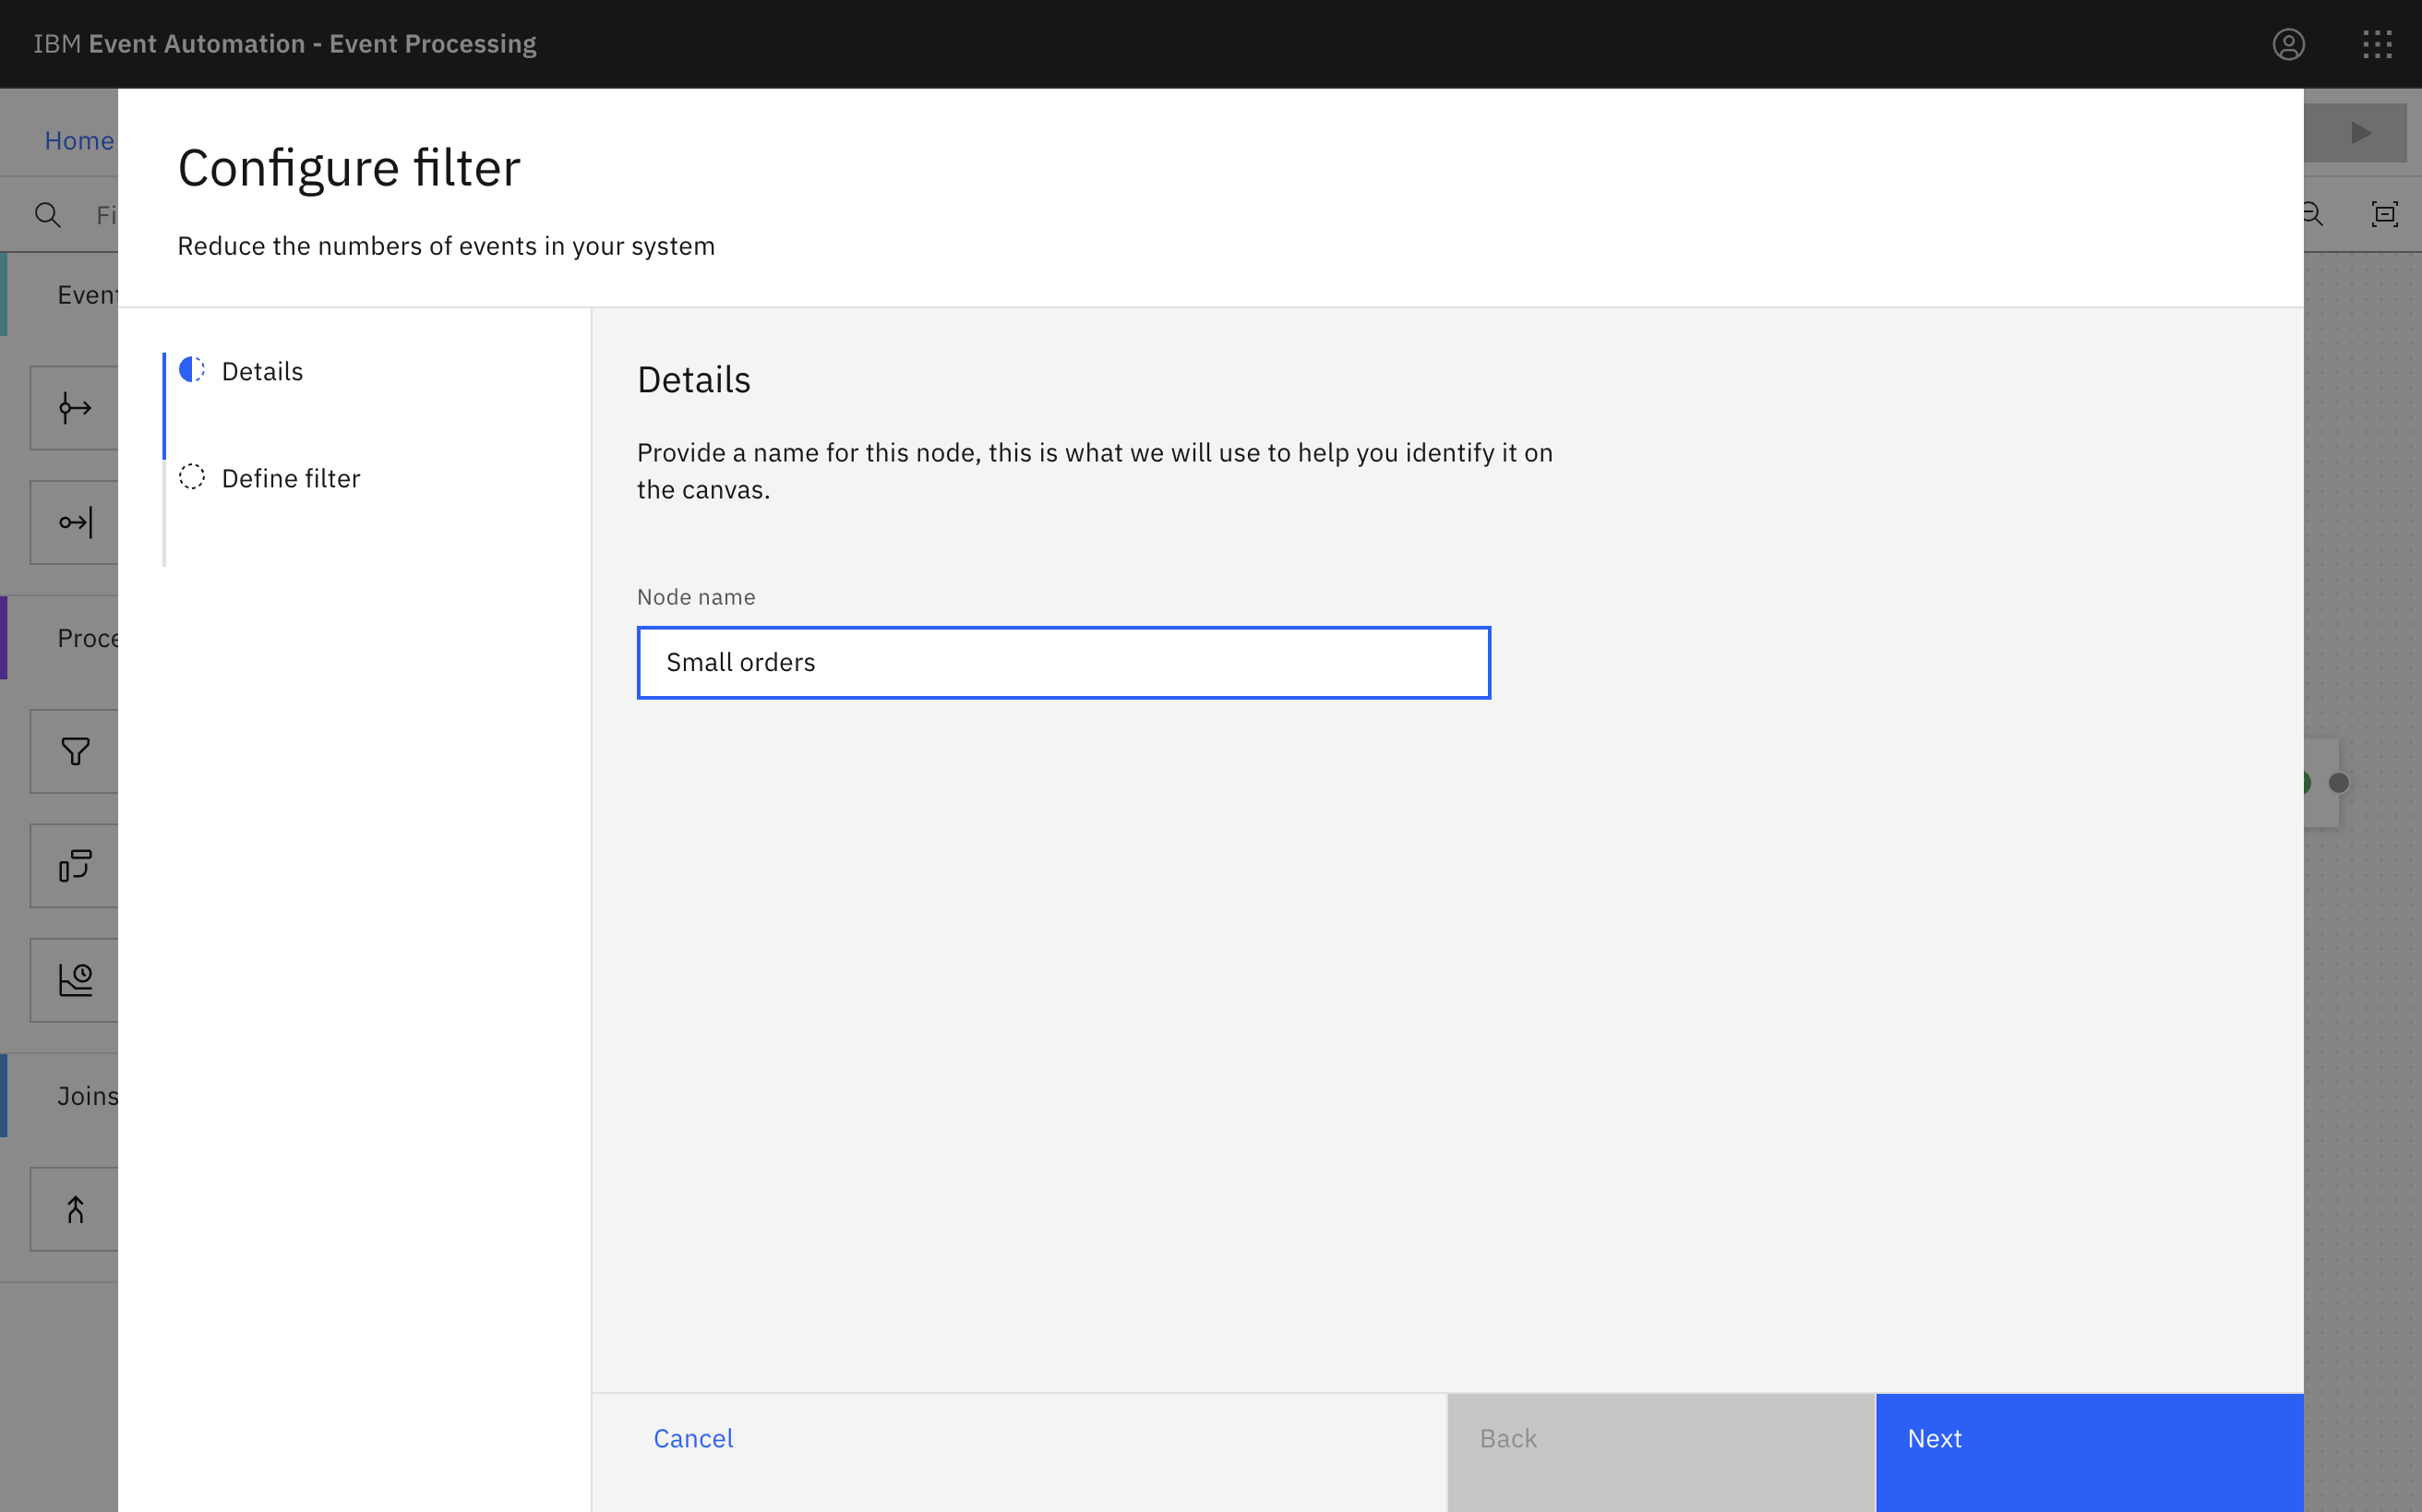
Give the filter node a name that describes the events it should identify:
Small orders. -
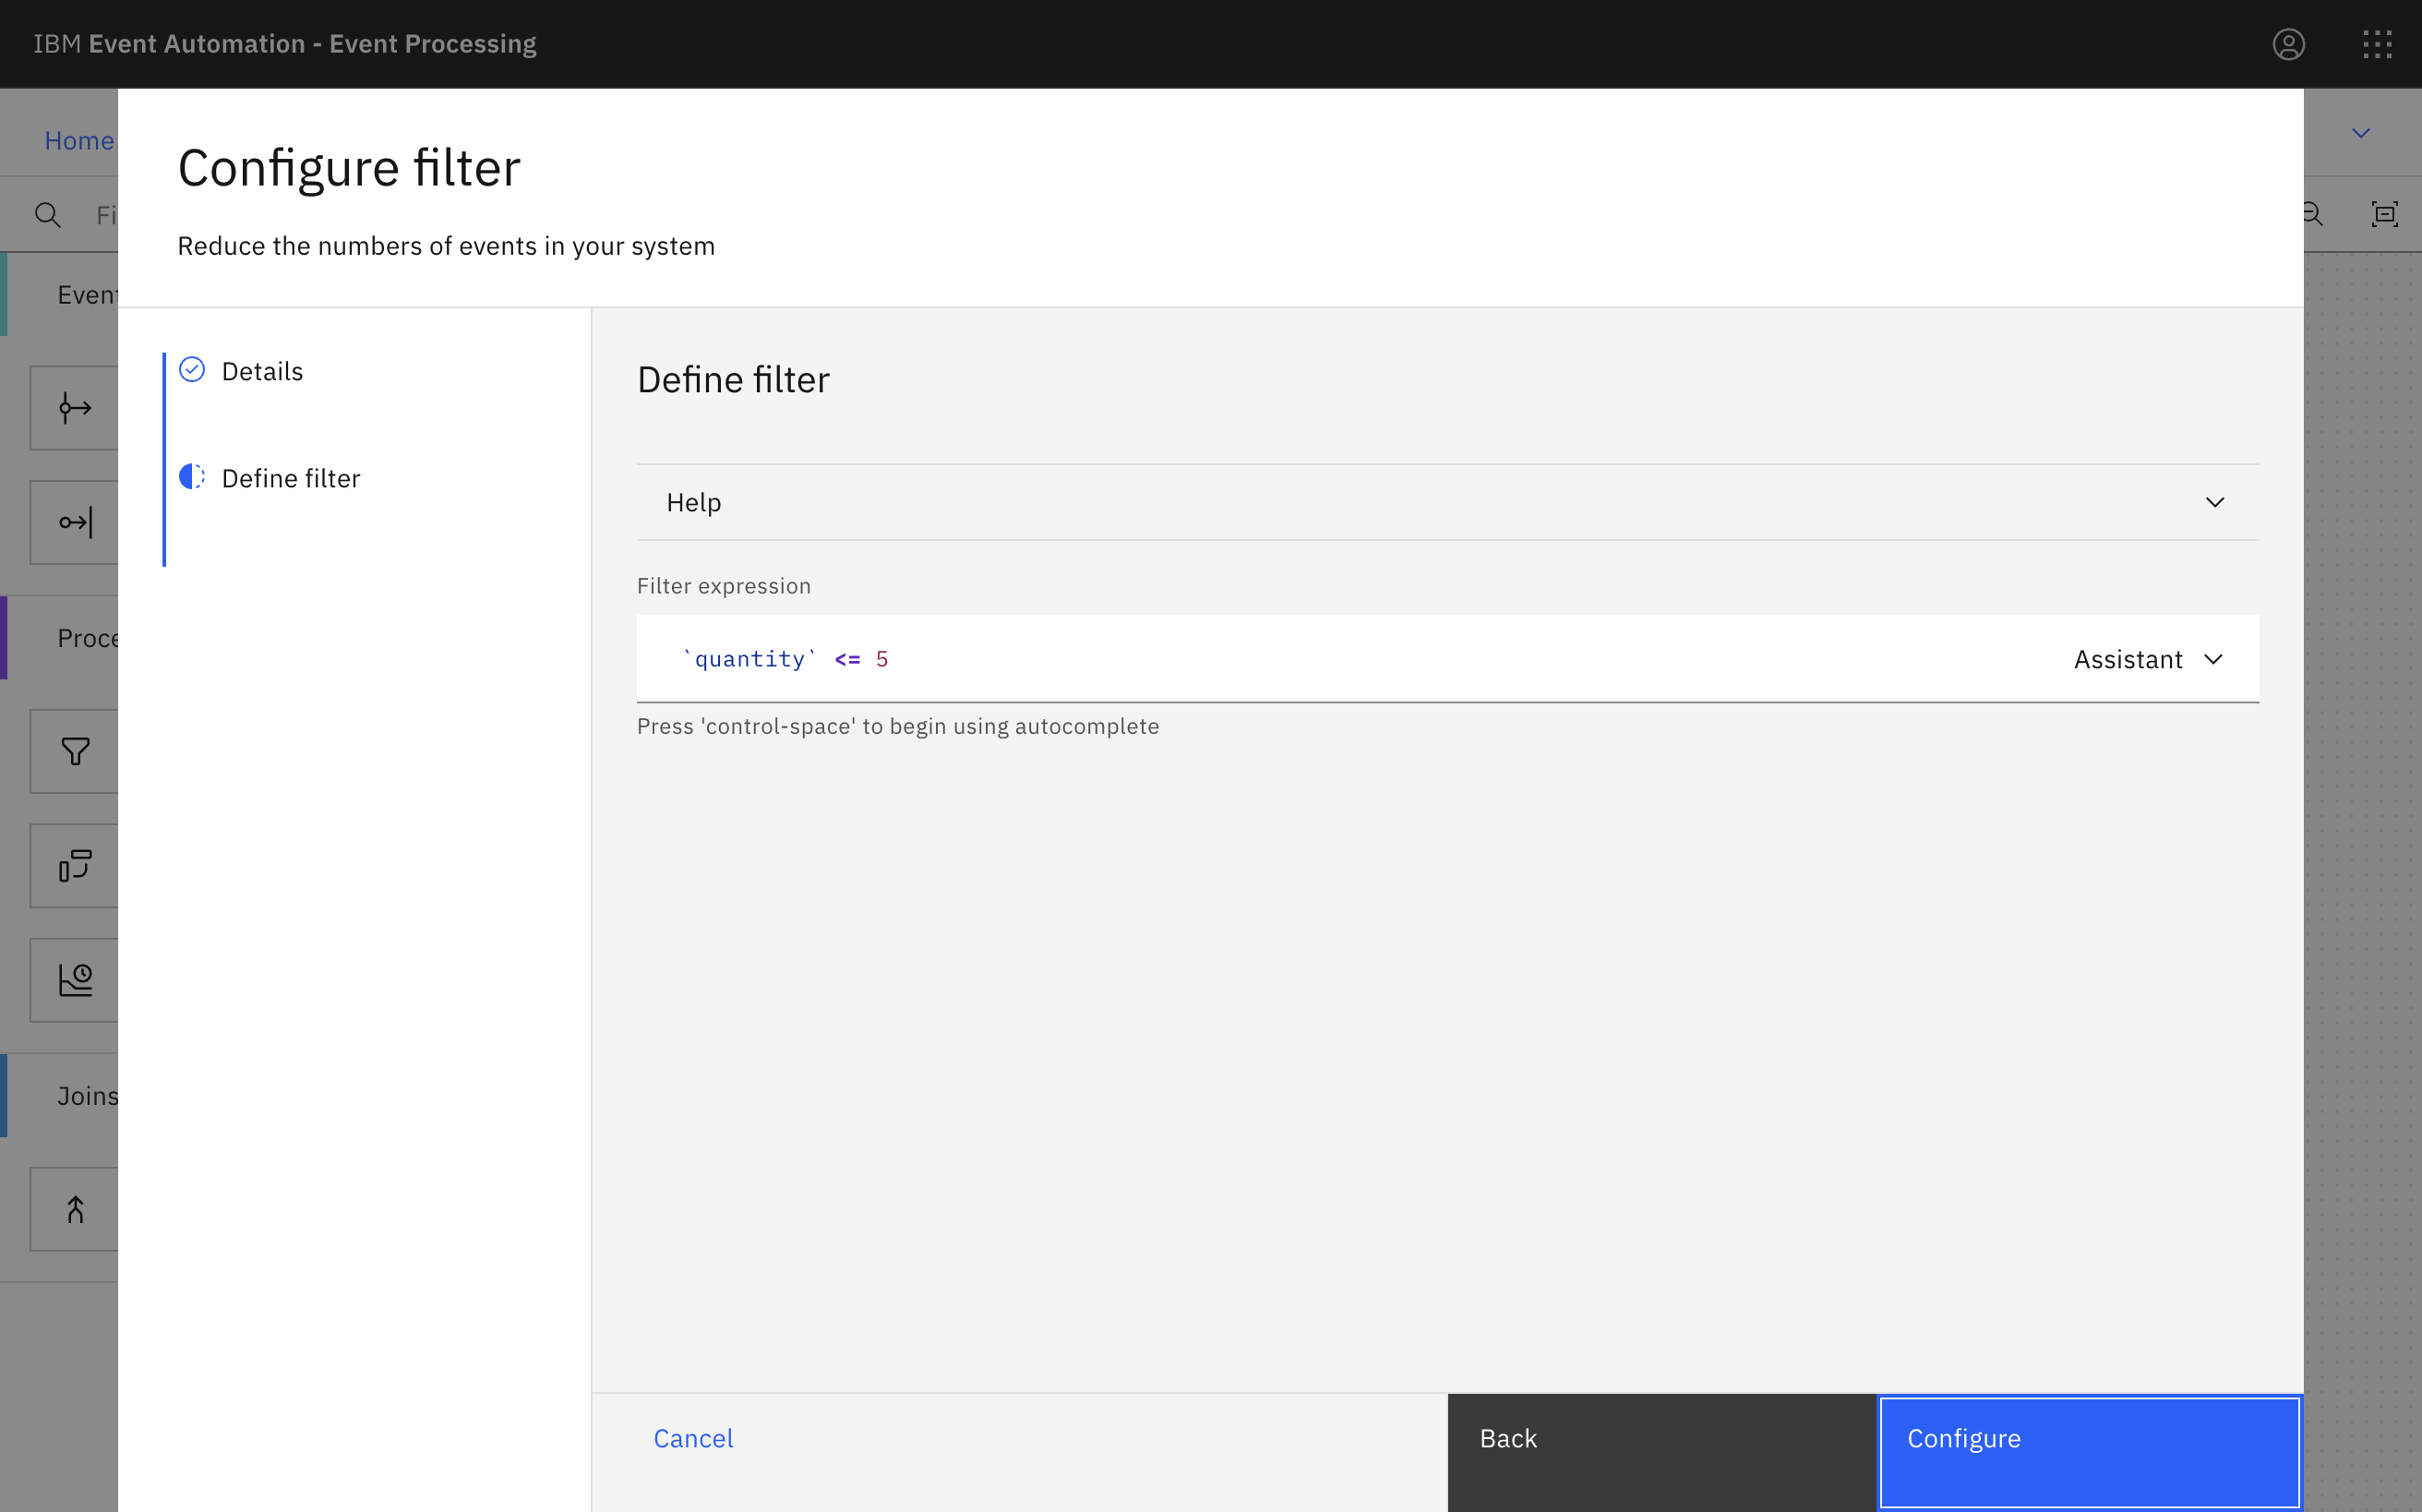
Create a filter that selects orders for five or fewer items.
`quantity` <= 5 -
Click Next to open the Output properties pane. Choose the properties to output.
-
Click Configure to finalize the filter.
Step 10: Correlating small orders with cancelled large orders
The next step is identify small orders that occur within a short time of cancelled large orders of the same product.
-
Add an Interval join node to combine the small order events with the cancelled large order events.
-
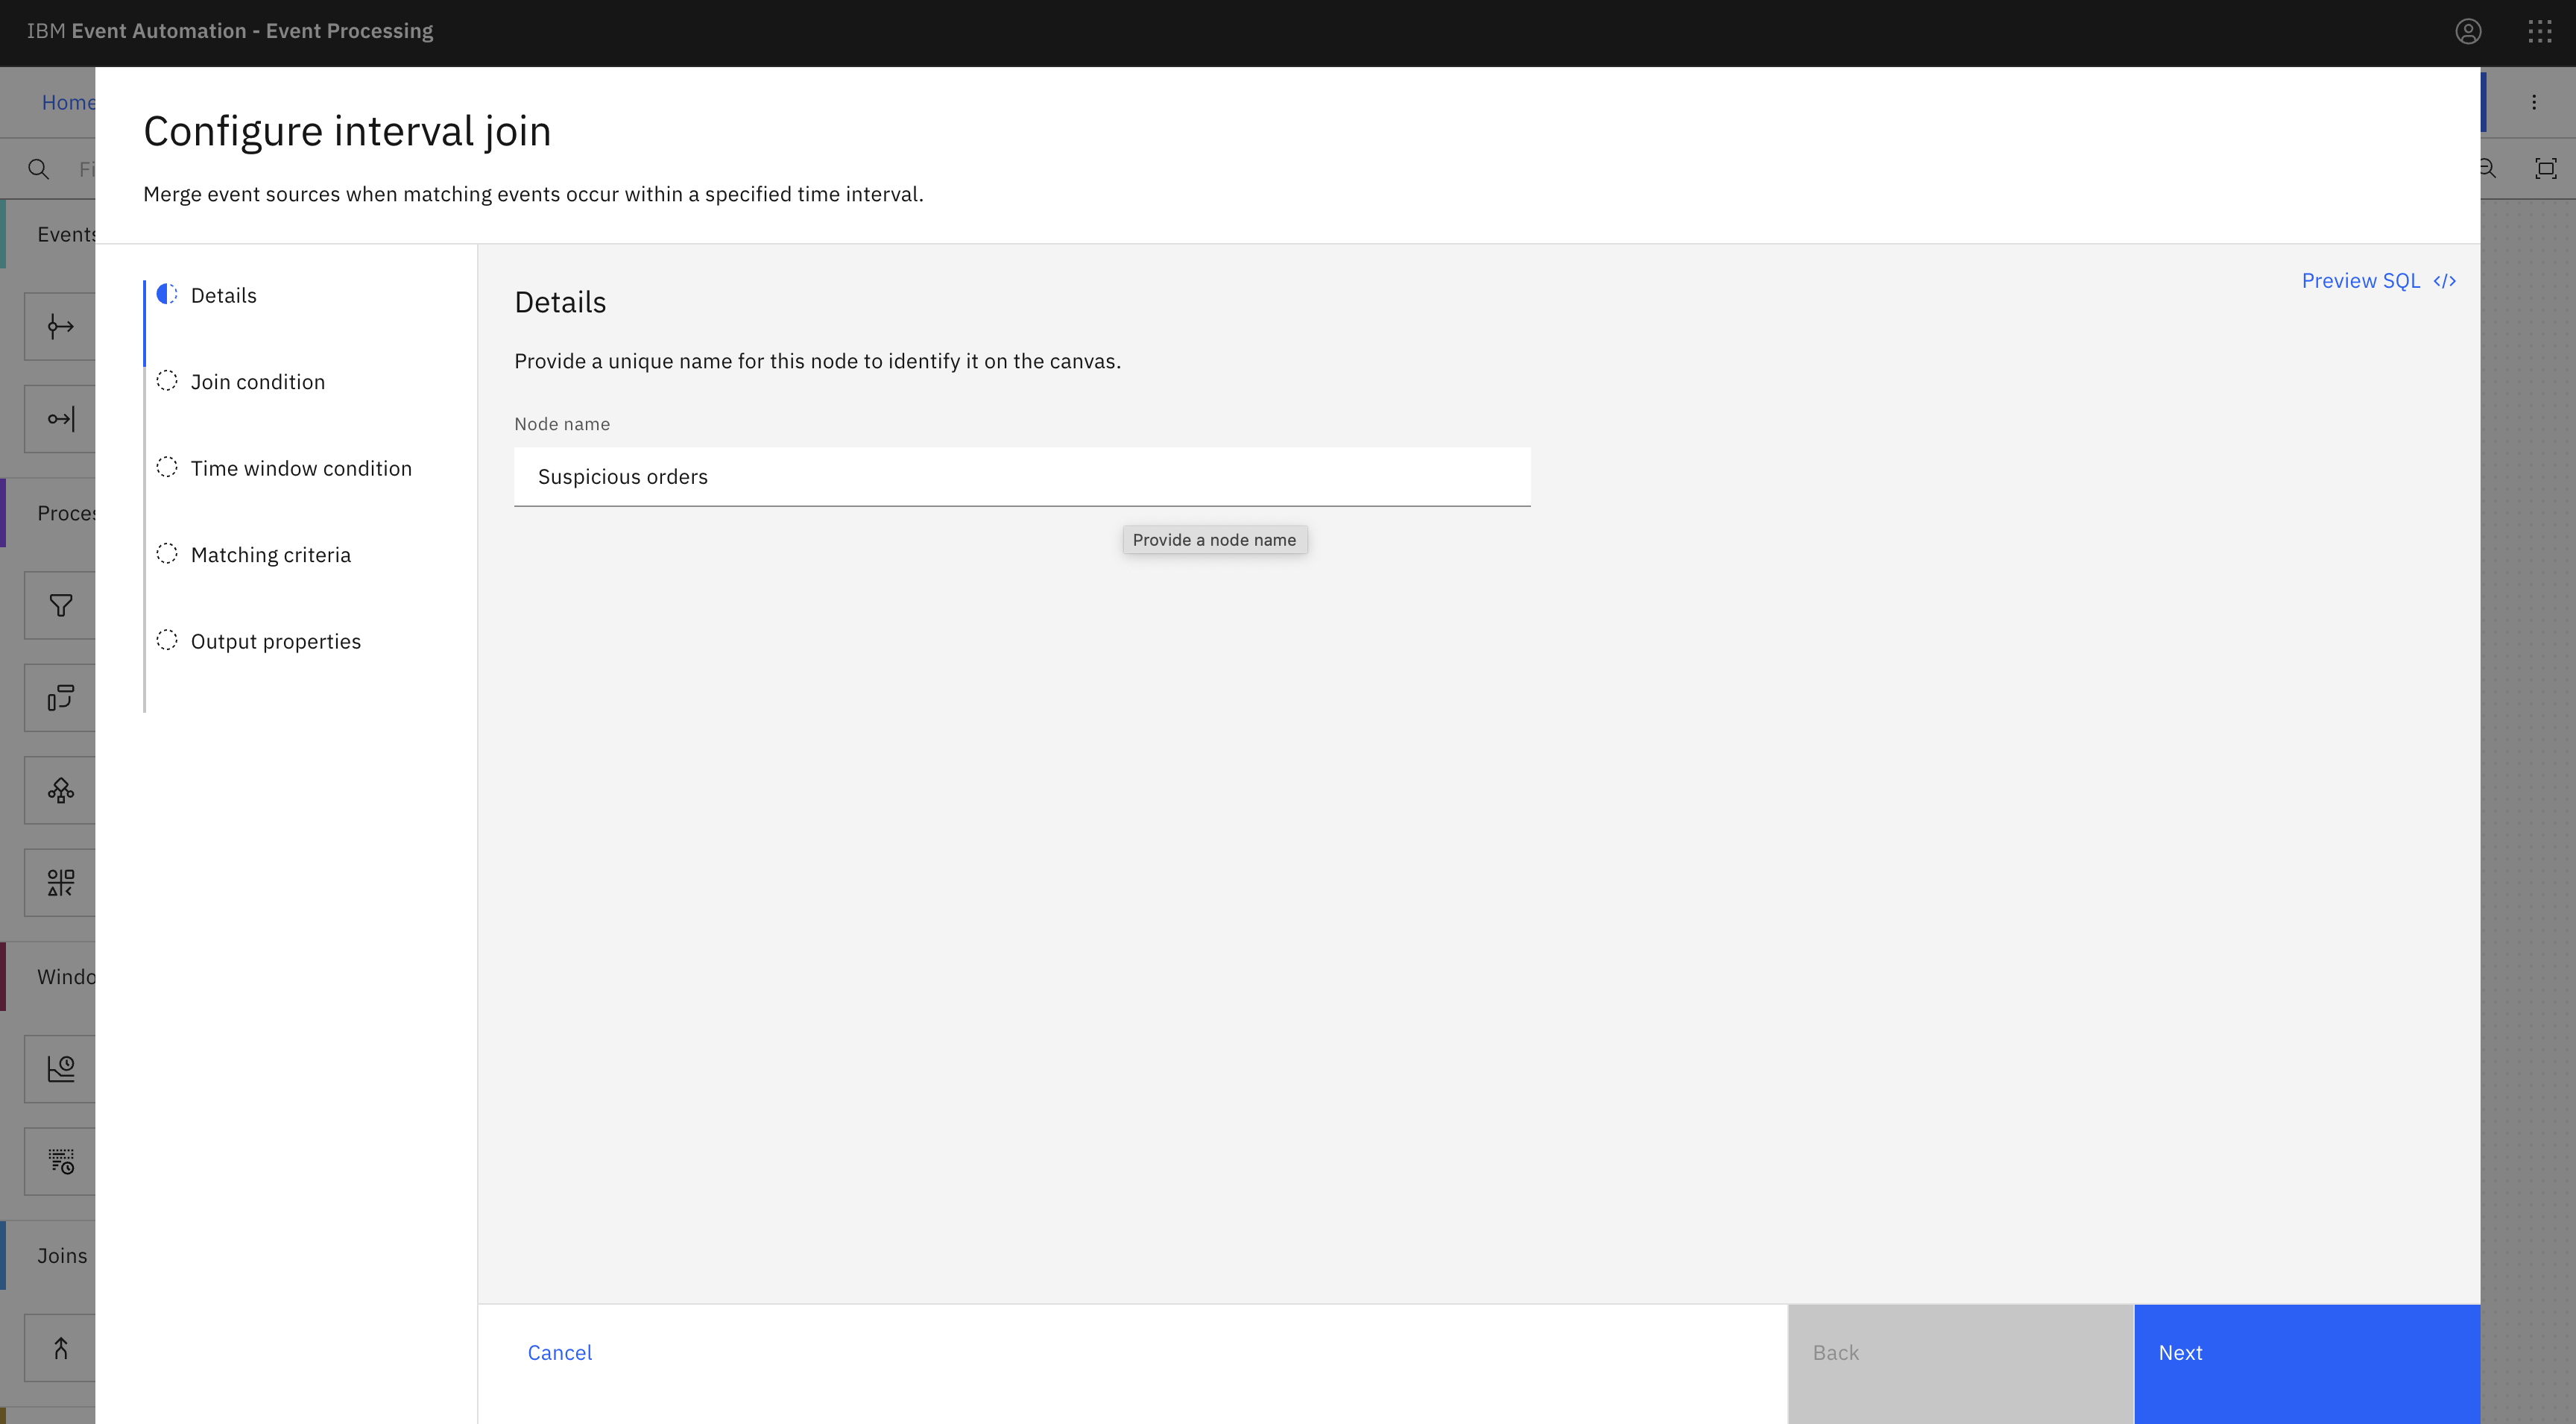
Give the join node a name that describes the events it should identify:
Suspicious orders. -
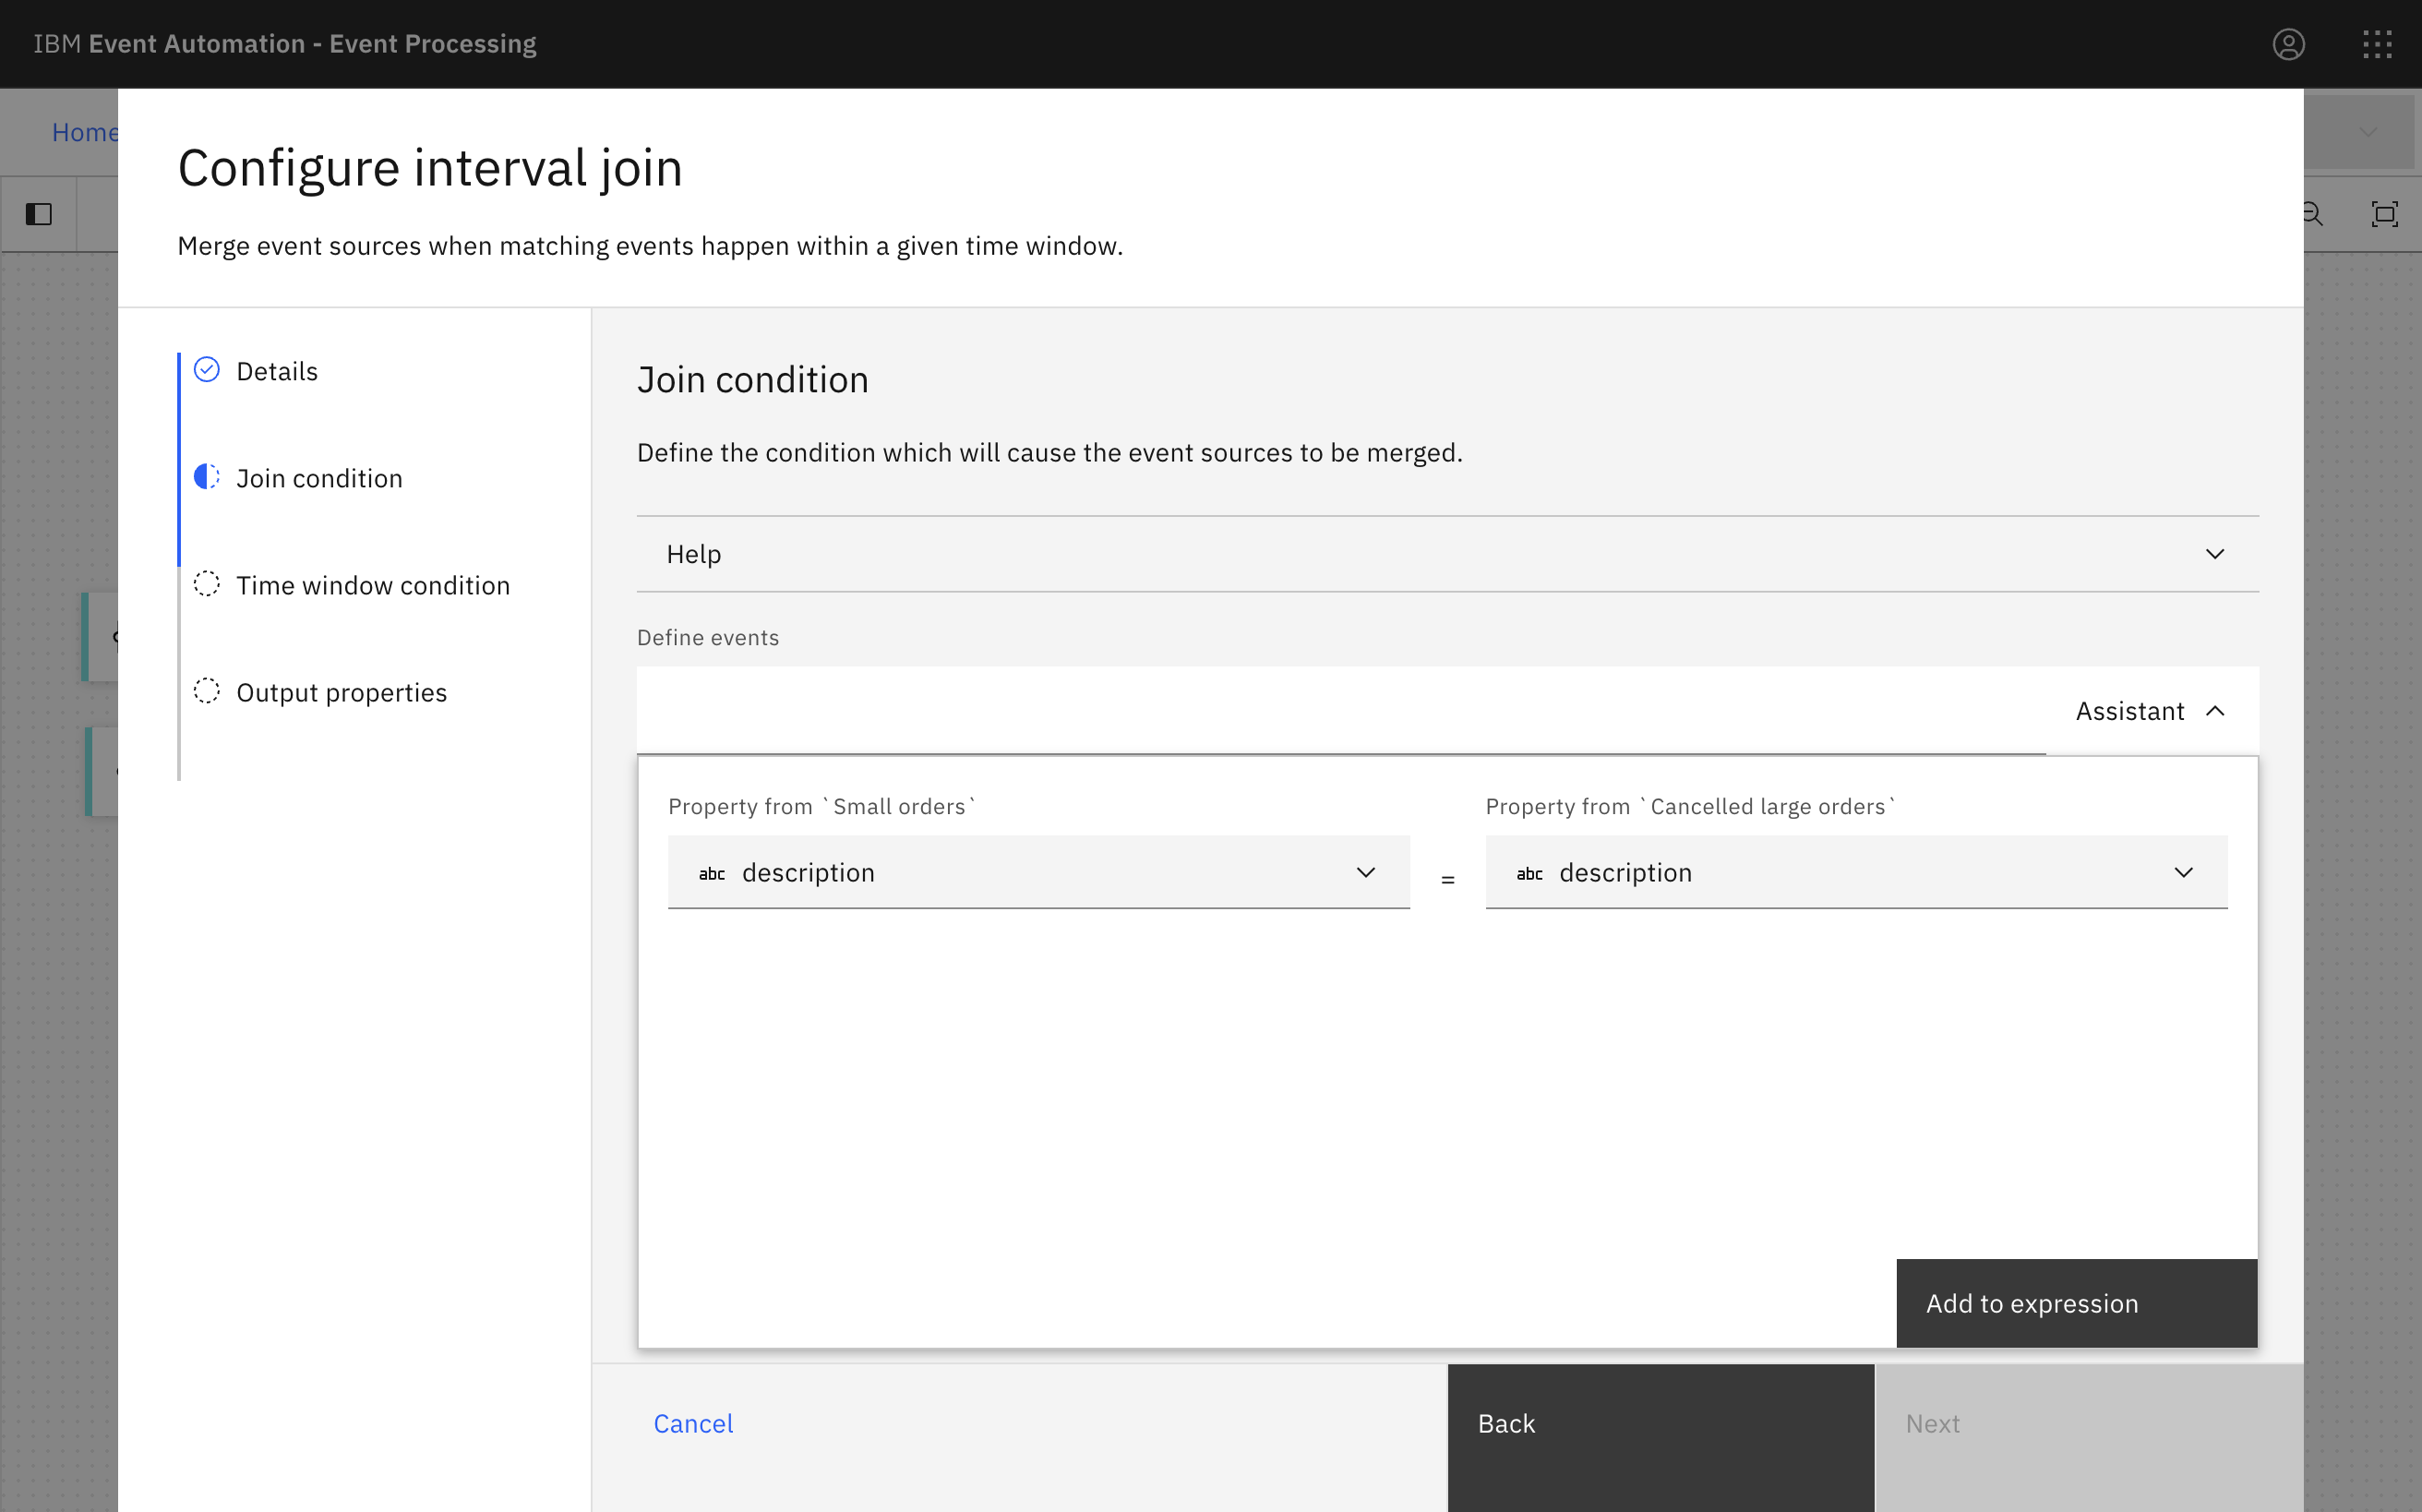
Join the two streams based on the
descriptionof the product that was ordered.This will identify small orders of the same product that a large order has been cancelled for.
Click Add to expression and then click Next.
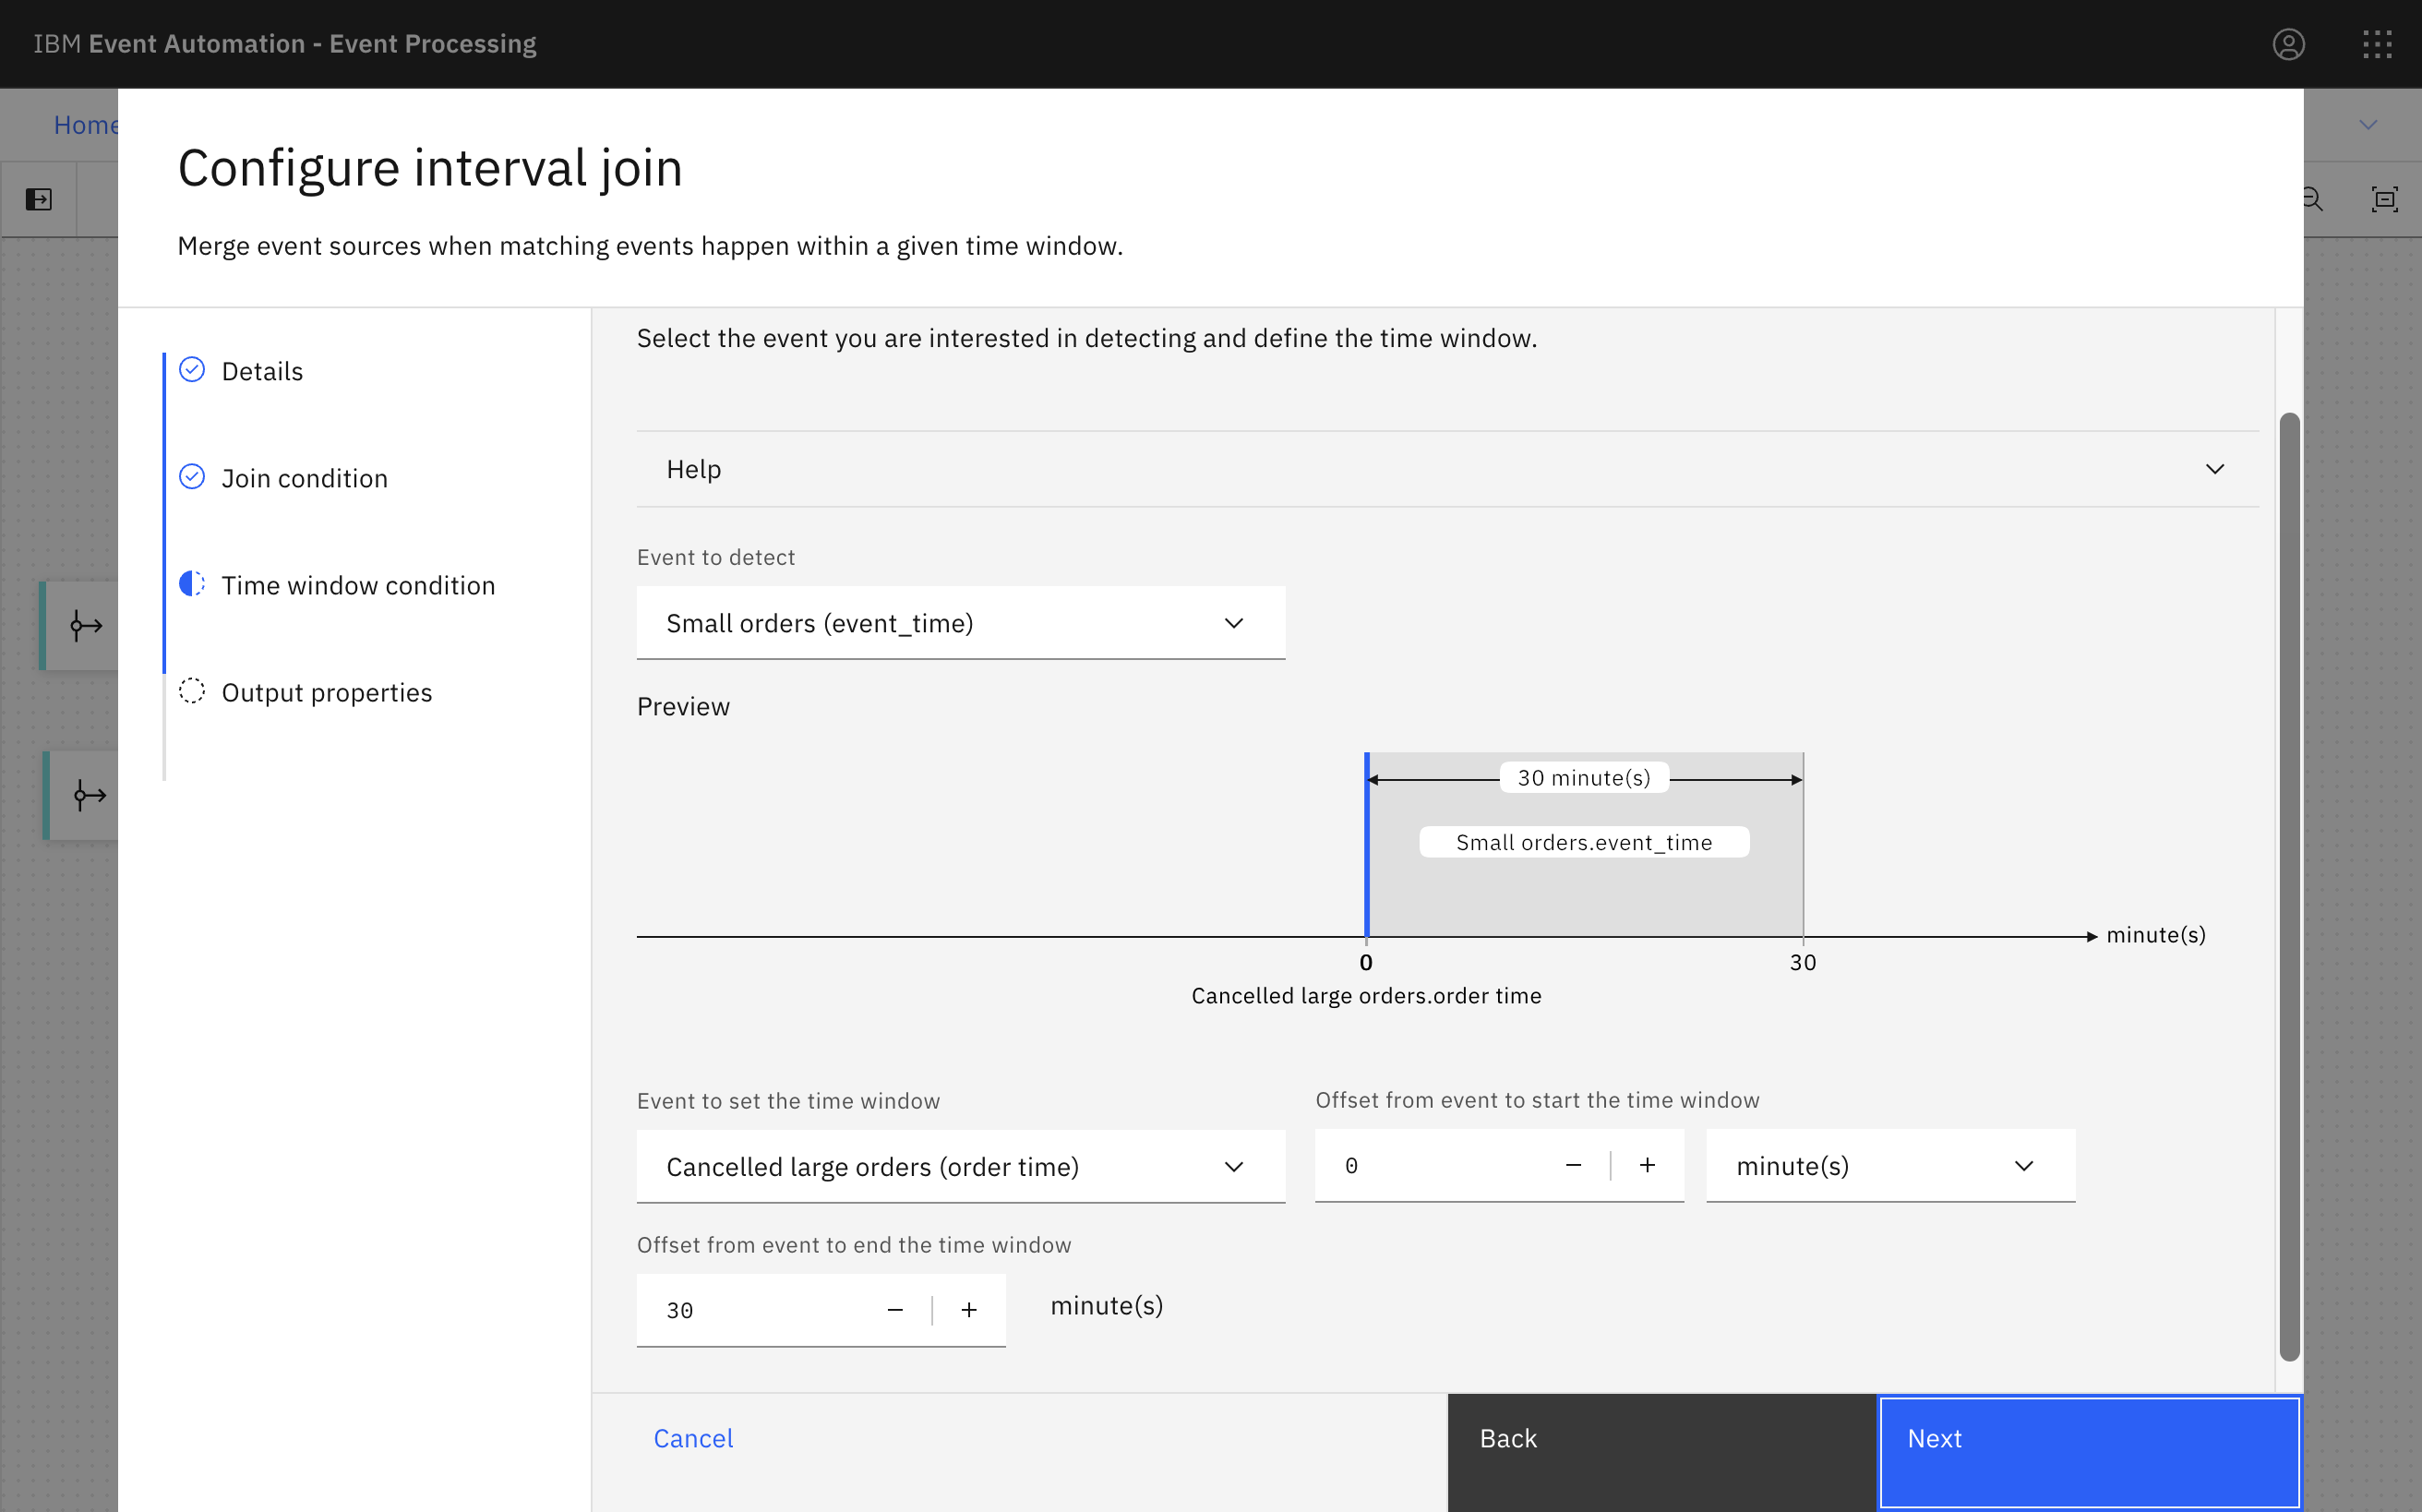
-
Specify
30 minutesthe time window that you want to use for the join.This will identify a small order, when it occurs within thirty minutes of a large order that is soon cancelled.
-
Specify how you want to join the small orders and cancelled large orders. Several types of joins exist, however in this tutorial, select an inner join to merge the small orders events and the cancelled large orders events that match the join condition (that is, with the same order ID).
-
Choose the output properties that will be useful to return.
-
Click Configure to finalize the join.
Step 11: Test the flow
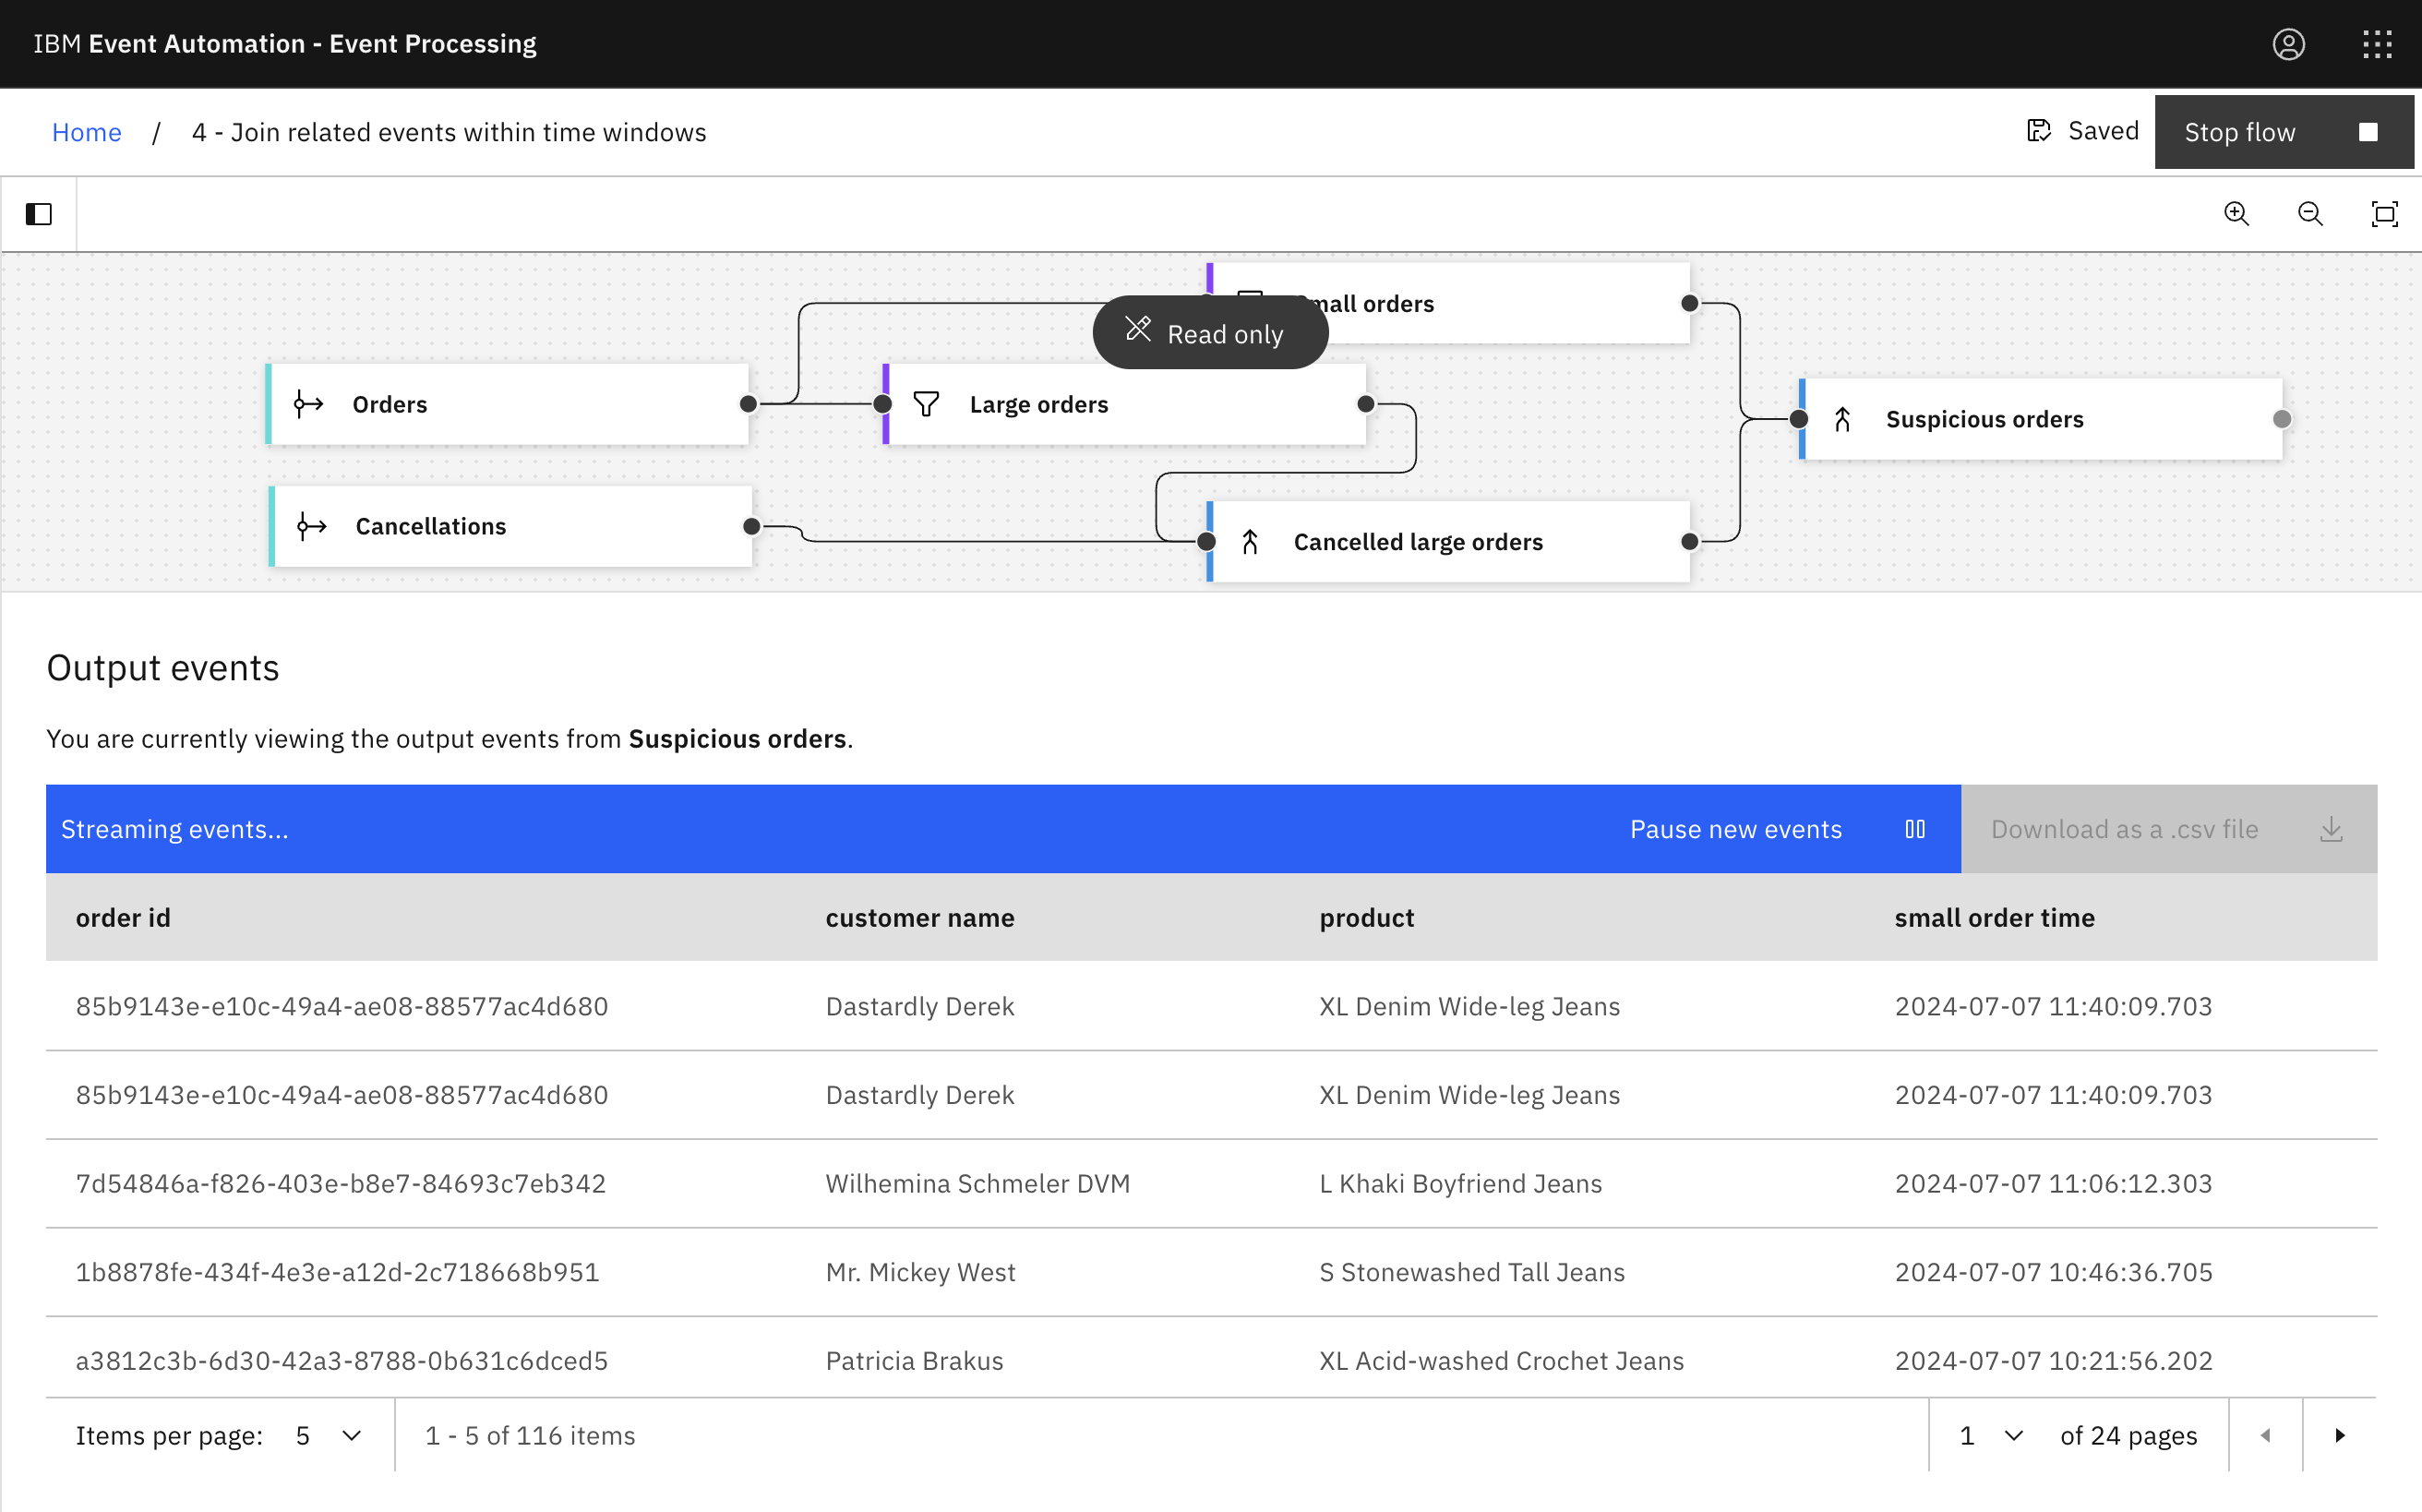
The final step is to run your event processing flow and view the results.
-
Use the Run menu, and select Include historical to run your filter on the history of order events available on this Kafka topic.
You should notice some suspicious customers (“Suspicious Bob”, “Naughty Nigel”, “Criminal Clive”, “Dastardly Derek”) in the results.
There are likely also some non-suspicious customers in the results.
Some of these might be customers who innocently made a large order, decided they didn’t need that many, cancelled it and made a smaller order instead.
Some of them might be customers who coincidentally made a small order for the same product that a suspicious person was currently manipulating the price of.
Tip: The Identify repeated attempts to manipulate dynamic pricing example shows one way that you could refine this flow to reduce the number of false positives in the results.
Recap
You used filter nodes to divide the stream of orders into separate subsets - of large and small orders.
You used join nodes to combine the orders events with the corresponding cancellation events, and to look for small orders in the context of large orders that happened within a short time window.
Next step
In the next tutorial, you will see how to use the results of your event processing flows by emitting them to Kafka topics.
