Code
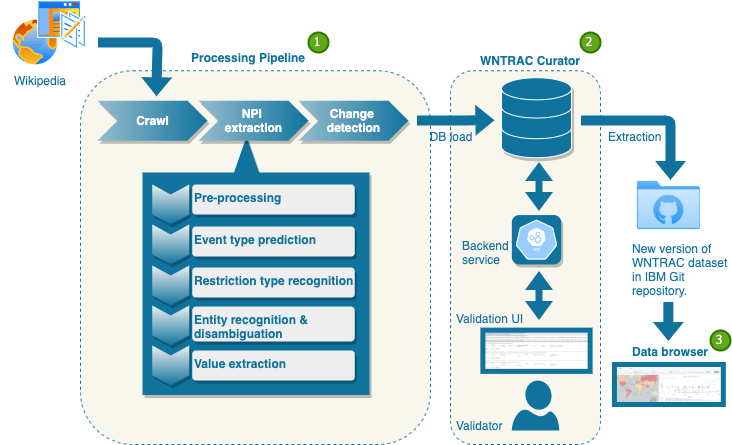
The architecture of the system is described in our paper. The system, shown in the figure below, is designed to be scalable for continuous gathering, extraction, validation, review and manual entry of NPI events. It consists of two subsystems: a data processing pipeline for capturing and extracting potential NPI events from Wikipedia articles and a tool called WNTRAC Curator for human validation of NPI events automatically extracted using the aforementioned pipeline and review of existing events and manual entry of new NPI events. The repository also contains source for the an interactive data browser that provides end users with the ability to engage with the dataset & view associations between NPIs and outcomes across regions, within specific countries/territories, and comparing with neighboring regions.

Processing pipeline
Instructions on how to run the natural language processing (NLP) pipeline can be accessed from here.
WNTRAC curator
WNTRAC Curator allows users to validate candidate evidences generated using the pipeline, add new NPI events manually and review existing NPI events. It uses Angular 9 for client side rendering and Flask to build API. The default database is PostgreSQL. Both client and backend code can be accessed from here. Instructions on how to run the flask backend can be accessed from here. Instructions on how to run the angular client can be accessed from here.
Data browser
The data browser uses a chart, map, and histogram to provide a descriptive analysis of NPIs and COVID-19 outcomes, such as confirmed cases and deaths. It uses Angular 7. The code can be accessed from here and instructions on how to run it can be found here.