IO / Cf Status
Purpose
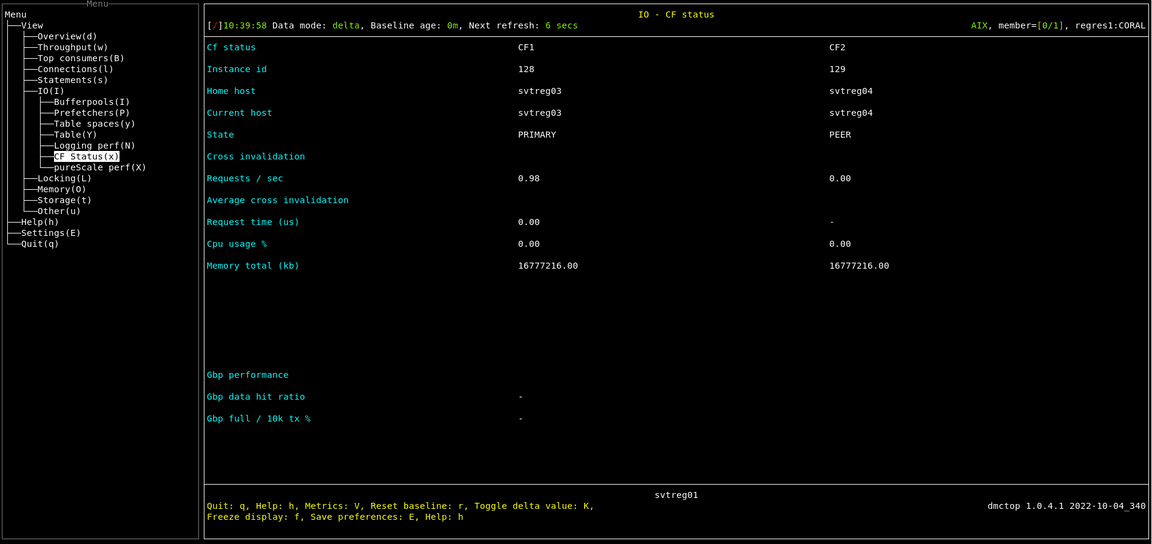
Show the current status of the cluster caching facility (CF). A few items about the global buffer pool are also shown here.
There are normally 2 CFs, the current primary and a peer. It is possible, but not recommended, to run with a single CF.
The purpose of the peer CF is for high availability. If the primary CF fails, then the peer can take over. The “State” property tracks failover and other HA type events with values such as BECOMING_PRIMARY and CATCHUP.
The global buffer pool (GBP) is part of the CF, so a few metrics about it are shown here. There is only one GBP even if two CFs have been configured. So items for the GBP are shown in a separate section at the bottom.
This view is populated only if the monitored database is pureScale. For non pureScale databases, dmctop opens a pop-up with the message “Available only for pureScale”.
Screenshot

Metric shown
Metrics are presented in two columns, one for each CF. The name of each CF is shown at the top of its column. There is a small separate section at the bottom with two metrics for the global buffer pool.
Instance id
The instance ID is a member number, except that CF members are special purpose members that don’t show up in most of the monitoring.
Source: DB2_GET_INSTANCE_INFO(NULL, NULL, NULL, NULL, NULL).ID
Home host
The machine which was associated with the member when it was first added to the instance.
Source: DB2_GET_INSTANCE_INFO(NULL, NULL, NULL, NULL, NULL).HOME_HOST
Current host
The machine name on which the member is currently running.
Source: DB2_GET_INSTANCE_INFO(NULL, NULL, NULL, NULL, NULL).CURRENT_HOST
State
The state of the member or cluster caching facility. Normally one CF will be PRIMARY and one PEER.
Possible values are
- STOPPED
- RESTARTING
- BECOMING_PRIMARY
- PRIMARY
- CATCHUP1
- PEER, ERROR
- UNKNOWN
Source: DB2_GET_INSTANCE_INFO(NULL, NULL, NULL, NULL, NULL).STATE
Cross invalidation
Requests / sec
The total number of requests in the CF for this command per second.
SELECT TOTAL_CF_REQUESTSFROM TABLE(MON_GET_CF_CMD(NULL))WHERE CF_CMD_NAME = 'CrossInvalidate'
Source:
MON_GET_CF_CMD(NULL).CF_CMD_NAME
Average cross invalidation
Request time (us)
The average processing time in the CF per request for cross invalidation command. This should be less than 10 us, more than 20 us indicates a bottleneck.
= TOTAL_CF_CMD_TIME_MICRO / TOTAL_CF_REQUESTS
SELECT TOTAL_CF_CMD_TIME_MICRO, TOTAL_CF_REQUESTSFROM TABLE(MON_GET_CF_CMD(NULL))WHERE CF_CMD_NAME = 'CrossInvalidate'
Source:
MON_GET_CF_CMD(NULL).CF_CMD_NAME
Cpu usage %
The percentage of time the CF workers are busy doing work when the CF is bound to its own set of CPUs
Memory total (kb)
The total size of physical memory.
Gbp performance
Gbp data hit ratio
Times a requested page was found in the group bufferpool.
= 1 - POOL_DATA_GBP_P_READS / POOL_DATA_GBP_L_READS
Source:
POOL_DATA_GBP_P_READS = MON_GET_SERVICE_SUBCLASS(NULL, NULL, #MEMBER#).POOL_DATA_GBP_P_READS
POOL_DATA_GBP_L_READS = MON_GET_SERVICE_SUBCLASS(NULL, NULL, #MEMBER#).POOL_DATA_GBP_L_READS
Gbp full / 10k tx %
Ideally, this is zero. Up to about 5 is acceptable. Higher values indicate possible configuration problems, including:
- GBP configured too small
- Too few castout engines configured
- SOFTMAX set too high
= NUM_GBP_FULL / TOTAL_APP_COMMITS
Source:
NUM_GBP_FULL = MON_GET_GROUP_BUFFERPOOL(#MEMBER#).NUM_GBP_FULL
TOTAL_APP_COMMITS = MON_GET_SERVICE_SUBCLASS(NULL, NULL, #MEMBER#).TOTAL_APP_COMMITS