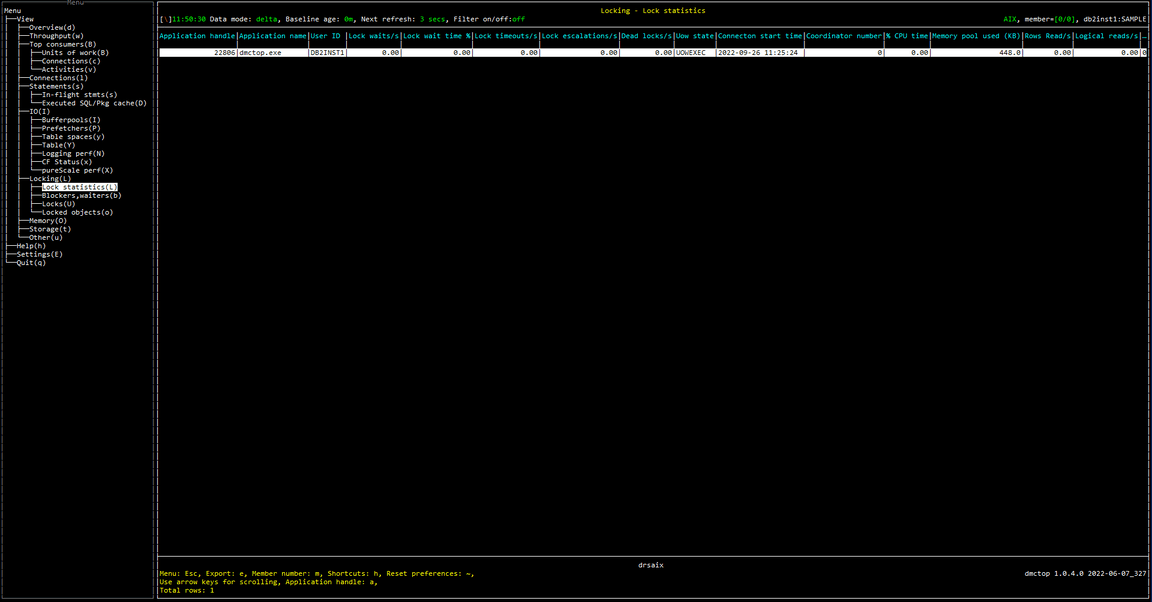
Locking / Lock Statistics
Purpose
Use this view to find sessions (connections) that have been involved in locking problems:
- Sessions that have recently experienced excessive lock waits, time outs, escalations or deadlocks
- Sessions that have consumed excessive log space over their lifetime
- Sessions that are currently holding many locks
- Idle sessions
For context, this view also shows some basic information to help you identify the session without needing to jump to another view:
- Application Name
- User ID
- Workload Name
Screenshot

Metric shown
Application handle
A system-wide unique ID for the application.
Source: MON_GET_CONNECTION(NULL, #MEMBER#).APPLICATION_HANDLE
Application name
The name of the application running at the client, as known to the database or Db2 Connect server.
Source: MON_GET_CONNECTION(NULL, #MEMBER#).APPLICATION_NAME
User ID
The current authorization ID for the session being used by this application.
Source: MON_GET_CONNECTION(NULL, #MEMBER#).SESSION_AUTH_ID
Lock waits
The total number of times that applications or connections waited for locks.
Source: MON_GET_CONNECTION(NULL, #MEMBER#).SUM(LOCK_WAITS)
Lock wait time
The total elapsed time spent waiting for locks.
Source: MON_GET_CONNECTION(NULL, #MEMBER#).SUM(LOCK_WAIT_TIME)
Lock timeouts
The number of times that a request to lock an object timed out instead of being granted.
Source: MON_GET_CONNECTION(NULL, #MEMBER#).SUM(LOCK_TIMEOUTS)
Lock escalations
The number of times that locks have been escalated from several row locks to a table lock.
Source: MON_GET_CONNECTION(NULL, #MEMBER#).SUM(LOCK_ESCALS)
Dead locks
The total number of deadlocks that have occurred.
Source: MON_GET_CONNECTION(NULL, #MEMBER#).SUM(DEADLOCKS)
Uow state
The state of the workload occurrence.
Source: MON_GET_UNIT_OF_WORK(MON_GET_CONNECTION(NULL, #MEMBER#).APPLICATION_HANDLE, MON_GET_CONNECTION(NULL, #MEMBER#).COORD_MEMBER).MAX(WORKLOAD_OCCURRENCE_STATE)
Connecton start time
The time at which the connection was established with the database server.
Source: MON_GET_CONNECTION(NULL, #MEMBER#).MIN(CONNECTION_START_TIME)
Coordinator number
The coordinating member for an application.
Source: MON_GET_CONNECTION(NULL, #MEMBER#).COORD_MEMBER)
Total cpu time
The total amount of CPU time used while within the database system.
Source: MON_GET_CONNECTION(NULL, #MEMBER#).SUM(TOTAL_CPU_TIME)
Memory pool used
The amount of committed memory in use by this memory pool.
Source: MON_GET_MEMORY_POOL (NULL, CURRENT_SERVER, #MEMBER#).SUM(MEMORY_POOL_USED)
Rows read
The number of rows read from the table.
Source: MON_GET_CONNECTION(NULL, #MEMBER#).SUM(ROWS_READ)
Logical reads
Indicates the number of pages read from the buffer pool (logical).
Source: MON_GET_CONNECTION(NULL, #MEMBER#).SUM(POOL_DATA_L_READS + POOL_INDEX_L_READS + POOL_TEMP_DATA_L_READS + POOL_TEMP_INDEX_L_READS + POOL_XDA_L_READS + POOL_TEMP_XDA_L_READS)
Locks held
The number of locks currently held.
Source: MON_GET_UNIT_OF_WORK(NULL, #MEMBER#).SUM(NUM_LOCKS_HELD)
Log Used
The amount of log space used in the current unit of work of the monitored application.
Source: MON_GET_UNIT_OF_WORK(NULL, #MEMBER#).SUM(UOW_LOG_SPACE_USED)
Idle time
The elapsed time from last time that the event, being processed by the agent, was changed.
Source:
WLM_GET_SERVICE_CLASS_AGENTS(NULL, NULL, APPLICATION_HANDLE, COORD_MEMBER). AGENT_STATE_LAST_UPDATE_TIME
Workload name
The name of the workload.
Source: MON_GET_UNIT_OF_WORK(NULL, #MEMBER#).MIN(WORKLOAD_NAME)