Top Consumers / Activities
Purpose
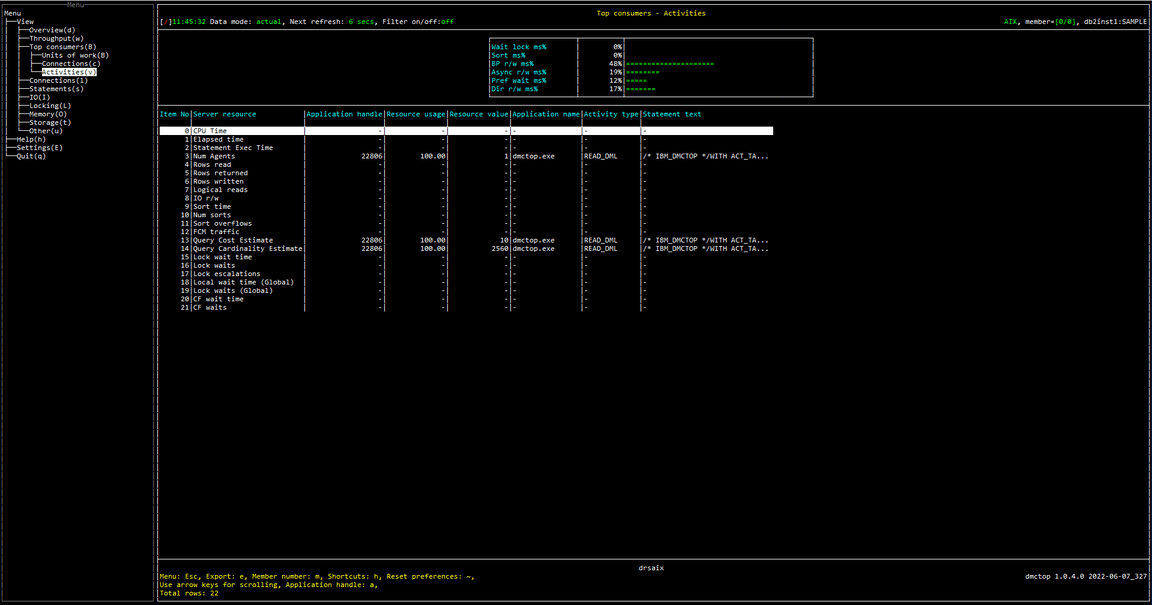
Activities view shows the user which activities consume the most resources. Activities are generally queries, but long running DDL and LOAD activities are also included here.
Screenshot

Metric shown
Gauge
Following is the variable used as denominator in this section:
TOTAL_TIME = MON_GET_DATABASE(#MEMBER#).SUM(LOCK_WAIT_TIME + TOTAL_SECTION_SORT_TIME + POOL_READ_TIME + POOL_WRITE_TIME + POOL_ASYNC_READ_TIME + POOL_ASYNC_WRITE_TIME + PREFETCH_WAIT_TIME + DIRECT_READ_TIME + DIRECT_WRITE_TIME)
Wait lock ms%
The percentage of time spent waiting for locks.
= LOCK_WAIT_TIME / TOTAL_TIME
Source:
LOCK_WAIT_TIME = MON_GET_DATABASE(#MEMBER#).SUM(LOCK_WAIT_TIME)
Sort ms%
The percentage of time spent performing sorts while executing a section, which is the execution of the compiled query plan generated by the SQL statement that was issued by the client application.
= TOTAL_SECTION_SORT_TIME / TOTAL_TIME
Source:
TOTAL_SECTION_SORT_TIME = MON_GET_DATABASE(#MEMBER#).SUM(TOTAL_SECTION_SORT_TIME)
BP r/w ms%
The percentage of time spent reading and writing in data and index pages from the table space containers (physical) for all types of table spaces.
= BP_IO_TIME / TOTAL_TIME
Source:
BP_IO_TIME = MON_GET_DATABASE(#MEMBER#).SUM(POOL_READ_TIME + POOL_WRITE_TIME)
Async r/w ms%
The percentage of time for asynchronous writes and reads to complete.
= BP_ASYNC_IO_TIME / TOTAL_TIME
Source:
BP_ASYNC_IO_TIME = MON_GET_DATABASE(#MEMBER#).SUM(POOL_ASYNC_READ_TIME + POOL_ASYNC_WRITE_TIME)
Pref wait ms%
The percentage of time an application spent waiting for an I/O server (prefetcher) to finish loading pages into the buffer pool.
= PREFETCH_WAIT_TIME / TOTAL_TIME
Source:
PREFETCH_WAIT_TIME = MON_GET_DATABASE(#MEMBER#).SUM(PREFETCH_WAIT_TIME)
Dir r/w ms%
The percentage of time required to perform the direct reads and writes.
= DIRECT_IO_TIME / TOTAL_TIME
Source:
DIRECT_IO_TIME = MON_GET_DATABASE(#MEMBER#).SUM(DIRECT_READ_TIME + DIRECT_WRITE_TIME)
Table
0 CPU Time
The activity with maximum amount of CPU time used while within the database system.
Source: MON_GET_ACTIVITY(NULL, #MEMBER#).SUM(TOTAL_CPU_TIME)
1 Elapsed time
The activity with maximum elapsed time from the time that this activity began doing work on the member.
= CURRENT TIMESTAMP - LOCAL_START_TIME
Source:
MON_GET_ACTIVITY(NULL, #MEMBER#).LOCAL_START_TIME
2 Statement Exec Time
The activity with maximum time spent executing the statement.
Source: MON_GET_ACTIVITY(NULL, #MEMBER#).SUM(STMT_EXEC_TIME)
3 Num Agents
The activity with maximum number of concurrent agents currently executing a statement or subsection.
Source: MON_GET_ACTIVITY(NULL, #MEMBER#).SUM(NUM_AGENTS)
4 Rows read
The activity with maximum number of rows read from the table.
Source: MON_GET_ACTIVITY(NULL, #MEMBER#).SUM(ROWS_READ)
5 Rows returned
The activity with maximum number of rows that have been selected and returned to the application.
Source: MON_GET_ACTIVITY(NULL, #MEMBER#).SUM(ROWS_RETURNED)
6 Rows written
The activity with maximum number of rows inserted, updated, or deleted.
Source: MON_GET_ACTIVITY(NULL, #MEMBER#).SUM(ROWS_MODIFIED)
7 Logical reads
The activity with maximum number of pages which have been requested from the buffer pool (logical).
Source: MON_GET_ACTIVITY(NULL, #MEMBER#).SUM(POOL_DATA_L_READS + POOL_TEMP_DATA_L_READS + POOL_XDA_L_READS + POOL_TEMP_XDA_L_READS + POOL_INDEX_L_READS + POOL_TEMP_INDEX_L_READS + POOL_COL_L_READS + POOL_TEMP_COL_L_READS)
8 IO r/w
The activity with maximum number of pages which have been requested from the buffer pool (logical) or been written to disk.
Source: MON_GET_ACTIVITY(NULL, #MEMBER#).SUM(POOL_DATA_L_READS + POOL_TEMP_DATA_L_READS + POOL_XDA_L_READS + POOL_TEMP_XDA_L_READS + POOL_INDEX_L_READS + POOL_TEMP_INDEX_L_READS + POOL_COL_L_READS + POOL_TEMP_COL_L_READS + POOL_DATA_WRITES + POOL_INDEX_WRITES + POOL_XDA_WRITES + POOL_COL_WRITES)
9 Sort time
The activity with maximum amount of time spent performing sorts while executing a section.
Source: MON_GET_ACTIVITY(NULL, #MEMBER#).SUM(TOTAL_SECTION_SORT_TIME)
10 Num sorts
The activity with maximum number of sorts that have been executed.
Source: MON_GET_ACTIVITY(NULL, #MEMBER#).SUM(TOTAL_SORTS)
11 Sort overflows
The activity with maximum number of sorts that ran out of sort heap and may have required disk space for temporary storage.
Source: MON_GET_ACTIVITY(NULL, #MEMBER#).SUM(SORT_OVERFLOWS)
12 FCM traffic
The activity with maximum amount of data received via or distributed by the FCM communications layer.
Source: MON_GET_ACTIVITY(NULL, #MEMBER#).SUM(FCM_SEND_VOLUME + FCM_RECV_VOLUME)
13 Query Cost Estimate
The activity with maximum estimated cost for a query.
Source: MON_GET_ACTIVITY(NULL, #MEMBER#).MAX(QUERY_COST_ESTIMATE)
14 Query Cardinality Estimate
The activity with maximum estimated number of rows that will be returned by a query.
Source: MON_GET_ACTIVITY(NULL, #MEMBER#).MAX(QUERY_CARD_ESTIMATE)
15 Lock wait time
The activity with maximum elapsed time spent waiting for locks.
Source: MON_GET_ACTIVITY(NULL, #MEMBER#).SUM(LOCK_WAIT_TIME)
16 Lock waits
The activity with maximum number of times that applications or connections waited for locks.
Source: MON_GET_ACTIVITY(NULL, #MEMBER#).SUM(LOCK_WAITS)
17 Lock escalations
The activity with maximum number of times that locks have been escalated from several row locks to a table lock.
Source: MON_GET_ACTIVITY(NULL, #MEMBER#).SUM(LOCK_ESCALS)
18 Local wait time (Global)
The activity with maximum time spent on global lock waits.
Source: MON_GET_ACTIVITY(NULL, #MEMBER#).SUM(LOCK_WAIT_TIME_GLOBAL)
19 Lock waits (Global)
The activity with maximum number of lock waits due to the application holding the lock being on a remote member.
Source: MON_GET_ACTIVITY(NULL, #MEMBER#).SUM(LOCK_WAITS_GLOBAL)
20 CF wait time
The activity with maximum amount of time spent communicating with the cluster caching facility.
Source: MON_GET_ACTIVITY(NULL, #MEMBER#).SUM(CF_WAIT_TIME)
21 CF waits
The activity with maximum number of times that the database system waited while it communicated with a cluster caching facility.
Source: MON_GET_ACTIVITY(NULL, #MEMBER#).SUM(CF_WAITS)
Application handle
A system-wide unique ID for the application.
Source: MON_GET_ACTIVITY(NULL, #MEMBER#).APPLICATION_HANDLE
Resource usage
The percentage of application resource usage.
Resource value
The corresponding resource value.
Application name
The name of the application running at the client, as known to the database or Db2 Connect server.
Source: MON_GET_CONNECTION.APPLICATION_NAME
Activity type
The type of the activity.
Possible values are as follows:
- CALL
- DDL
- LOAD
- OTHER
- READ_DML
- WRITE_DML
Source: MON_GET_ACTIVITY(NULL, #MEMBER#).ACTIVITY_TYPE
Statement text
The first 30 characters of the SQL statement of activity.
Source: MON_GET_ACTIVITY(NULL, #MEMBER#).STMT_TEXT