In this getting started tutorial, we’ll take you through how to use Event Processing to create a simple flow. The flow uses a filter node to select a subset of events.
For demonstration purposes, we use the scenario of a clothing company who want to move away from reviewing quarterly sales reports to reviewing orders in their region as they occur. Identifying large orders in real time helps the clothing company identify changes that are needed in sales forecasts much earlier. This information can also be fed back into their manufacturing cycle so that they can better respond to demand.
The steps in this getting started tutorial should take you about 10 minutes to complete.
Before you begin
- This getting started scenario assumes that all the capabilities in Event Automation are installed.
- Connect with your cluster administrator and get the server address for the topic you have to access.
- Keep your instance open on the topic page because you need to use information from it when you create your flow.
- Open Event Processing in a separate window or tab.
This getting started scenario assumes that there is an order details available through a Kafka topic, and the topic is discoverable in Event Endpoint Management. For example, in this scenario, the clothing company have a topic in their Event Endpoint Management catalog called ORDERS.NEW. This topic emits events for every new order that is made.
Step 1: Create a flow
- On the Event Processing home page, click Create.
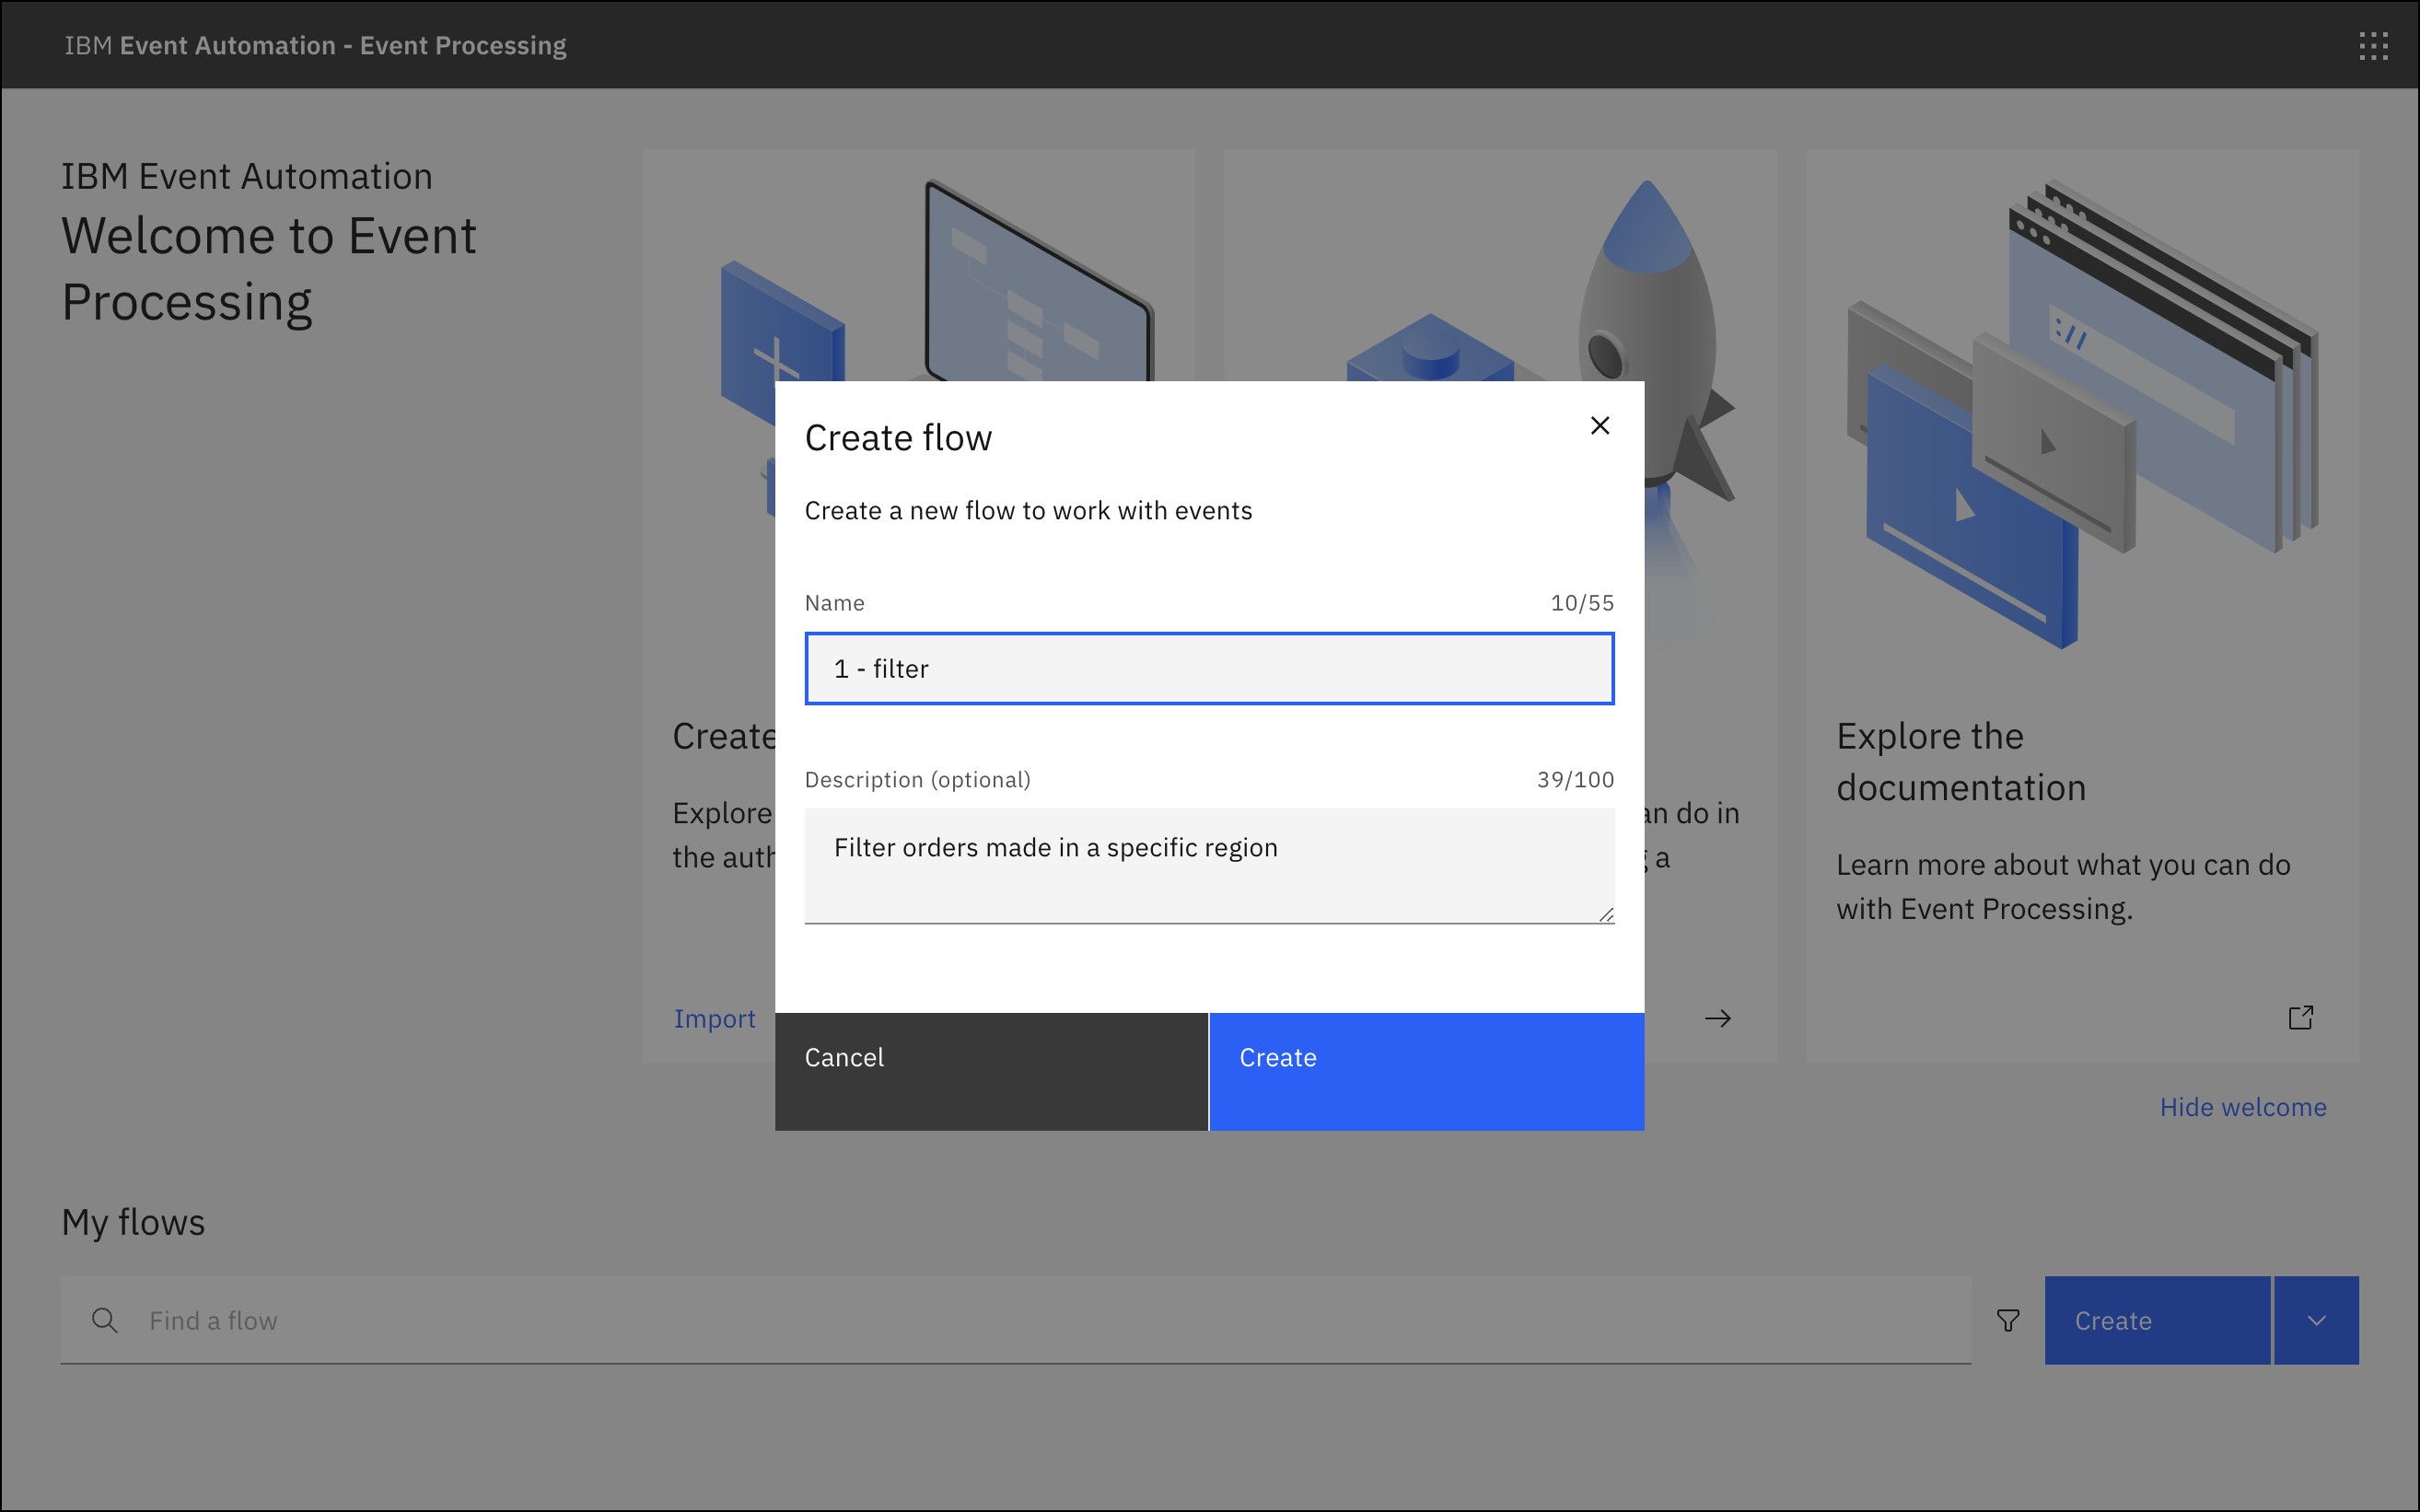
- Provide a name and optionally a description for your flow.
-
Click Create. The canvas is displayed with an event source node on it.
Note: When you create a flow, an event source node is automatically added to your canvas. A purple checkbox
is displayed on the event source node indicating that the node is yet to be configured.
- To configure an event source, hover over the source node, and click
Edit. The Configure event source window is displayed.
The clothing company created a flow called Filter and provided a description to explain that this flow will be used to identify orders made in a specific region.
Save
User actions are saved automatically. For save status updates, see the canvas header.
- Saving
 indicates that saving is in progress.
 - Saved
 confirms success.
 - Failed
 indicates that there are errors. If an action fails to save automatically, you receive a notification to try the save again. Click Retry to re-attempt the save. When a valid flow is saved, you can proceed to run the job.
 - Stale
 indicates that another user modified the flow. A pop-up window is displayed and depending on the Stale status you are prompted to select one of the following actions:
- Save as a copy: Select this action to save the current flow as a new one without incorporating the changes made by the other user. The new flow is called ‘Copy of
<flow-name>’. - Accept changes: Select this action to apply the latest updates that are made by the other user to the flow. For the Flow running case, you can view the running flow.
- Home: Select this action to navigate back to the home page. The specific flow will no longer be available because it was deleted by another user.
- Save as a copy: Select this action to save the current flow as a new one without incorporating the changes made by the other user. The new flow is called ‘Copy of
Adding comments to your flow

To add a comment:
- Click the Add comment icon
on the top of the canvas.
- Right-click on the canvas where you want to add a comment, and select Add comment.
You can add comments to:
- Document your thought process and design decisions as you build flows.
- Attach detailed information to specific nodes, including complex logic, requirements, or implementation details.
- Leave comments for team members to facilitate collaboration and communication within the authoring UI.
- Capture context that is not represented in node configurations.
Comments remain attached to your flow and are available when you resume work, making it easier to maintain and understand complex event processing flows over time.
You can also show or hide your comments by using the Show comment 

Step 2: Configure an event source
- You need to provide the source of events that you want to process. To do this, start by adding an event source, select Add new event source > Next.
-
In the Cluster connection pane, provide the server address of the Kafka cluster that you want to connect to. You can get the server address for the event source from your cluster administrator.
Note: To add more addresses, click Add bootstrap server + and enter the server address.
- Click Next. The Access credentials pane is displayed.
- Provide the credentials that are required to access your Kafka cluster and topic. You can generate access credentials for accessing a stream of events from the Event Endpoint Management page. For more information, see subscribing to event endpoints.
- Click Next. The Topic selection pane is displayed.
- Use the radio buttons to confirm the name of the topic that you want to process events from.
-
Click Next. The Message format pane is displayed.
Event Processing introspects the latest message on the topic (assuming there are incoming messages), and detects if the message is in a supported format. If the format cannot be detected, manually choose the correct message format for the topic the event source is connecting to.
- Click Next to go to the Event details pane.
- In the Event details section, provide a name for your node. Leave the event source to be saved for later reuse. Saving the connection details makes creating similar event sources a lot quicker because there is no need to enter the same details again.
- In the Event structure section, clear the properties that are not relevant to define the structure of source events.
- Set an event time.
- Click Configure. The canvas is displayed and your event source node has a green checkmark, which indicates that the node has been configured successfully.
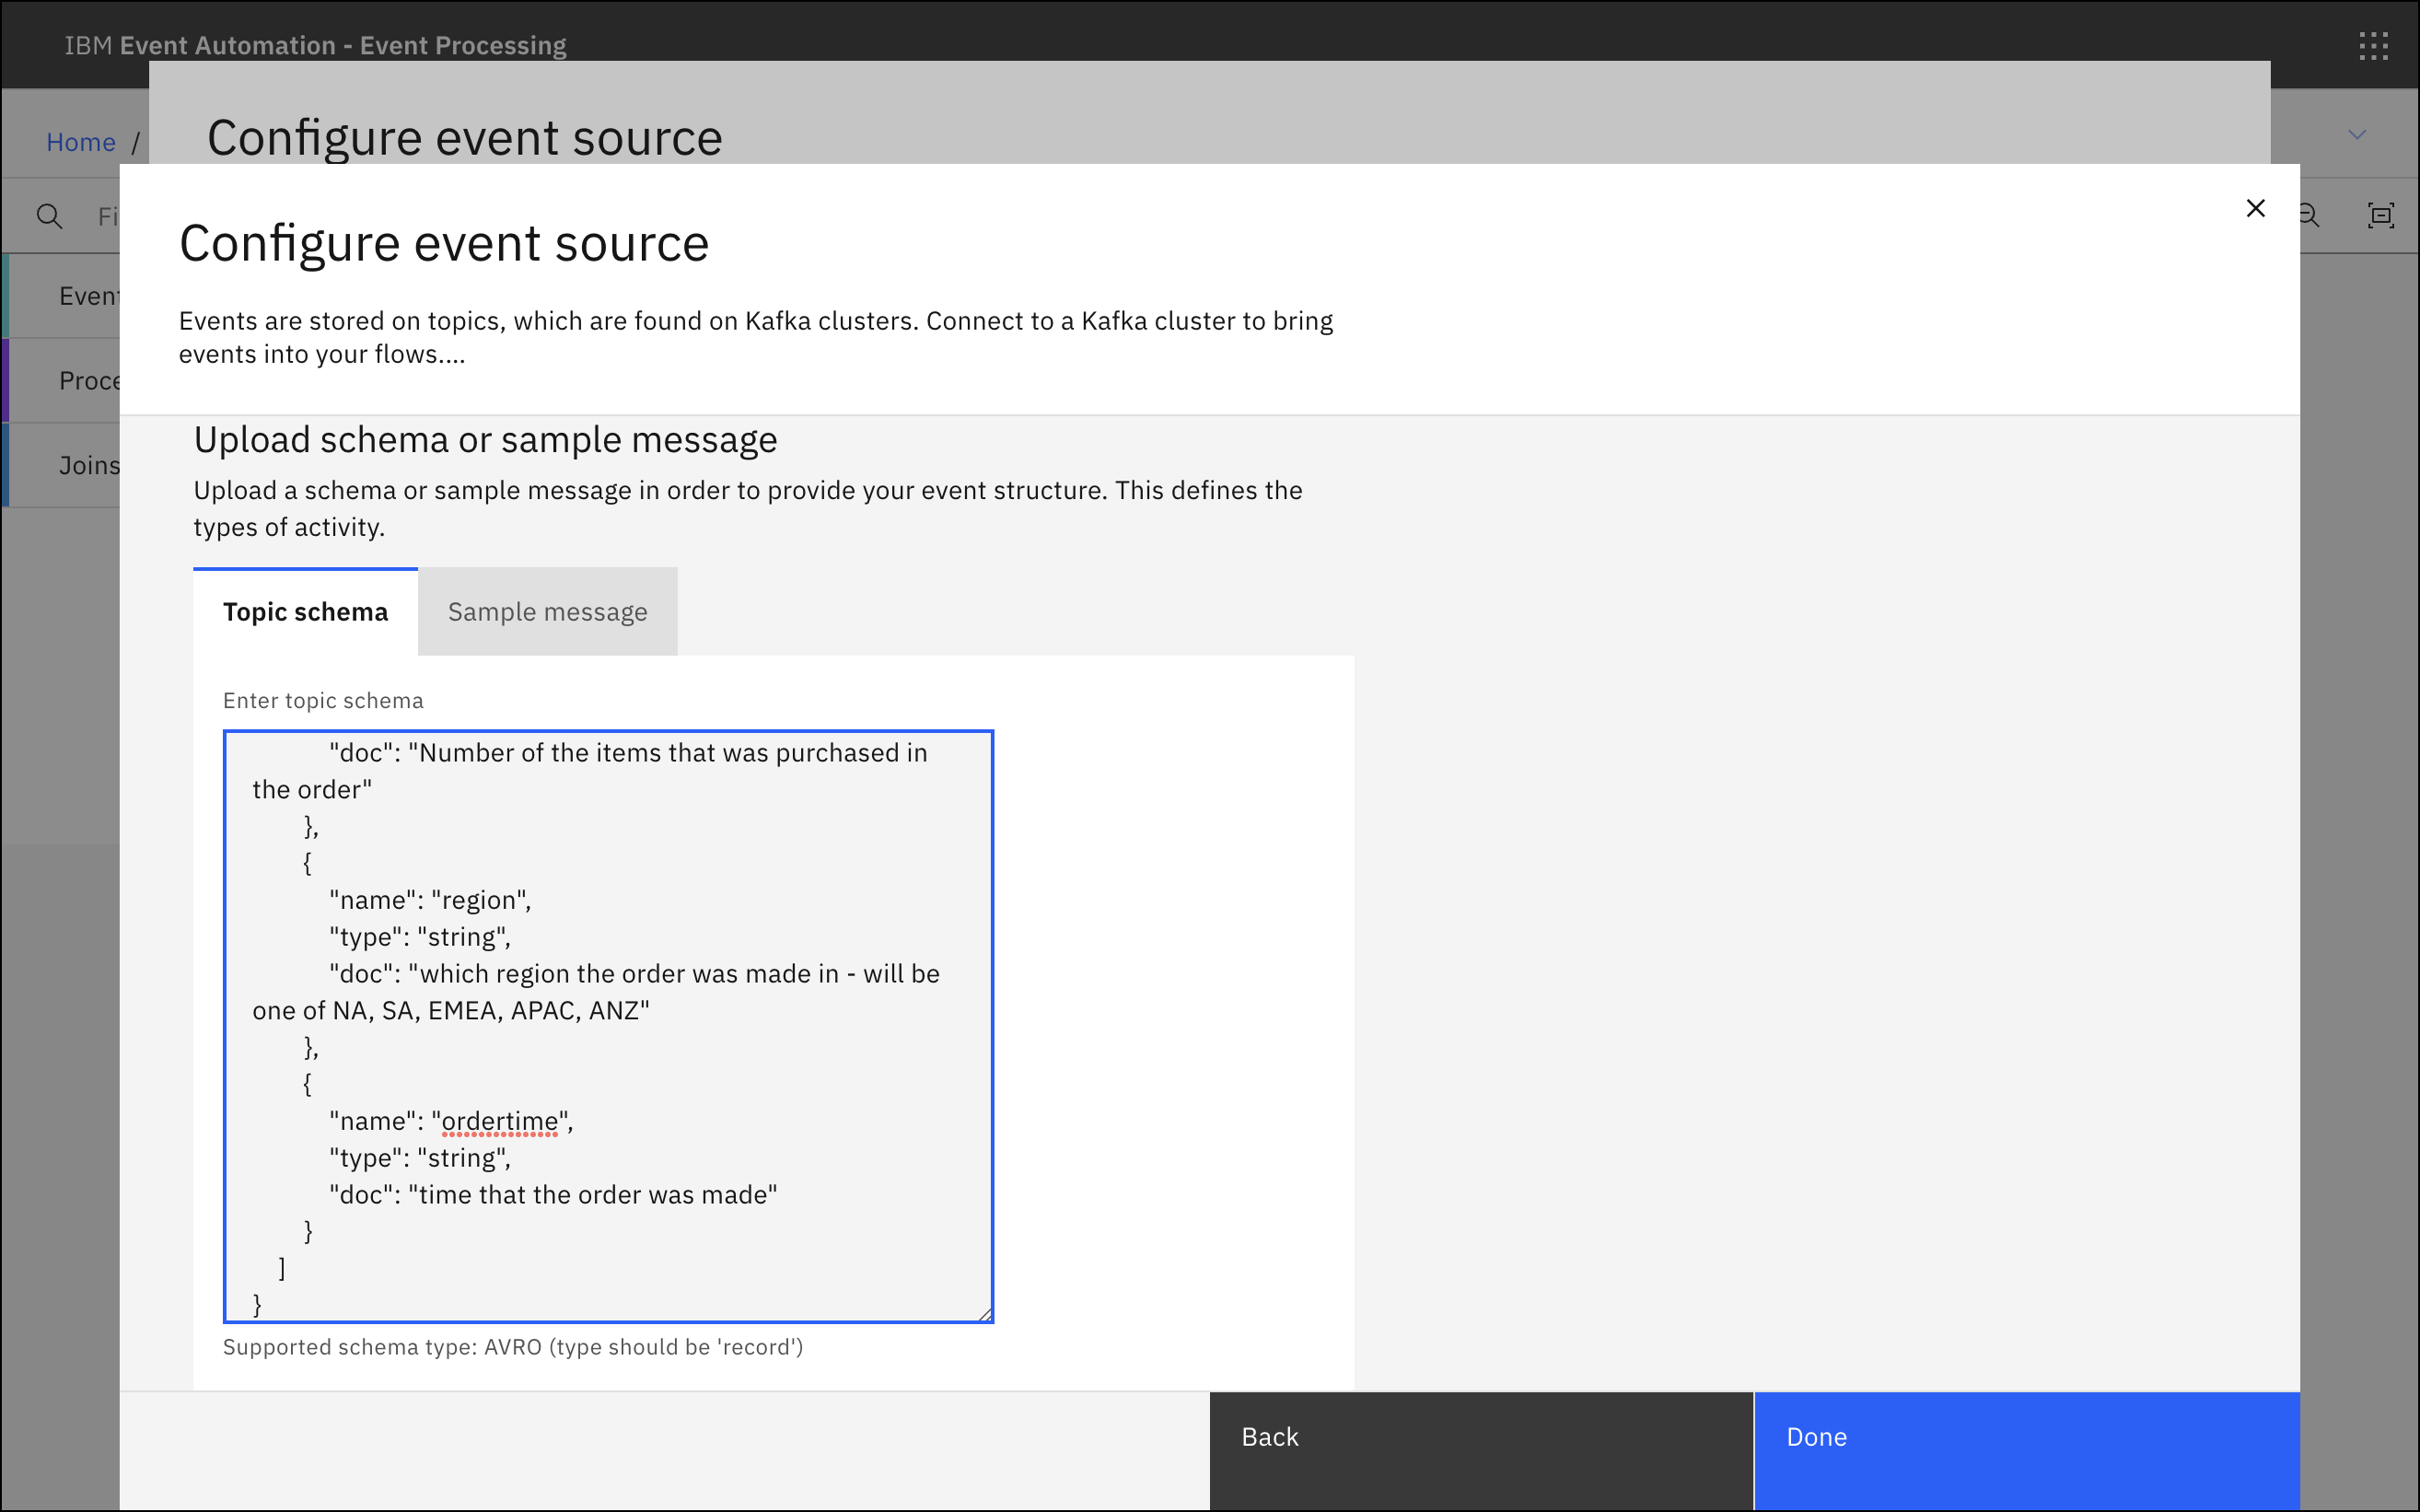
The clothing company called their event source Orders and used the schema for their Order events topic in Event Endpoint Management to update the topic schema tab in Event Processing.
Step 3: Add a filter
- On the Palette, in the Processors section, drag a Filter node onto the canvas.
- Drag the Output port on the event node to the Input port on the filter to join the two nodes together.
- Hover over the source node and click
Edit.
The Configure filter window is displayed.
Step 4: Configure the filter
- Now, you need to configure the filter that defines the events that you are interested in. To do this, in the Details section, provide a name for the filter node.
- Click Next. The Define filter section is displayed.
-
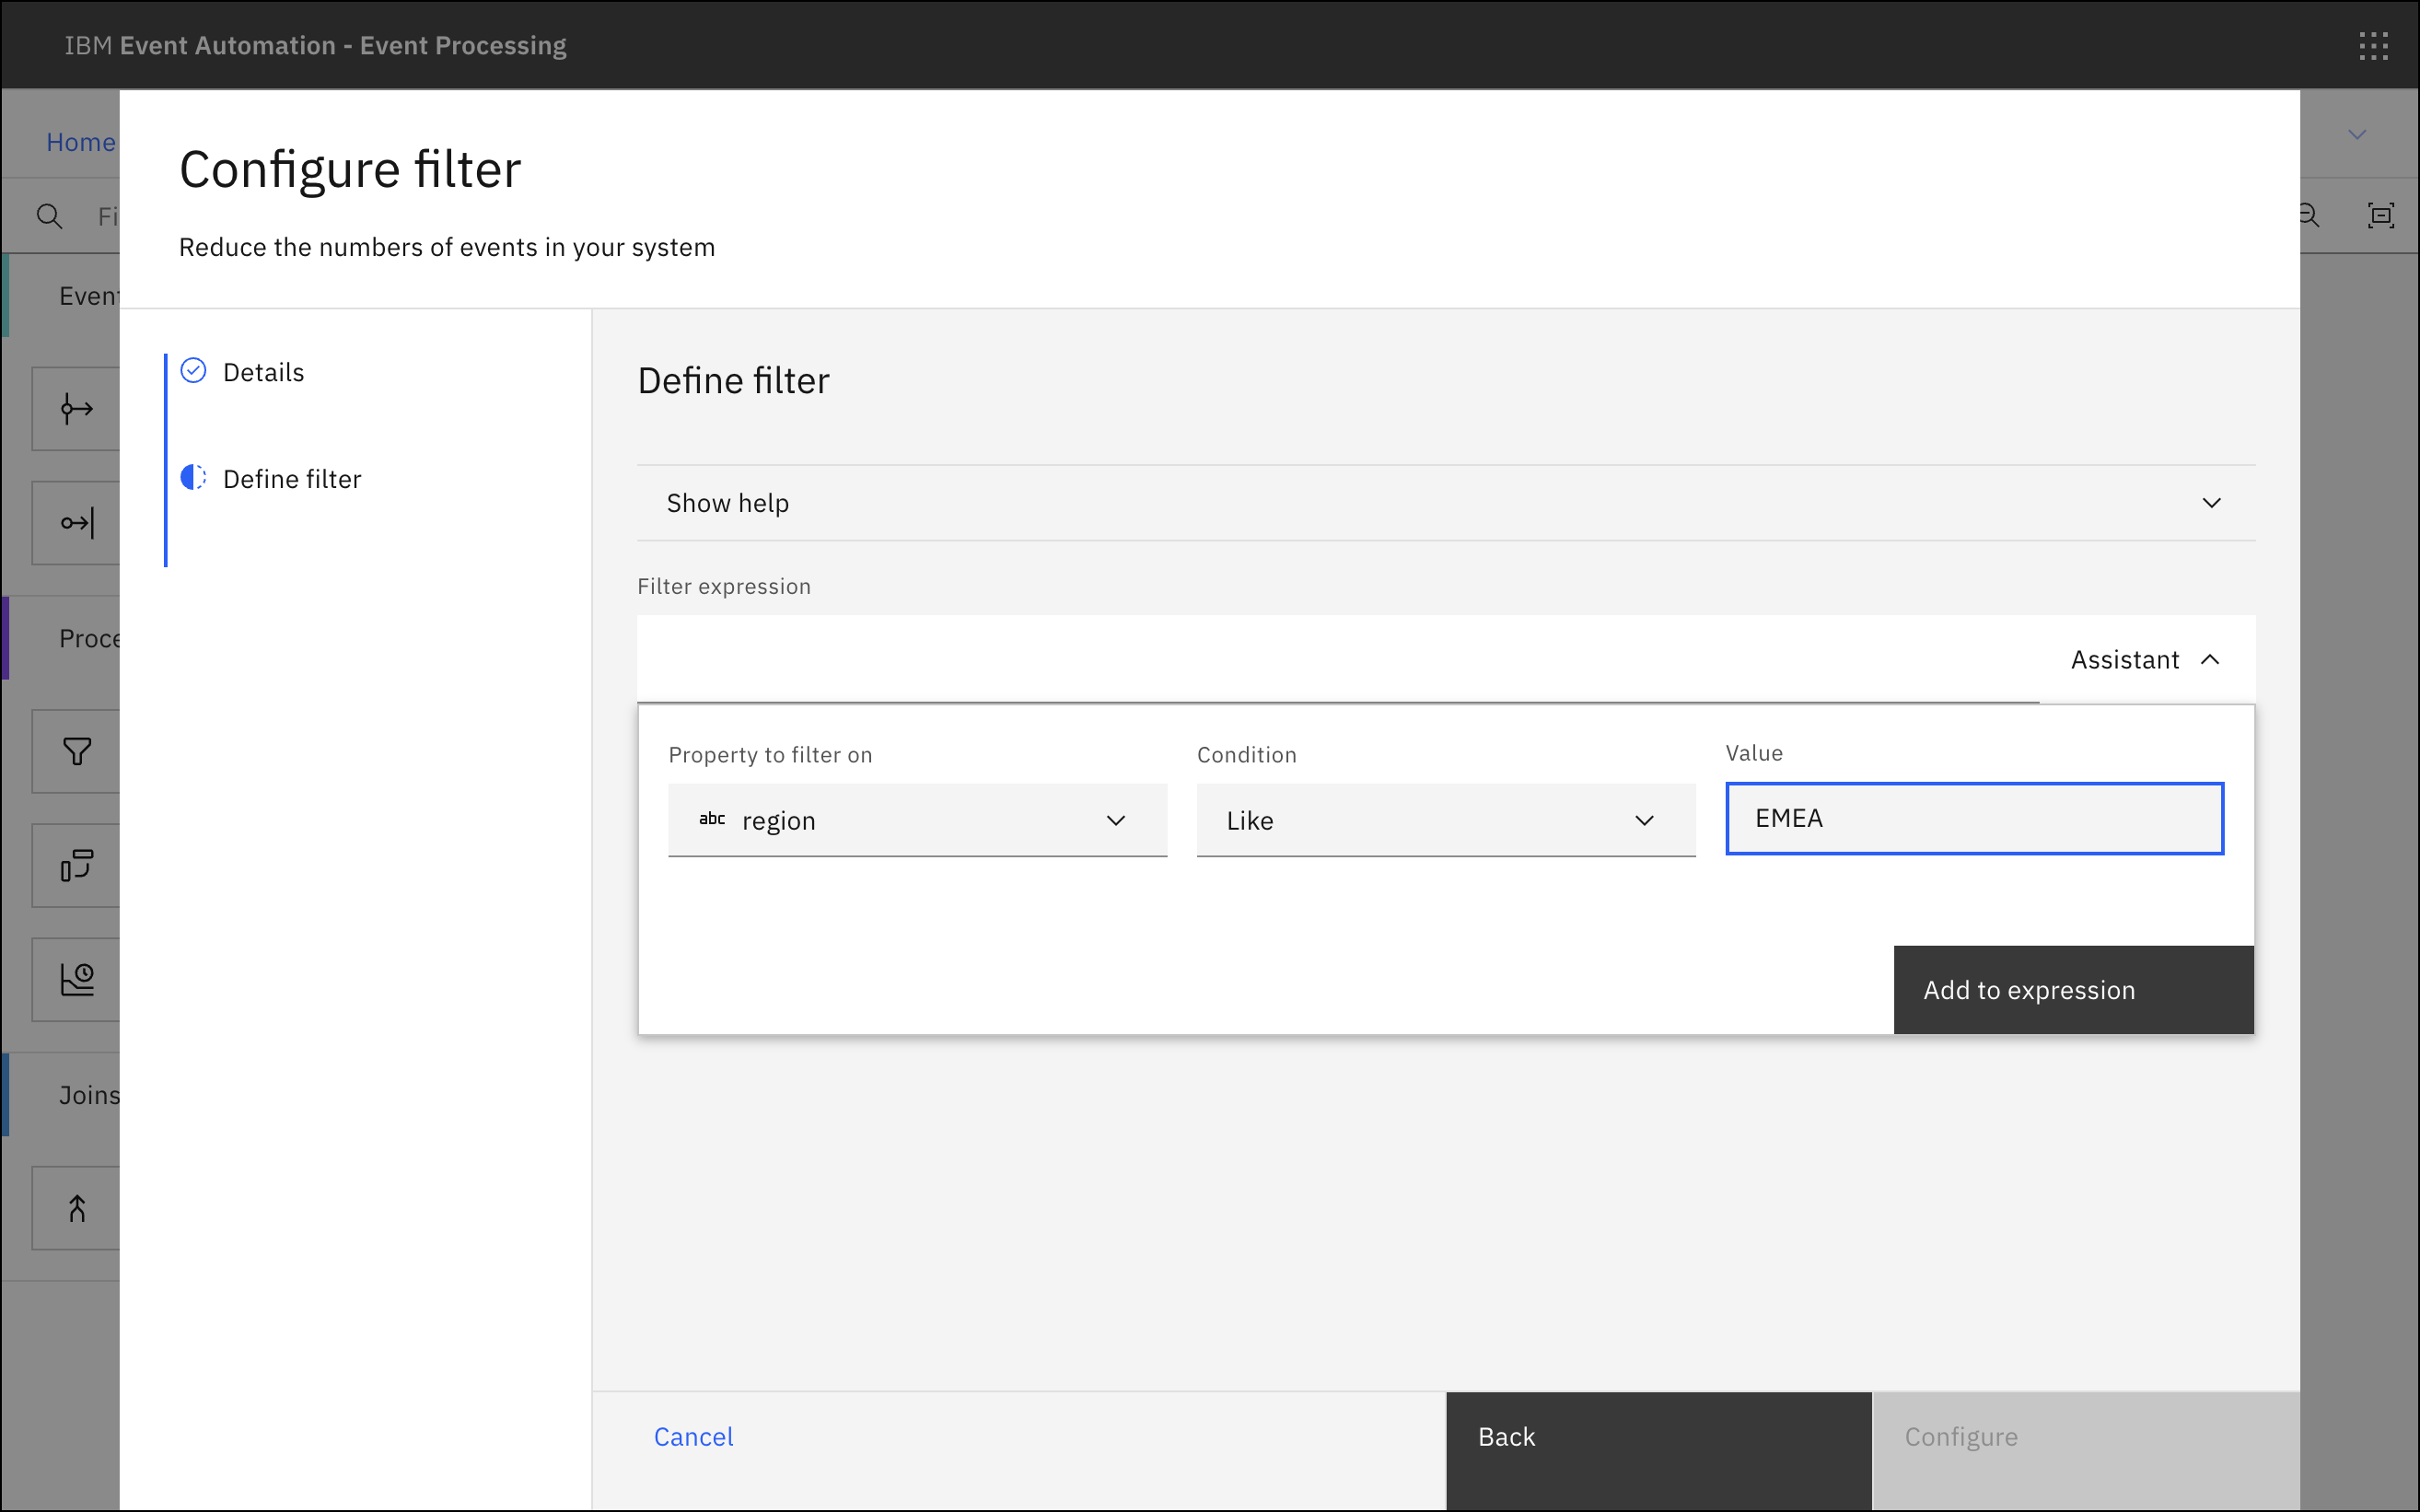
Click the Filter assistant to open the Filter assistant pane. Define a filter with your requirements by updating the Property, Condition, and Value fields.
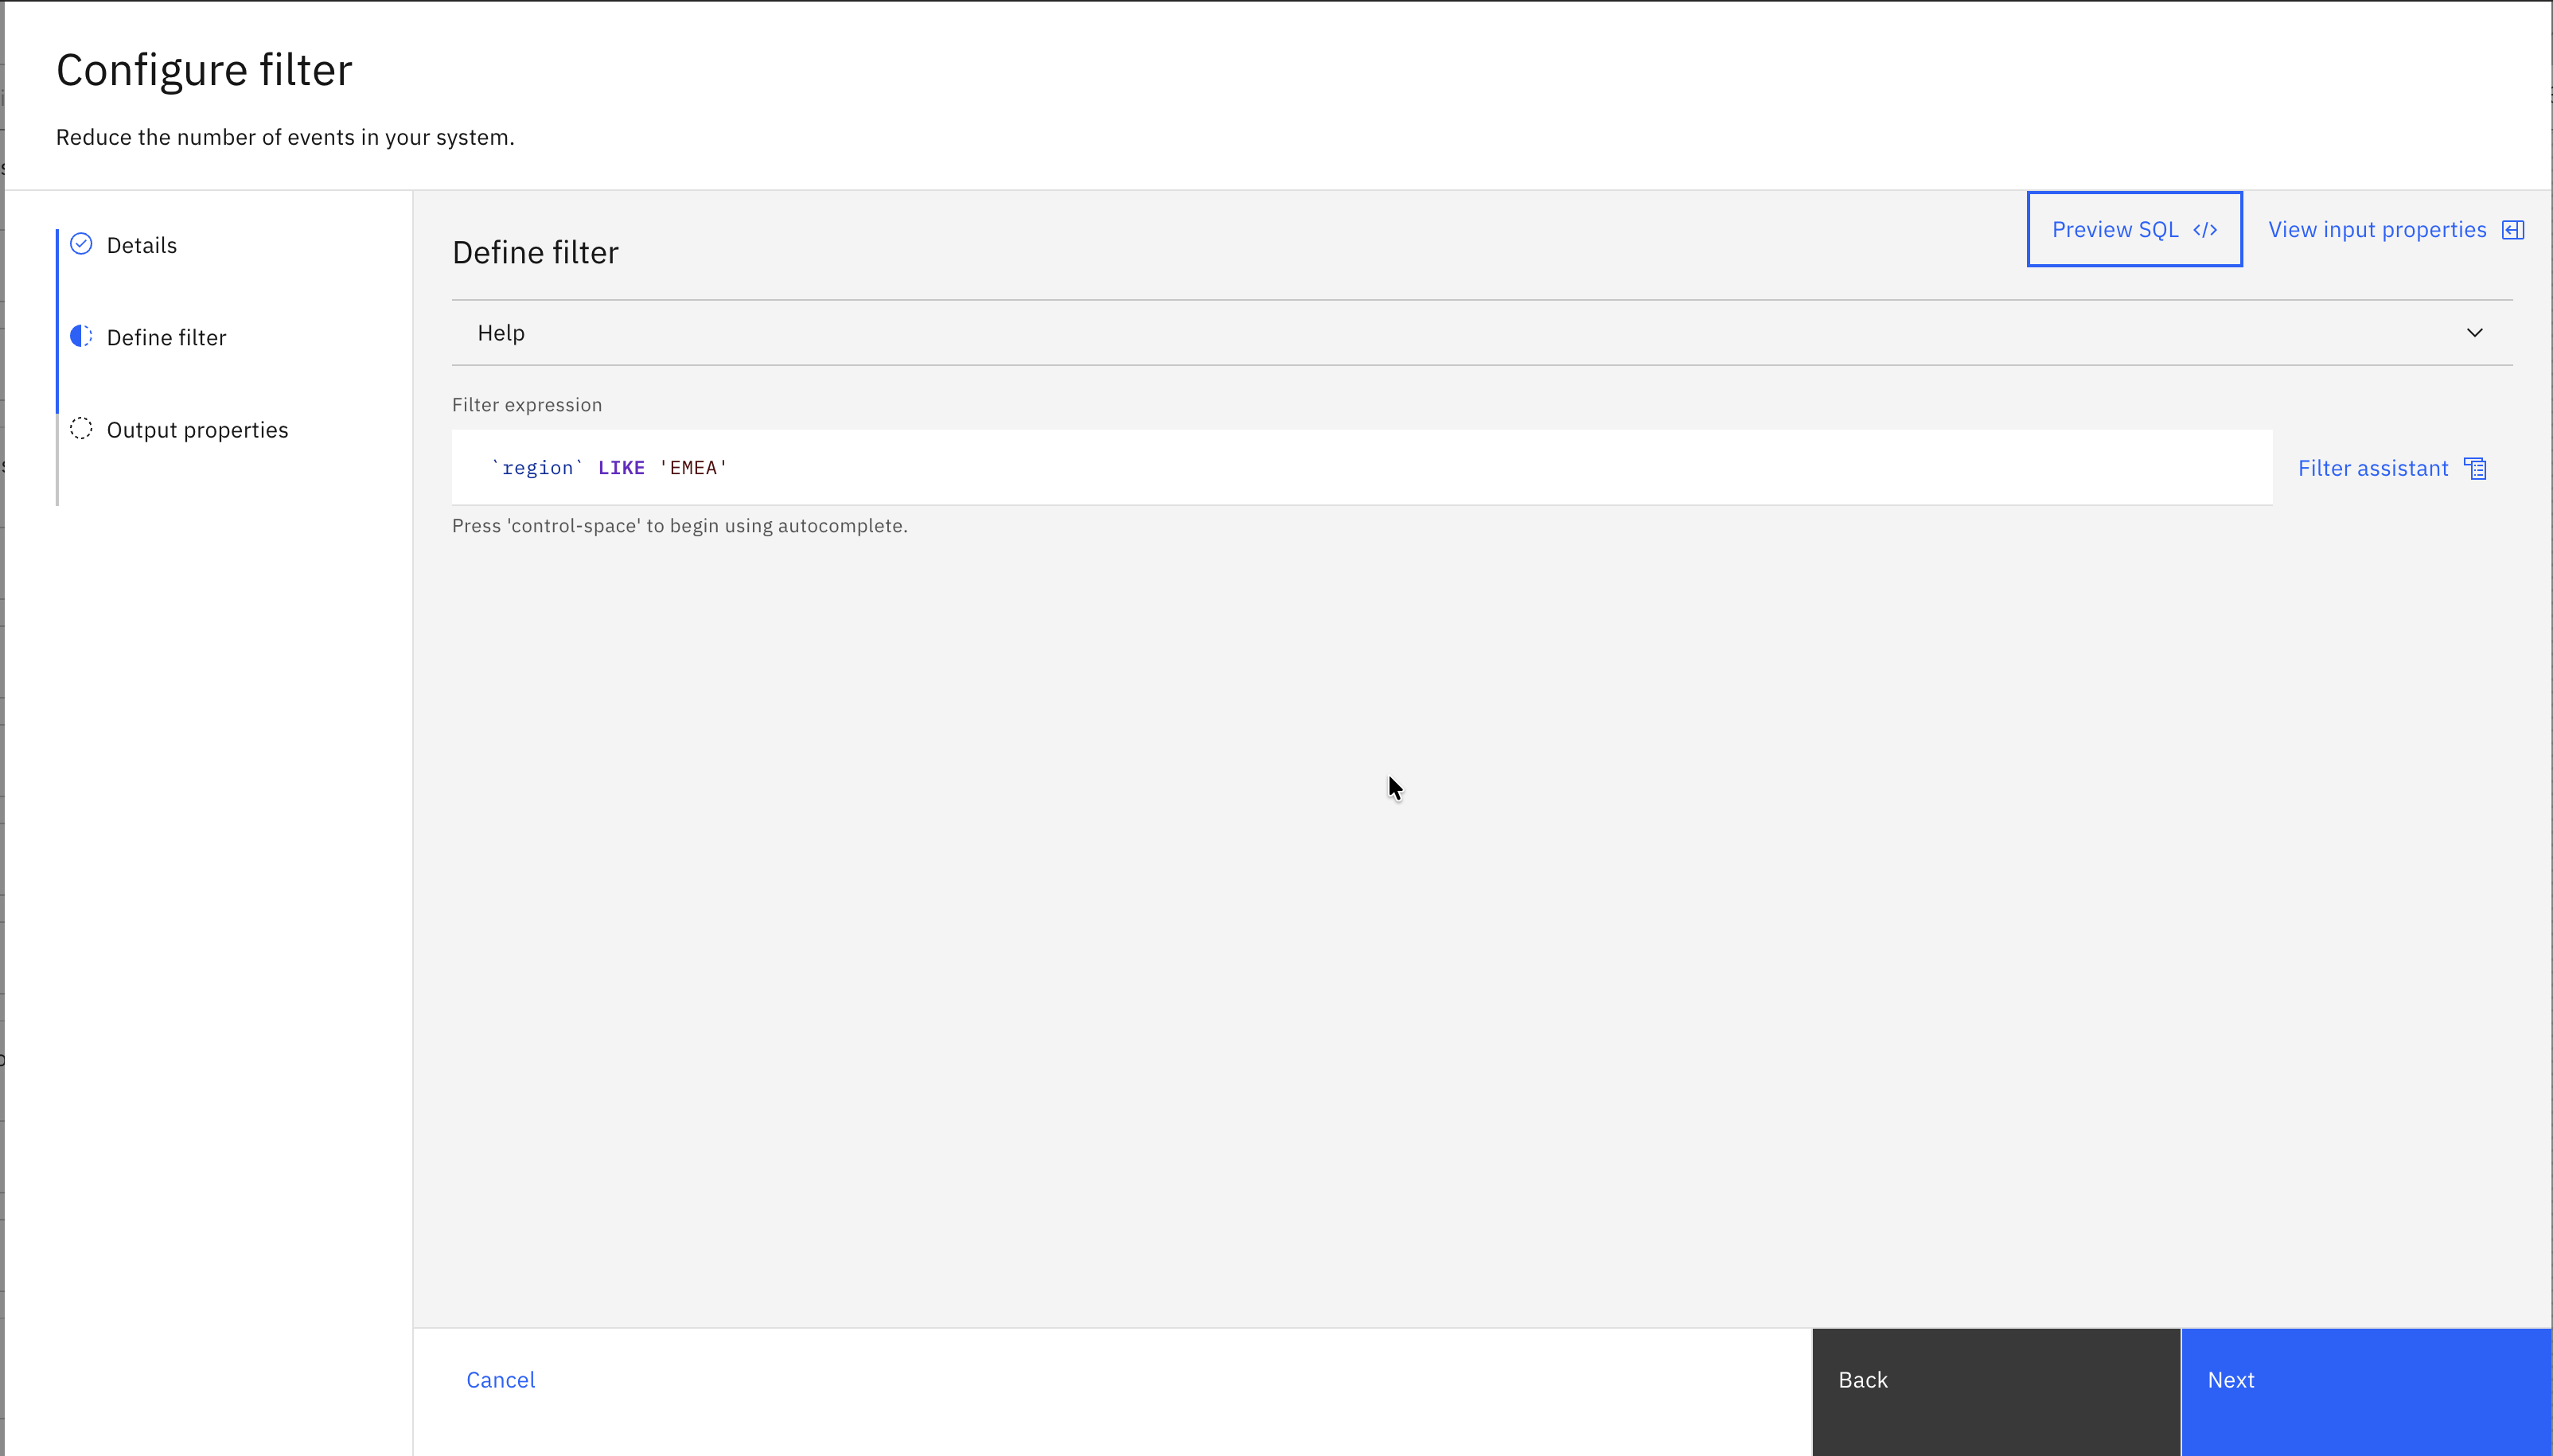
- Click Insert expression.
-
Click Next to open the Output properties pane. The properties that you added in the previous step are displayed in the Output properties pane. You can manage the properties that come from this node to suit your requirements.
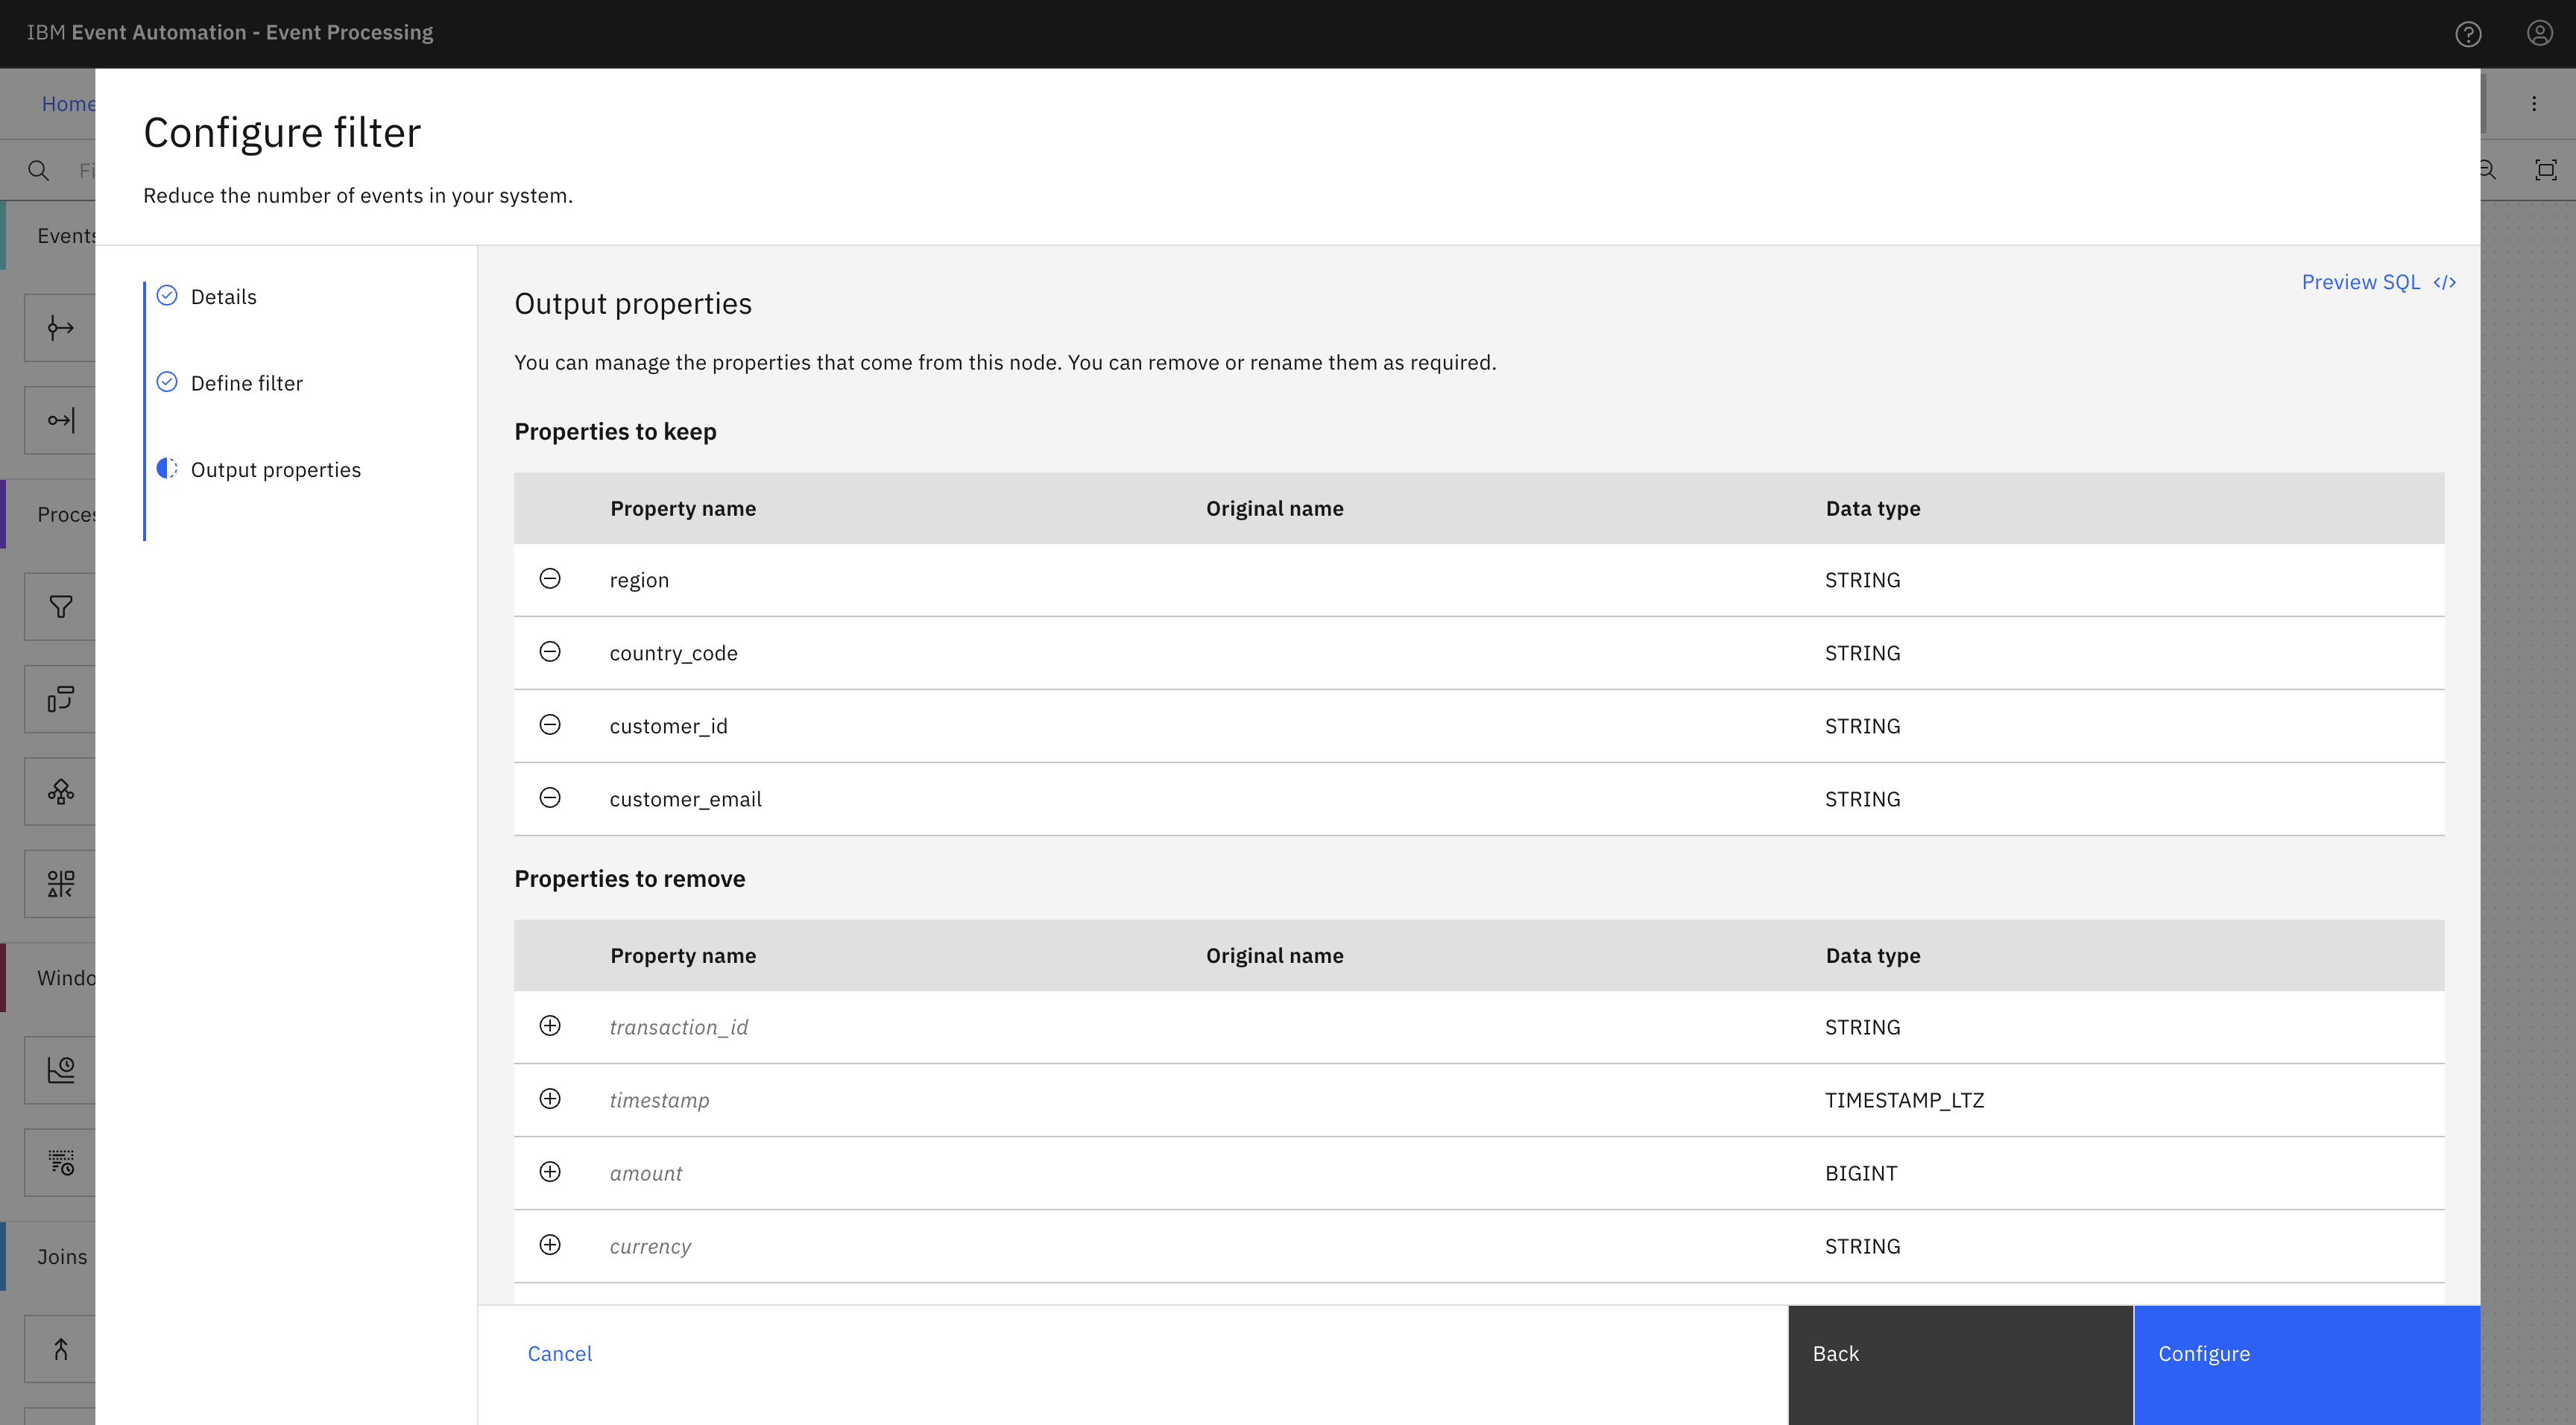
- Click Configure. The canvas is displayed, your filter node has a green checkmark, which indicates that the node has been configured successfully.
The clothing company called their filter EMEA orders and defined a filter that matches events with a region value of EMEA.
Step 5: Run the flow
- The last step is to run your Event Processing flow and view the results.
-
In the navigation banner, complete one of the following steps:
- If your flow includes any event sources, expand Run flow and select either Events from now or Include historical.
- If your flow uses SQL sources only, click Run flow to start the flow.
Note: The options to run your flow either Events from now or Include historical are shown only when the flow includes event sources. These options are not shown when all sources are SQL, because the start position is defined in the SQL query itself. If your flow includes only SQL sources (that is, no event source nodes), a single Run flow button is displayed instead.
A live view of results from your running flow automatically opens. The results view is showing the output from your flow - the result of processing any events that have been produced to your chosen Event Endpoint Management topic.
Tip: Include historical is useful while you are developing your flows because you don’t need to wait for new events to be produced to the topic. You can use all the events already on the Kafka topic to check that your flow is working the way that you want.
In the navigation banner, click Stop flow to stop the flow when you finish reviewing the results.
The clothing company selected Include historical to run the filter on the history of order events available on their Order events topic. All the orders from the EMEA region are displayed. This provides the company real-time information about orders placed in the region, and helps them review orders as they occur.
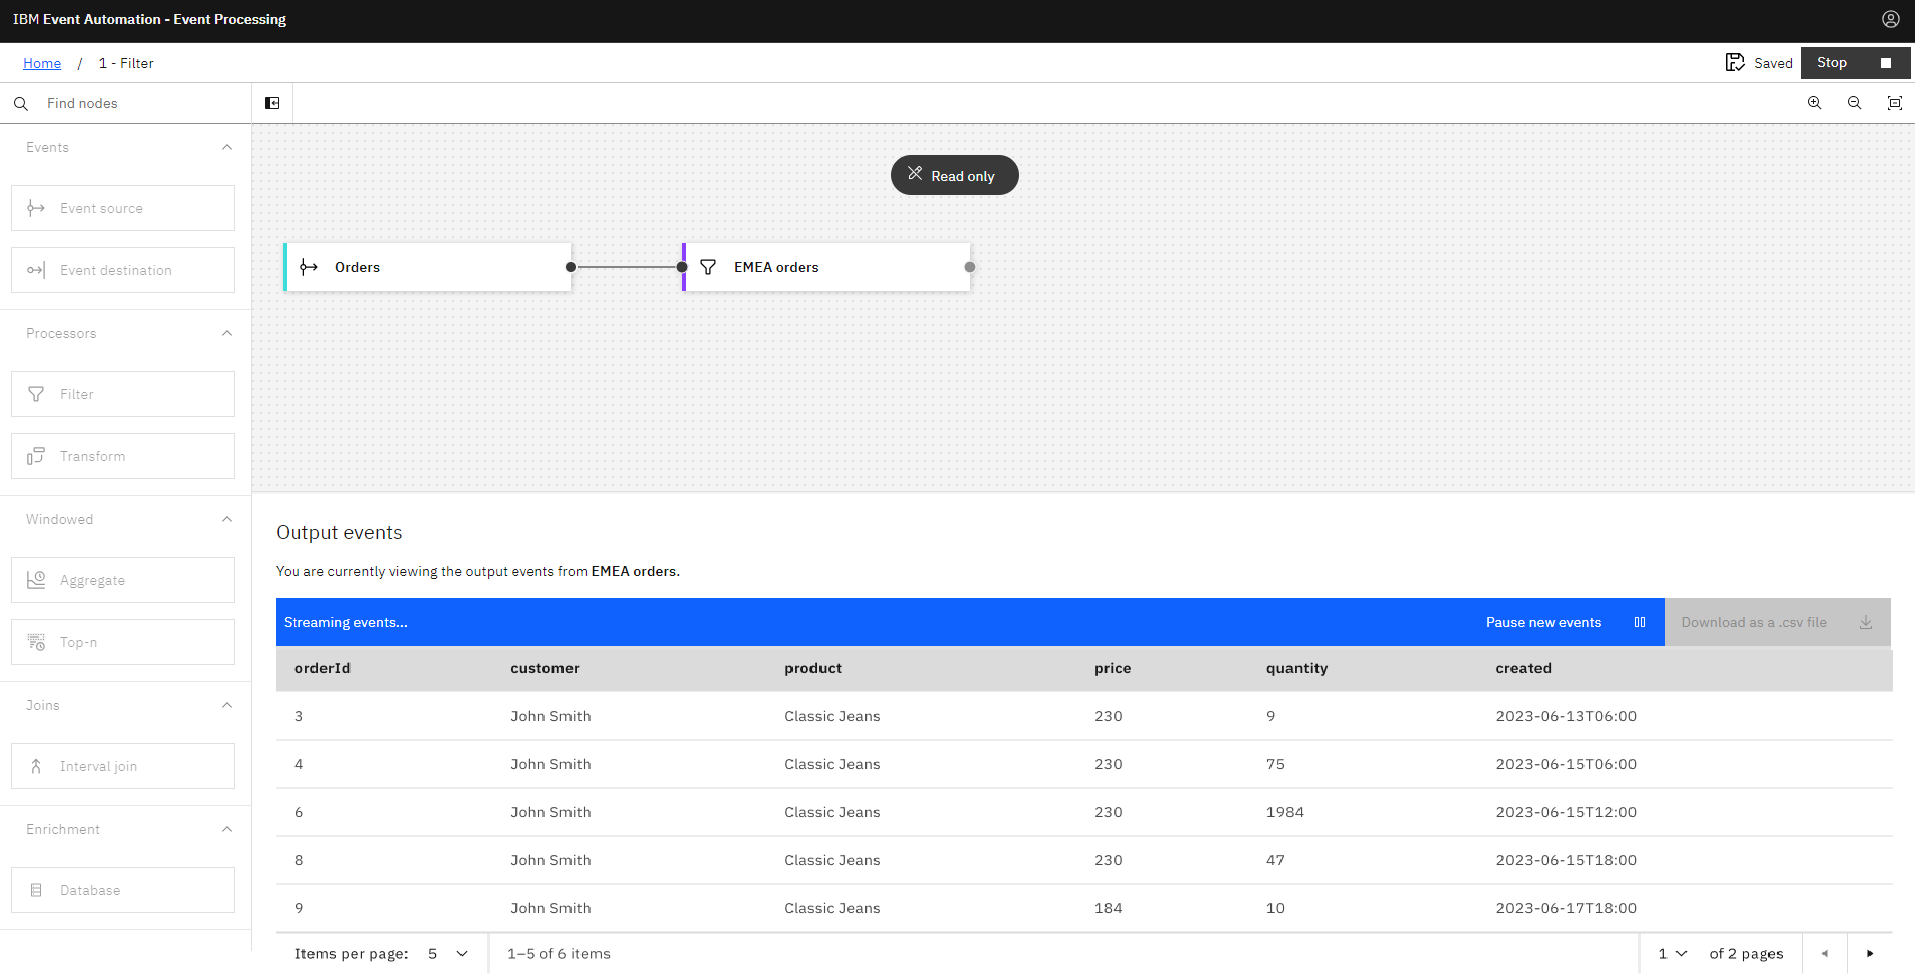
While running a flow, you can view the following information:
-
You can view the output events of any particular node by selecting the radio button
within a node after you run the flow. You can also filter rows by searching a particular text in the Search for events field located on top of the Output events table. Spaces are included and the text that you enter is case-insensitive. Matching texts in rows are highlighted.
To view the output events of a complete flow, you can select the radio button of the last node in your flow. By default, the last node in the flow is selected.
-
You can check the number of output events represented by the icon
next to each node in the canvas. Additionally, the number of output events for the selected node is also displayed on top of the results table. The number of output events is updated even while the refresh of the output events table is paused.
-
You can view Flink watermarks in the UTC format next to each node in the canvas. This view is not enabled by default. To view watermarks next to nodes in the canvas, click the Customize view icon
, and select Show Flink watermark
. Additionally, the watermark for the selected node is also displayed on top of the results table.
You can also hide the number of output events or the Flink watermarks by unselecting the respective options.
Note: If you leave the page without stopping the flow by navigating to the home page or by closing the browser tab, when you return to the flow, the number of events, watermarks, and the output events are those that occur after you returned to the flow.
The following customization features are available for the Output events table:
- You can compare the output events of any two nodes while running the flow. After you run the flow, select the Multi node view tab in the Output events table, and select any two nodes that you want to compare. This tab displays the output events of the two nodes side-by-side. For example, you can compare the output events of the
Ordersnode and theEMEA ordersnode. -
You can show or hide properties, and reorder them by clicking the Customize columns icon
in the Output events table:
- Clear the column that you do not want to view in the Output events table.
- Drag a column name to reorder the columns.
Note:
- The customization impacts only the output events table in the Event Processing UI. It has no effect on the output events exported in CSV format, nor on Kafka output topics.
- The customization persists while the flow is running, and is cleared when reloading the page in the browser or stopping the flow.
Flow statuses
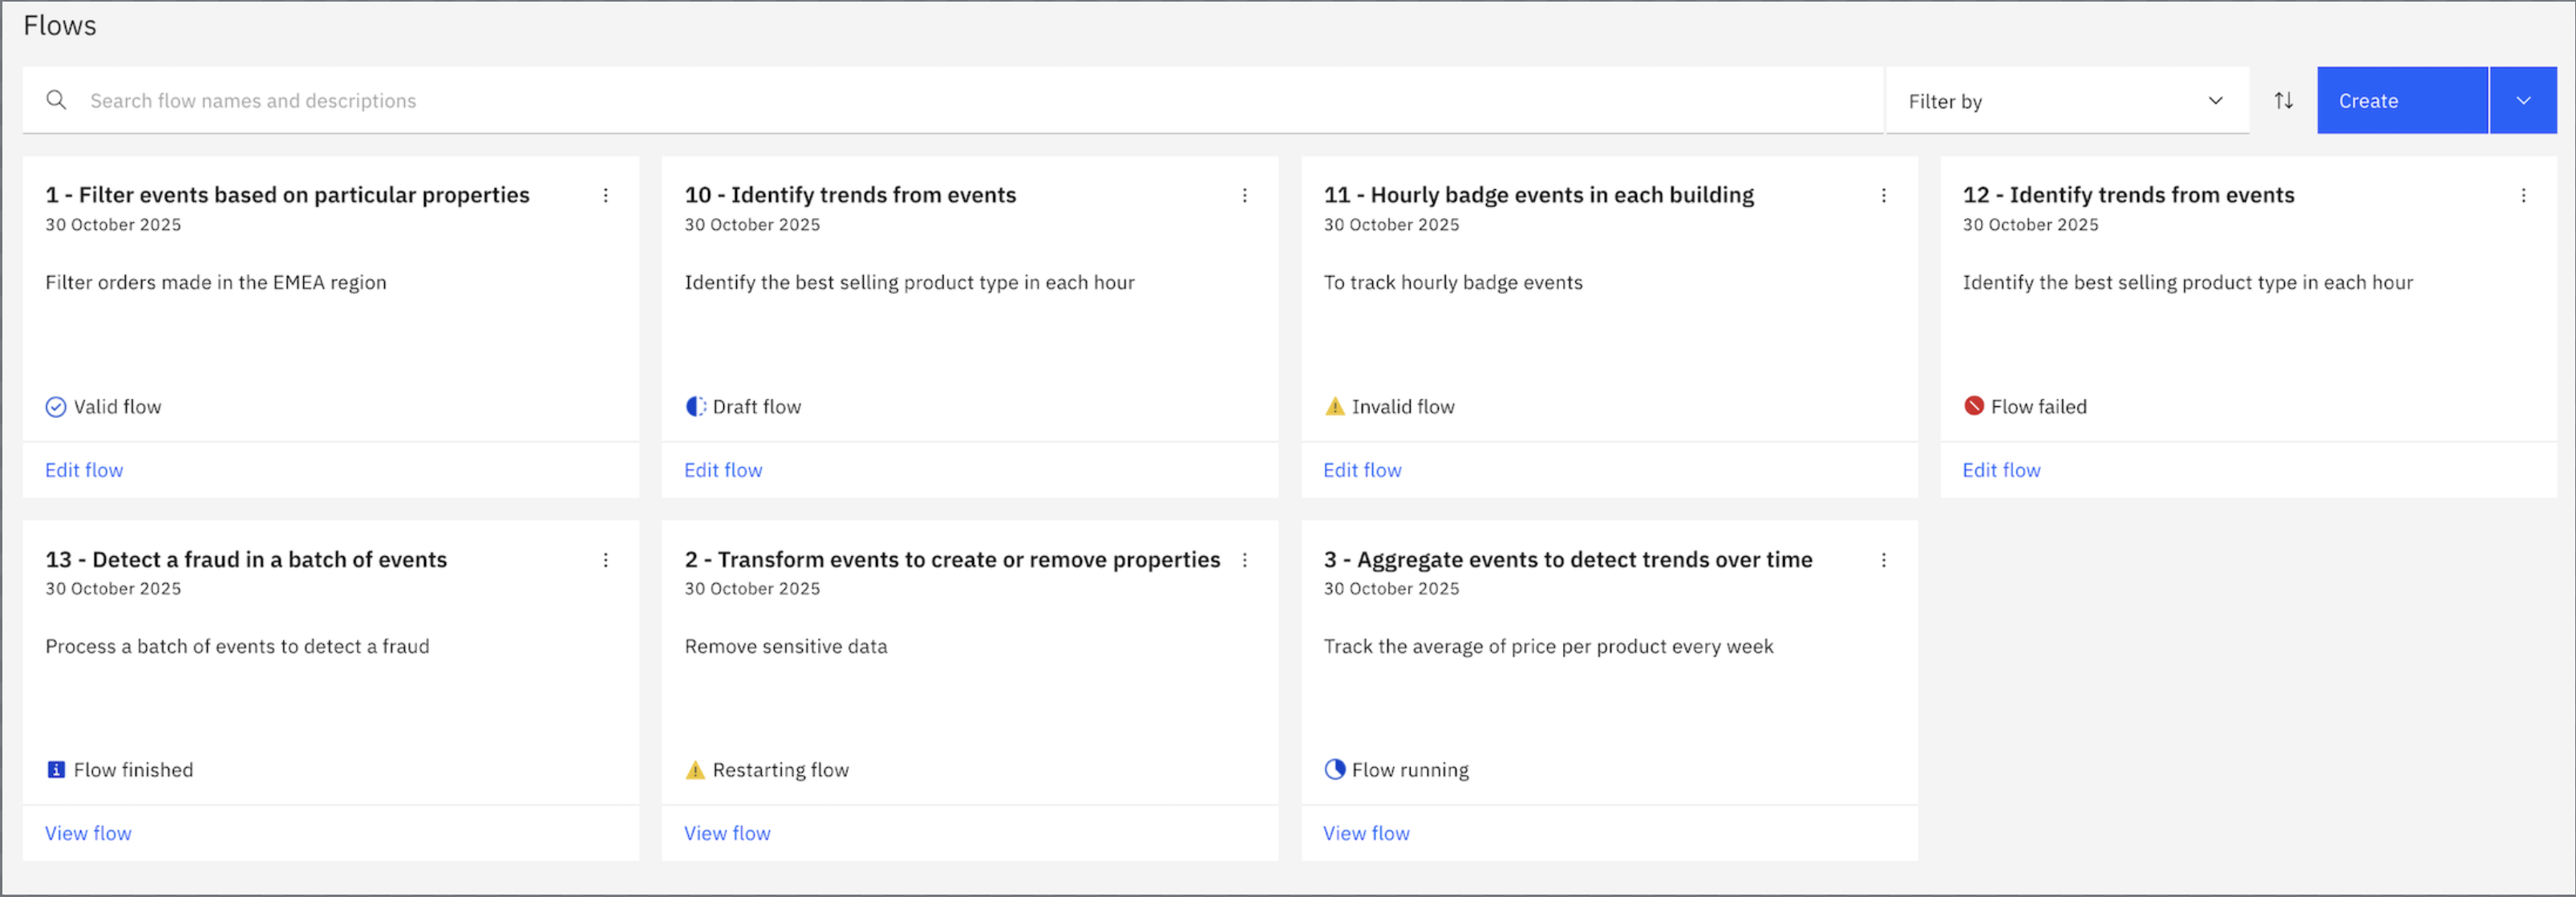
A flow status indicates the current state of the flow and its underlying Flink job. To view the status of a flow, navigate to the Flows section on the home page of the Event Processing UI. Each flow tile displays the current status of the flow.
-
Authoring: the authoring flow states appear only on the tiles of the home page. The following states indicate the validation status of the flow:
- Draft flow: Indicates that the flow includes one or more nodes that need to be configured. The flow cannot be run.
- Valid flow: Indicates that all nodes in the flow are configured and valid. The flow is ready to run.
- Invalid flow: Indicates that the nodes in the flow are configured but have a validation error, or a required node is missing. The flow cannot be run.
-
Execution: the execution flow states are visible on the tiles of the home page and in the live view of results. The following flow states represent the different stages of execution:
- Submitting flow: The flow is being submitted to a JobManager.
- Deploying flow: The JobManager is creating and initializing a Flink job on a Task Manager to execute the flow.
- Flow running: The Flink job is executing the flow.
- Restarting flow: The Flink job has encountered an error and is attempting to restart automatically.
- Stopping flow: The Flink job is stopping.
- Flow stopped: The Flink job is stopped.
- Flow failed: The Flink job is stopped. An error was encountered during its execution.
- Flow finished: The Flink job has finished processing all the events of its bounded event sources.
- JobManager unavailable: The JobManager that was executing a Flink job is restarting or not present.
- Job missing: The JobManager on which a Flink job was running has restarted in non high-availability mode. As a result, the Flink job cannot be recovered.
Tip: You can click the icon next to Flow invalid and Flow failed states to find more information about the error.
