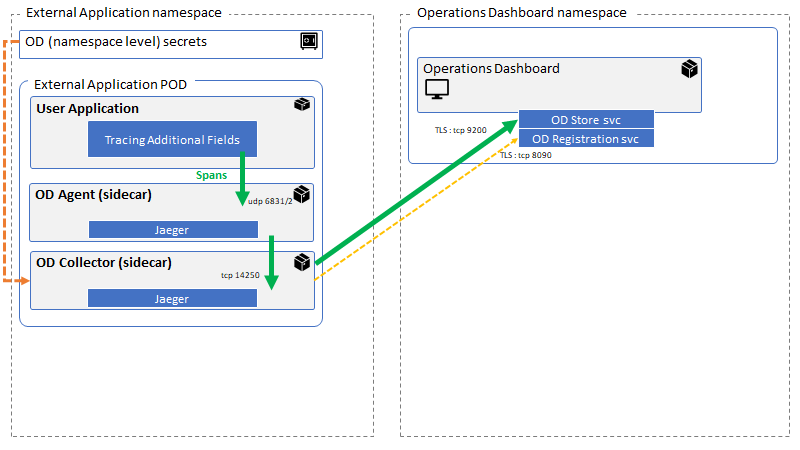
Event Streams 10.0.0 and later versions are built on Strimzi. Strimzi 0.14.0 and later support distributed tracing based on the open-source OpenTracing and Jaeger projects.
Distributed tracing provides a way to understand how applications work across processes, services, or networks. Tracing uses the trail they leave behind based on requests made, carrying tracing information in the requests as they pass from system to system. Through tracing, you can monitor applications that work with Event Streams, helping you to understand the shape of the generated traffic, and pinpoint the causes of any potential problems.
To use distributed tracing for your Kafka client applications, you add code to your applications that gets called on the client’s send and receive operations. This code adds headers to the client’s messages to carry tracing information. As such, Event Streams provides support for tracing through IBM Cloud Pak for Integration. Your applications can send tracing data into the IBM Cloud Pak for Integration Operations Dashboard runtime as “external applications”.
Deployment architecture
To send tracing data to the IBM Cloud Pak for Integration Operations Dashboard, the Kafka client application must be deployed into the same OpenShift Container Platform cluster as IBM Cloud Pak for Integration. The application runs in a pod into which two sidecar containers are added, one for the tracing agent and one for the tracing collector.
The Kafka client OpenTracing code runs as part of your application. It forwards tracing spans over UDP to the agent. The agent decides which spans are to be sampled and forwards those over TCP to the collector. The collector forwards the data securely to the Operations Dashboard Store in the Operations Dashboard namespace.

The namespace in which the application runs must be registered with the Operations Dashboard. The registration process creates a secret which is used by the collector to communicate securely with the Operations Dashboard Store.
Preparing your application to use tracing
For detailed instructions about how to use Operations Dashboard with external applications, see the IBM Cloud Pak for Integration documentation.
At a high level, the steps required are as follows.
Step 1 - Configure the Operations Dashboard to display external applications tracing data
To enable the Operations Dashboard to display tracing data from external applications:
- Log into IBM Cloud Pak for Integration.
- Open the Operations Dashboard Web Console by clicking Tracing in the Platform Navigator.
- Navigate to System Parameters > Display in the Manage section of the console.
- In the Display settings, set Show external app data in the dashboards to true, and click Update.
Now the Operations Dashboard is ready to receive data from external applications.
Step 2 - Modify your application code to enable tracing
The most convenient way to enable tracing in a Kafka application is to use the Kafka client integration which has been contributed to the OpenTracing project. Then you have a choice of configuring OpenTracing interceptors and using the regular KafkaProducer and KafkaConsumer classes, or using Tracing variants of the KafkaProducer and KafkaConsumer which wrap the real classes. The latter is more flexible but requires additional code changes to the application.
There are sample applications which show you how to do this. You can clone the repository and build them yourself, or copy the techniques for your own applications.
Step 3 - Deploy your application with the agent and collector sidecar containers
After it is built, you can deploy your application, complete with the Operations Dashboard agent and collector containers. Without these additional containers, your application will not be able to communicate with the Operations Dashboard Store and your tracing data will not appear. The sample applications include an example of the Kubernetes deployment that includes these containers.
Slightly unusually, when you deploy your application, you’ll notice that it’s running normally but the two sidecar container are not starting successfully. That’s because they depend upon a Kubernetes secret that contains credentials to connect to the OD Store. The next step creates that secret and enables the containers to start.
Step 4 - Complete the registration process for the application
The final stage is to use the Operations Dashboard Web Console for registering the external application to Operations Dashboard.
To enable the Operations Dashboard to display tracing data from external applications:
- Log into IBM Cloud Pak for Integration.
- Open the Operations Dashboard Web Console by clicking Tracing in the Platform Navigator.
- Navigate to System Parameters > Registration requests in the Manage section of the console.
- In the list of registration requests, approve the request for your application’s namespace.
- Copy the command displayed by the console, and run it to create the Kubernetes secret which enables your application to send data to the Operations Dashboard Store.
Using the Operations Dashboard to view tracing information
You can use the IBM Cloud Pak for Integration Operations Dashboard to view tracing information and analyze spans.
For more information about setting up, using, and managing the dashboard, see the IBM Cloud Pak for Integration documentation.
