Query History
The QUERY HISTORY view lists previously run SQL statements. Run at least one SQL statement from the Db2 SQL Editor for history entries to appear. You can open a history entry to view status details and results.
Viewing queries in Query History
-
On the DB2 CONNECTIONS pane, locate QUERY HISTORY and expand it.
This section lists all previously run queries, which are grouped by timestamp and sorted in reverse chronological order, by default.
-
Find the timestamped query record that you want to inspect and click it to show the Statement summary.
Statement summary shows the following details:
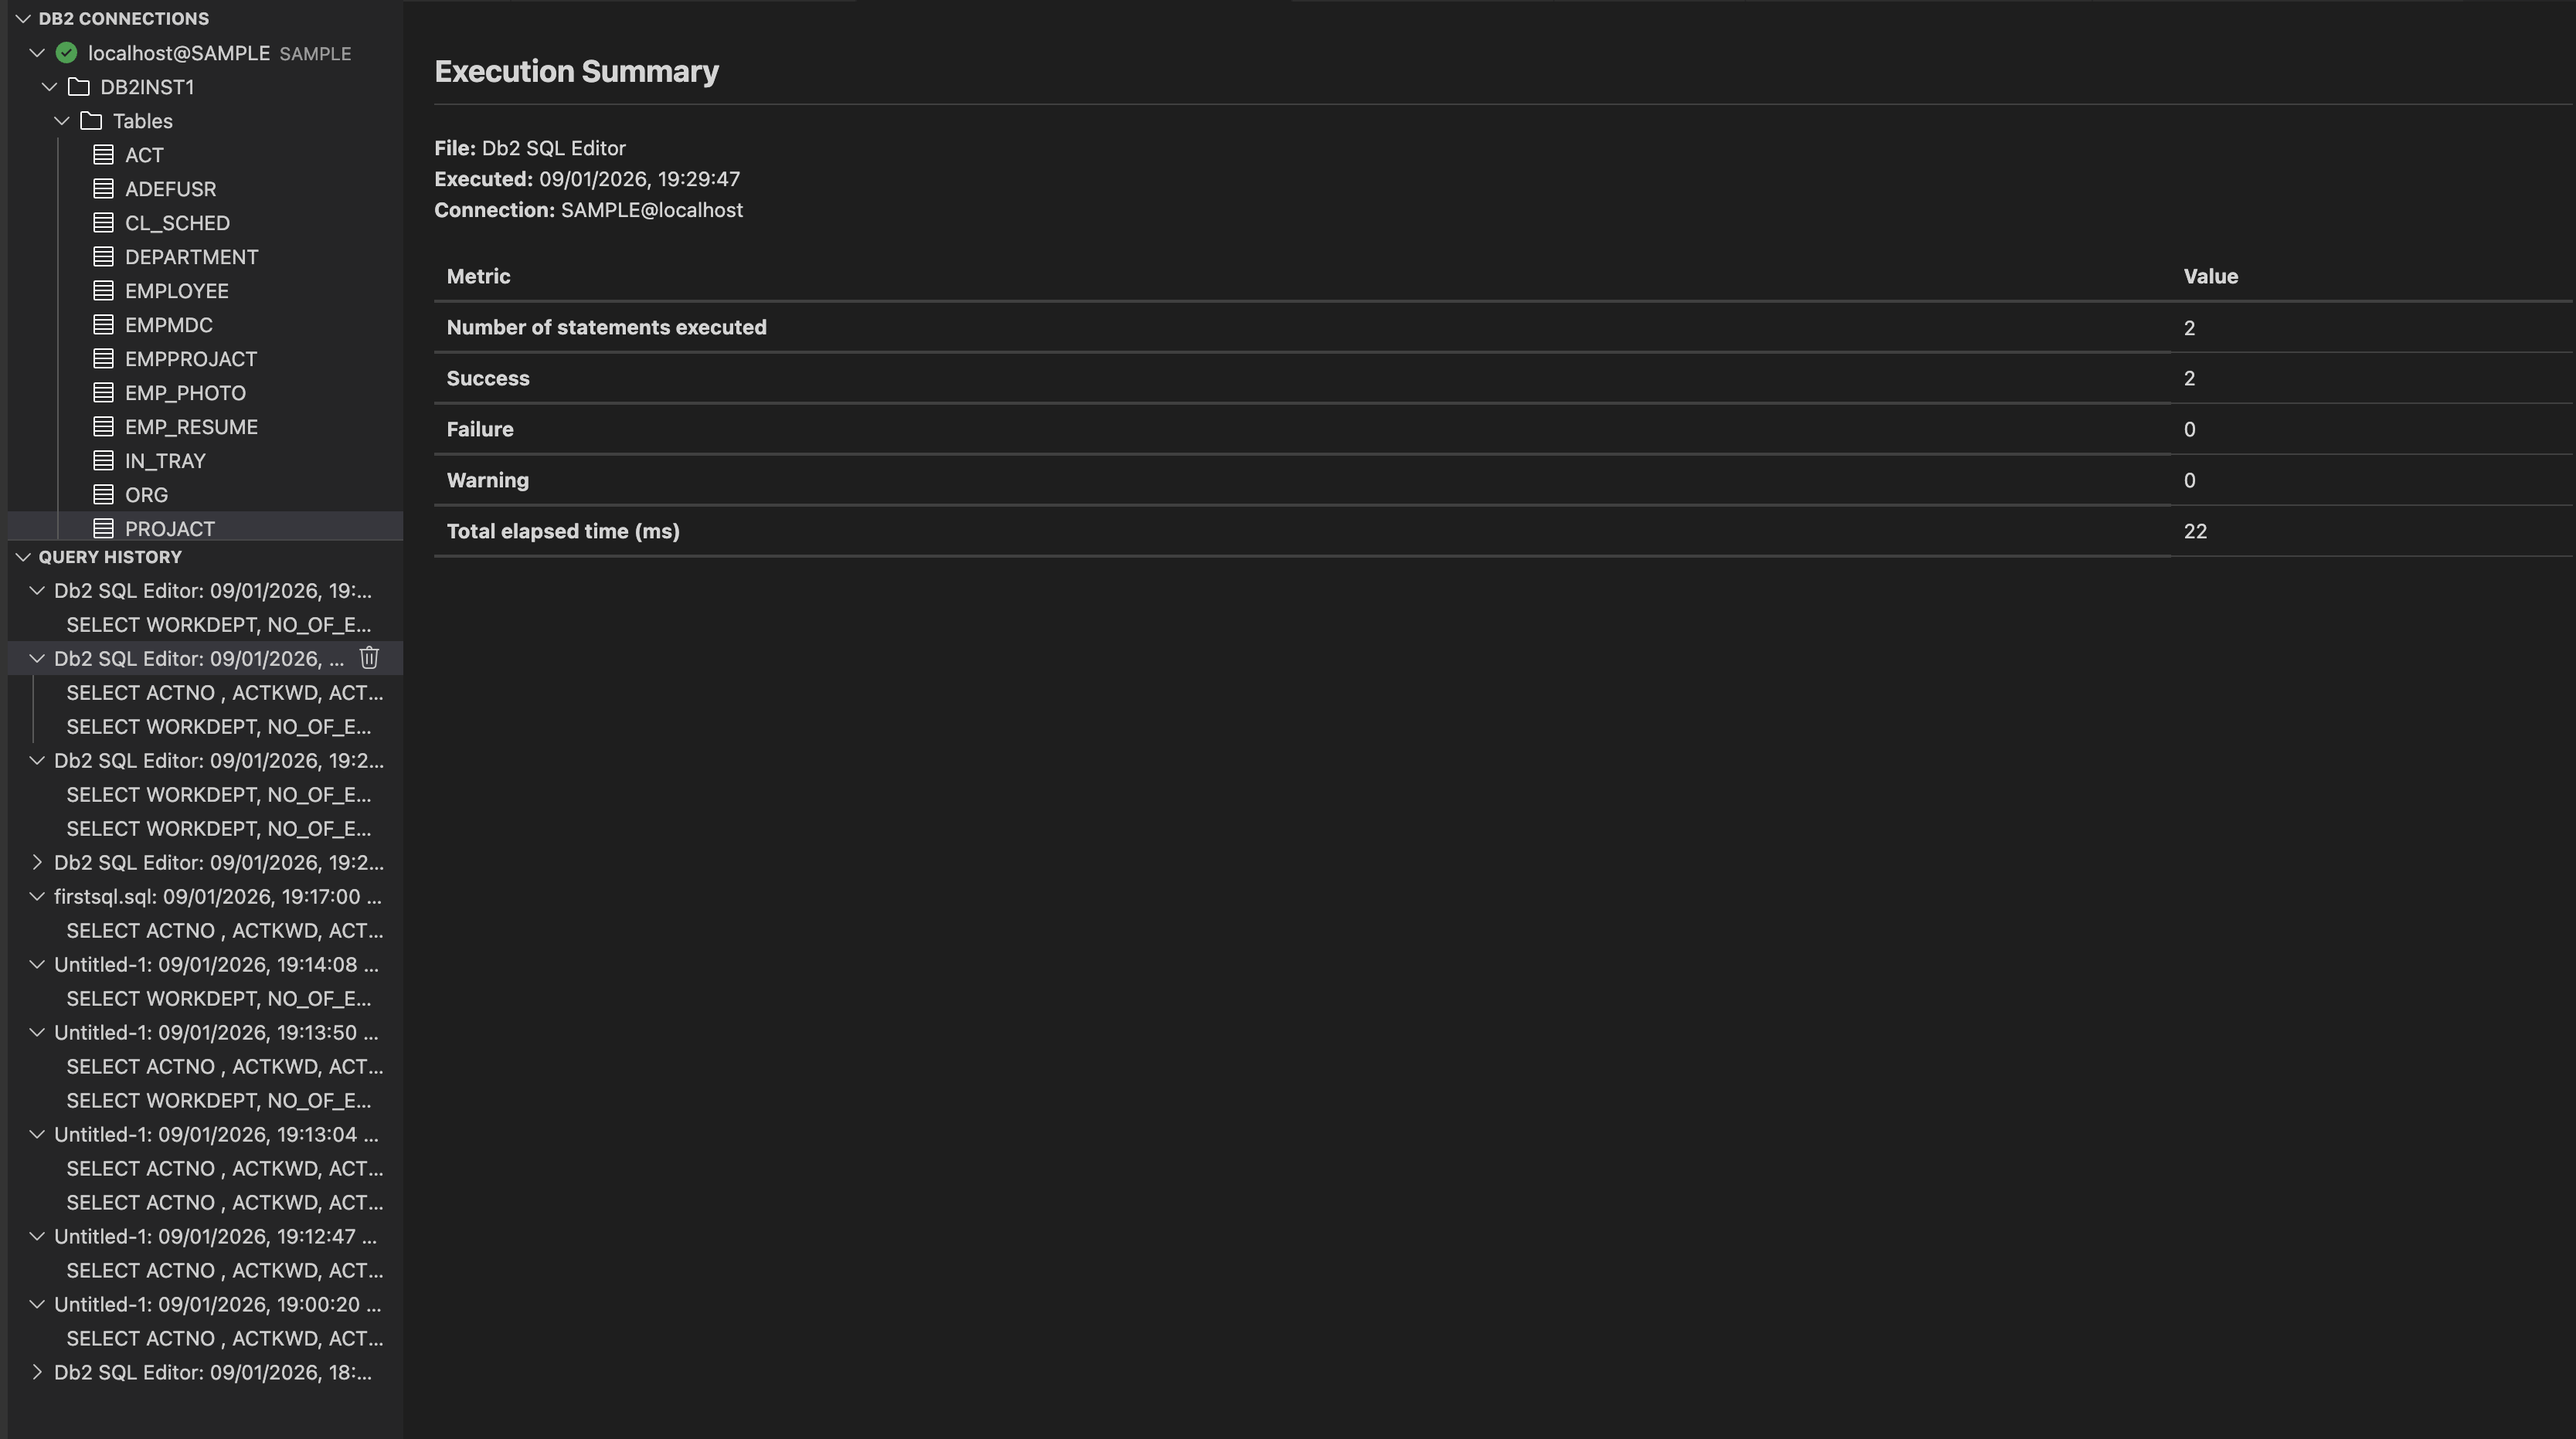
- File: Indicates the source of the statements that were run. For example, Db2 SQL Editor means that the statements were run from the SQL editor in the extension.
- Statement date: Timestamp when the query was run.
- Connection: Shows the database connection details used for running the query.
- Metric:
- Total statements run: Total count of SQL statements that were run together.
- Success: Number of statements that ran successfully without errors.
- Failure: Number of statements that failed during execution.
- Warning: Number of statements that completed with warnings.
- Total elapsed time (ms): The cumulative time taken to run all the statements in the group, in milliseconds.
-
Expand the timestamped query record to show individual statements. Select a statement. The editor shows two tabs:
-
The Status tab shows the following details:
- File: Indicates the source from which the SQL statement was run.
- Executed: Timestamp when the query was run.
- Connection: Database connection details used for running the query.
- Statement: Shows the actual SQL statement that was run.
- Return code: Numeric code indicating the result of the run.
- SQL code: Db2‑specific SQLCODE returned after the statement was processed.
- SQL state: Alphanumeric code that is used for the SQL standard for error reporting.
- Message: Text describing the result of the run.
- Elapsed time (ms): Total time taken to run the query in milliseconds.
-
The Result tab shows the output of the SQL statement in a tabular format. It provides information about the rows returned, run time, and options for searching and exporting the results.
- Rows: Total number of rows returned by the query.
- Execution Time (ms): Time taken to run the query in milliseconds.
-
You can search within the displayed results using the Search box. Click Export to export the query results to CSV or JSON.