Understand the health of your Event Streams deployment at a glance, and learn how to find information about problems.
Checking Event Streams health
Using the Event Streams UI
The Event Streams UI provides information about the health of your environment at a glance. In the bottom right corner of the UI, a message shows a summary status of the system health. If there are no issues, the message states System is healthy.
If any of the Event Streams resources experience problems, the message states component isn’t ready. If any of the components are not ready for an extended period of time, see how you can troubleshoot as described in debugging.
Using the CLI
You can check the health of your Event Streams environment using the Kubernetes command-line tool (kubectl).
- Log in to your Kubernetes cluster as a cluster administrator by setting your
kubectlcontext. -
To check the status and readiness of the pods, run the following command, where
<namespace>is where your Event Streams instance is installed:kubectl -n <namespace> get podsThe command lists the pods together with simple status information for each pod.
If any of the components are not ready for an extended period of time, check the debugging topic.
Debugging
Using the OpenShift Container Platform UI
- Log in to the OpenShift Container Platform web console using your login credentials.
- Expand the Operators dropdown and select Installed Operators to open the Installed Operators page.
- Expand the Project dropdown and select the project the instance is installed in. Click the operator called IBM Event Streams managing the project.
- Select the Event Streams tab and search the Name column for the installed instance and click it.
- Click on the Resources tab.
- To filter only pods, deselect all resource types with the exception of Pod.
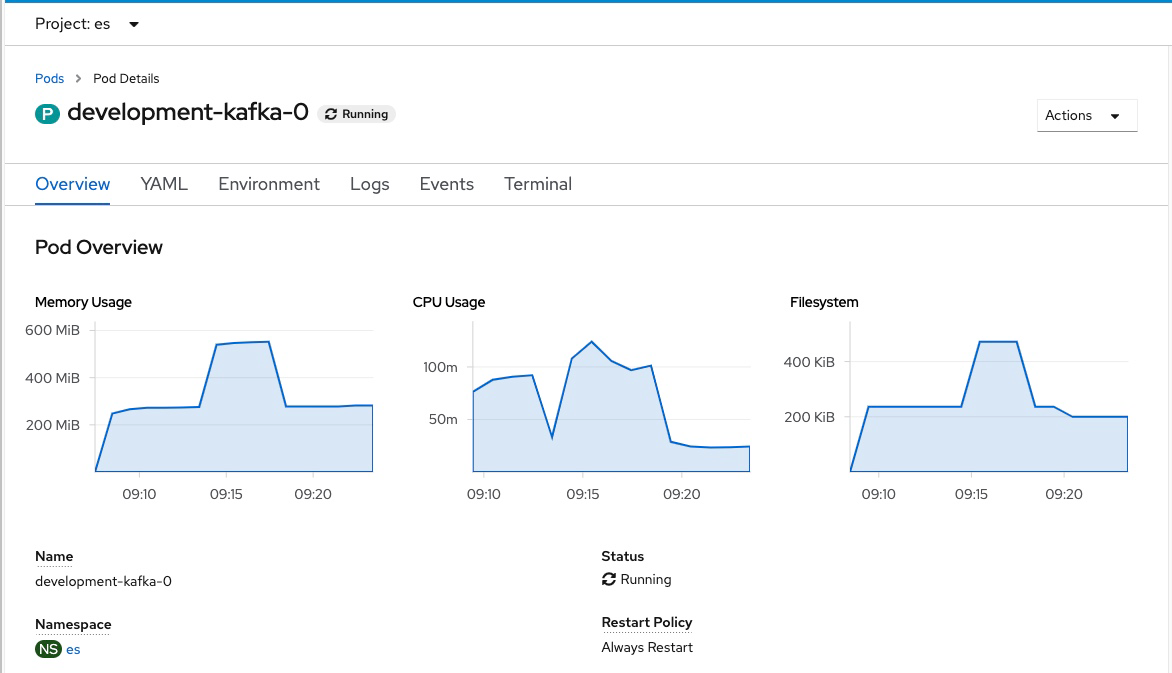
- Click the pod not in the Running state to display information regarding the pod.
- In the Overview, resource usage, such as CPU and memory, can be viewed.

- Click on the Logs tab to search logs.
Tip: You can also use the cluster logging provided by the OpenShift Container Platform to collect, store, and visualize logs. The cluster logging components are based upon Elasticsearch, Fluentd, and Kibana (EFK). You can download and install the pre-configured Event Streams Kibana dashboards by following the instructions in monitoring cluster health.
Using the CLI
-
To retrieve further details about the pods, including events affecting them, use the following command:
kubectl -n <namespace> describe pod <pod-name> -
To retrieve detailed log data for a pod to help analyze problems, use the following command:
kubectl -n <namespace> logs <pod-name> -c <container_name>
For more information about debugging, see the Kubernetes documentation.
Note: After a component restarts, the kubectl command retrieves the logs for the new instance of the container. To retrieve the logs for a previous instance of the container, add the -–previous option to the kubectl logs command.

