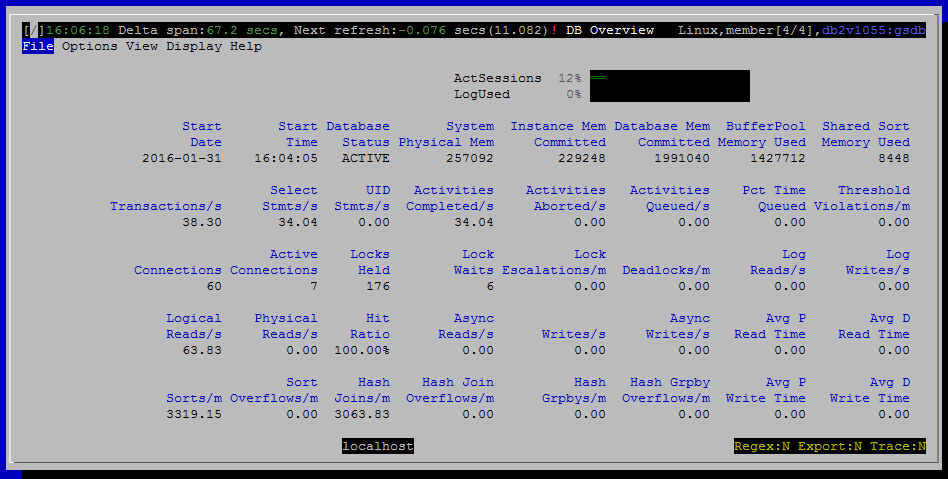
DB Overview
Purpose
The overview tells you at a glance how busy the monitored database is. It provides basic information about the current level of activity. For example:
- Number of connections
- Memory consumption
- I/O efficiency
- Indicators of contention such as high lock wait time, lock escalations or deadlocks.
This is the view you see when you start dsmtop.

Metrics Shown
The DB Overview is presented in a tile layout, rather than the grid layout used for most views. Each metrics appears with a short label above it.
Start Date
The date the monitored database was activated.
Source: mon_get_database.db_conn_time
Start Time
The time the monitored database was activated.
Source: mon_get_database.db_conn_time
Database Status
According to the Knowledge Center, the possible values for this field are:
- ACTIVE
- QUIESCE_PEND
- QUIESCED
- ROLLFWD
- ACTIVE_STANDBY
- STANDBY
This field is present for compatibility with db2top. Most of these states will prevent dsmtop from connecting, so you will never see them.
Source: mon_get_database.db_status
System Physical Mem
Total physical memory on this host.
Source: env_get_system_resources.memory_total
Instance Mem Committed
Memory committed, as opposed to used, is a better measure of the memory footprint of DB2. That is, how much memory is committed by the OS for use by DB2 and hence unavailable for other processes.
Source: mon_get_memory_set
sum(memory_set_committed) for all DBMS memory sets
Database Mem Committed
The portion of memory committed for just this database, as opposed to the whole instance.
Source: mon_get_memory_set
sum(memory_set_committed) for all DATABASE memory sets
Buffer Pool Memory Used
Buffer pool memory is typically the largest component of memory usage by DB2. So it is broken out separately here.
Source: mon_get_memory_pool
sum(memory_pool_used) for all BP memory pools
Shared Sort Memory Used
Source: mon_get_memory_pool
sum(memory_pool_used) for all SHARED_SORT memory pools
Transactions / s
Source: mon_get_database
Select Stmts / s
Source: mon_get_database.select_sql_stmts
UID /s
Insert + update + delete statements / second.
Source: mon_get_database.uid_sql_stmts
Activities Completed / s
The number of activities completed per second is one measure of how much work is being accomplished by the data server. Activities typically correspond to a query, although there a few additional things that count as an activity including LOAD and stored procedures calls.
Activities Aborted / s
This reflects how many activities failed due to errors of some sort, including being cancelled or violating a WLM threshold configured to stop execution.
Activities Queued / s
Pct Time Queued
On average, what is the aggregate percentage of time do activities spend queued by WLM, waiting to begin execution. This is averaged across all activities, including ones that are never queued.
Source: mon_get_service_subclass
Threshold Violations / m
WLM threshold violations are normalized to per minute instead of per second because threshold violations should be infrequent.
Connections
Source: mon_get_agent
Count of all agents where application_handle <> 0 and agent_state = 'ACTIVE'
Active Connections
Source: mon_get_agent
Count of all agents that meet the following conditions:
- application_handle <> 0
- agent_state = 'ACTIVE'
- event_state = 'EXECUTING'
- event_type = 'PROCESS'
- agent_state_last_update_time < 15 seconds ago
Locks Held
Source: mon_get_database.num_locks_held
Lock Waits
Count of the number of agents currently waiting to acquire a lock.
Source: mon_get_service_subclass.lock_waits
Lock Escalations / m
The number of times that locks have been escalated from several row locks to a table lock.
Source: mon_get_service_subclass.lock_escals
Deadlocks / m
The number of deadlocks that have occurred.
Deadlocks can be caused by the following situations:
Lock escalations are occurring for the database
An application may be locking tables explicitly when system-generated row locks may be sufficient
An application may be using an inappropriate isolation level when binding
Catalog tables are locked for repeatable read
Applications are getting the same locks in different orders, resulting in deadlock.
Source: mon_get_service_subclass.deadlocks
Log Reads / s
Source: mon_get_transaction_log.log_reads
Log Writes / s
Source: mon_get_transaction_log.log_writes
Logical Reads / s
Source: mon_get_service_subclass
Physical Reads / s
Source: mon_get_service_subclass
pool_data_p_reads + pool_index_p_reads + pool_xda_p_reads +
pool_temp_data_p_reads + pool_temp_index_p_reads + pool_temp_xda_p_reads + pool_col_p_reads + pool_temp_col_p_reads
Hit Ratio
Async Reads / s
Source: mon_get_database
pool_async_data_reads + pool_async_index_reads + pool_async_xda_reads + pool_async_col_reads
Writes / s
Async Writes / s
Source: mon_get_database
pool_async_data_writes + pool_async_index_writes + pool_async_xda_writes + pool_async_col_writes
Avg P Read Time
Source: mon_get_service_subclass
pool_read_time / (pool_data_p_reads + pool_index_p_reads + pool_xda_p_reads + pool_col_p_reads +
pool_temp_data_p_reads + pool_temp_index_p_reads + pool_temp_xda_p_reads + pool_temp_col_p_reads)
Avg D Read Time
Source: mon_get_service_subclass
direct_read_time / direct_reads
Sorts / m
Source: mon_get_service_subclass.total_sorts
Sort Overflows / m
Source: mon_get_service_subclass.sort_overflows
Hash Joins / m
Source: mon_get_service_subclass.total_hash_joins
Hash Join Overflows / m
Source: mon_get_service_subclass.hash_join_overflows
Hash Grpbys / m
Source: mon_get_service_subclass.total_hash_grpbys
Hash Grpby Overflows / m
Source: mon_get_service_subclass.hash_grpby_overflows
Avg P Write Time
Source: mon_get_service_subclass
pool_write_time / (pool_data_writes + pool_index_writes + pool_xda_writes)
Avg D Write Time
Source: mon_get_service_subclass
direct_write_time / direct_writes
Default Sort Column
N / A - this is a tile display, not a grid.
Navigation
Keyboard navigation: Vd
Dedicated shortcut key: alt-d