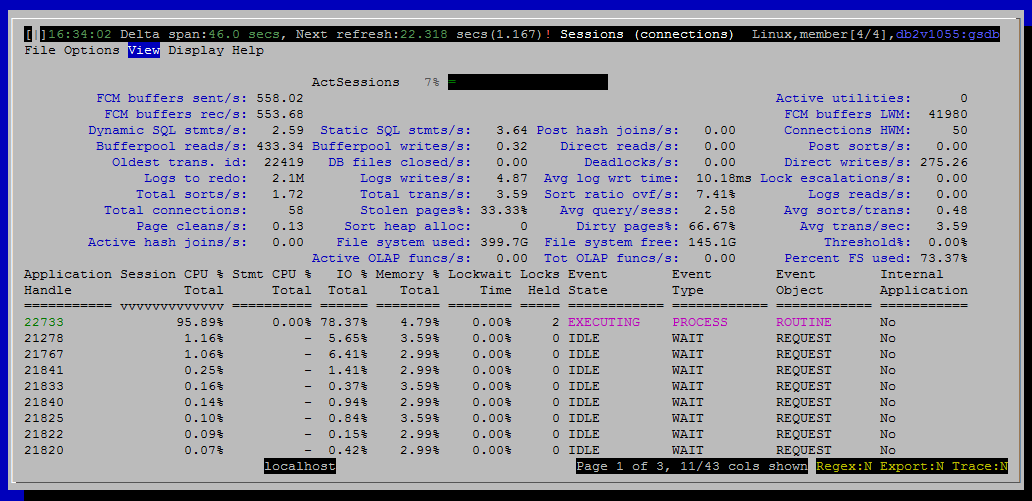
Sessions (connections)
Purpose
Connections (sometimes also known as sessions) are tied to users and applications. This view shows who is connected, what applications they are running and how much of various resources they are consuming.

Histograms and Summaries (Gauges)
Metrics Shown in Grid
Application Handle
Source: mon_get_connection.application_handle
Session CPU % Total
This connection's CPU time as a percentage of CPU time for all connections.
Source: mon_get_connection.total_cpu_time
Stmt CPU % Total
Source: mon_get_activity.stmt_total_cpu_time_us
IO % Total
This connection's logical reads as a percentage of logical reads for all connections.
Source: mon_get_connection
pool_temp_data_l_reads + pool_temp_index_l_reads + pool_temp_xda_l_reads + pool_temp_col_l_reads
Memory % Total
Event State
Source: mon_get_agent.event_state
Event Type
Source: mon_get_agent.event_type
Event Object
Source: mon_get_agent.event_object
Application Name
Source: mon_get_connection.application_name
Rows Read/s
Source: mon_get_connection.rows_read
Rows Written/s
Source: mon_get_connection.rows_modified
IO Reads/s
IO Writes/s
Session Memory
Total memory used by all memory pools associated with this connection.
In this case, "associated with this connection" means that the application handle for this connection matches what is returned by mon_get_memory_pool. Most memory pools shown by mon_get_memory_pool show null for the application handle, indicating that they are not associated with a particular connection.
Source: mon_get_memory_pool.memory_pool_used
Assoc. Agents
Source: mon_get_connection.num_assoc_agents
Paral. Degree
Degree of intraparition parallelism for a statement currently executing on this connection. If there is no statement currently executing, this will be null.
In the case of multiple statements executing concurrently on the same connection, the maximum parallelism will be shown.
Source: mon_get_activity.query_actual_degree
Lockwait Time
Locks Held
Source: mon_get_connection.num_locks_held
Sort Time(s)
Log Used
Source: mon_get_unit_of_work.uow_log_space_used
Rows Returned/s
Source: mon_get_connection.rows_returned
Fetch Count (Stmt)/s
Total number of rows returned so far from all statements currently in-flight for this connection.
This is always a shown as a counter, not a delta.
Source: mon_get_activity.rows_returned
Dynamic SQL/s
Source: mon_get_connection.dynamic_sql_stmts
Static SQL/s
Source: mon_get_connection.static_sql_stmts
#of XQueries/s
Source: mon_get_connection.xquery_stmts
OS User
The ID that the user specified when logging in to the operating system. This ID is distinct from auth_id, which the user specifies when connecting to the database.
Source: mon_get_connection.execution_id
Availability: DB2 v10.5 and above. Null is shown for older versions of DB2.
DB User
Source: mon_get_connection.system_auth_id
Client HostName
Source: mon_get_connection.client_hostname
Client Platform
Source: mon_get_connection.client_platform
Conection Start Time
Source: mon_get_connection.connection_start_time
Status Enter Time
TimeIn Status(s)
IO Type (Data/Index/Temp)
Sort Overflow/s
Source: mon_get_connection.sort_overflows
Hash Join Overflow/s
Source: mon_get_connection.hash_join_overflows
Client PID
The process ID of the client application that made the connection to the database.
Source: mon_get_connection.client_pid
Coordinator Number
Source: mon_get_connection.coord_member
Last Operation
The statement operation currently being processed or most recently processed, if none currently running.
Source: mon_get_connection.last_request_type
TimeTo Connect(ms)
The time it took for this session's connection to be established.
Source: mon_get_connection
total_connect_request_time + total_connect_authentication_time
Session CPU
Source: mon_get_connection.total_cpu_time
Statement CPU(us)
Sum of CPU time consumed so far by all activities currently associated with this connection.
This is always a shown as a counter, not a delta.
Source: mon_get_activity.total_cpu_time
Max Cost Estimate
Estimated cost (timerons) of a statement currently executing on this connection. If there is no statement currently executing, this will be null.
In the case of multiple statements executing concurrently on the same connection, the estimated cost of the most expensive statement will be shown.
Source: mon_get_activity.query_cost_estimate
Internal Application
"Yes" if DB2 considers this an internal connection, "No" for user initiated connections.
This is available only in DB2 v10.5 and higher. For older versions of DB2, dsmtop shows "?".
There is a user preference (option) provided by dsmtop to hide internal queries that depends on this column. <link TBD>
Source: mon_get_activity.is_system_appl
Default Sort Column
Sessions CPU % Total, descending
Navigation
Keyboard navigation: Vl
Dedicated shortcut key: alt-l