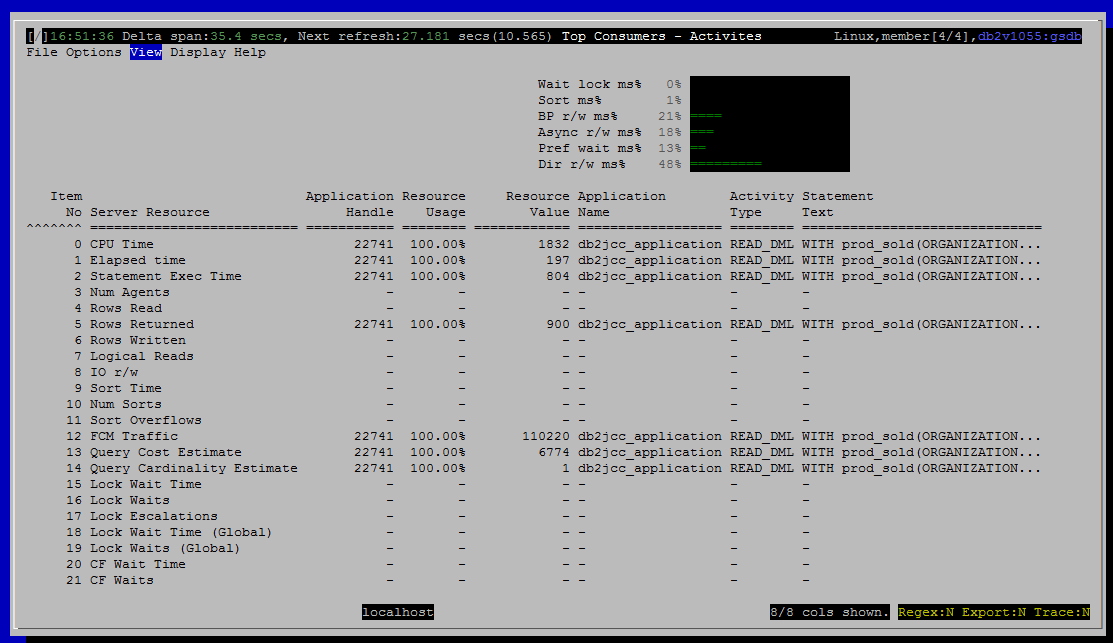
Top Consumers - Activities
Purpose
This view shows the user which activities consume the most resources. Activities are generally queries, but long running DDL and LOAD activities are also included here.

Summaries and Histograms (Gauges)
<Link TBD>
Metrics Shown
There is a grid with a row for each resource that is tracked. Each row names the resource and shows
- Item no, so the grid can be restored to its canonical order if the user sorts on a different column
- Server resource (CPU, Rows Read, etc.)
- The application handle for the activity that has consumed the most of that resource
- What percentage of that resource this particular activity has consumed, relative to consumption by other current activities
- How many rows read, CPU seconds used, etc.
- The name of the application that started this activity
- Activity type (READ_DML, LOAD, etc)
- Statement text (for SQL, null for LOAD activities)
The percentage shown in “Resource Usage” is found by adding up that resource across all current activities and dividing the value for the top consuming activity into it.
If a resource is 0 for all activities, then there is no top consumer and we show null (dash in the grid) for all the columns except Item No and Server Resource.
0 CPU Time
Source: mon_get_activity.total_cpu_time
1 Elapsed time
Source: mon_get_activity.local_start_time
Show the different between local_start_time and current timestamp.
2 Statement Exec Time
Source: mon_get_activity.stmt_exec_time
3 Num Agents
Source: mon_get_activity.num_agents
4 Rows Read
Source: mon_get_activity.rows_read
5 Rows Returned
Source: mon_get_activity.rows_returned
6 Rows Written
Source: mon_get_activity.rows_modified
7 Logical Reads
Source: mon_get_activity
8 IO r/w
Source: mon_get_activity
pool_data_l_reads + pool_index_l_reads + pool_xda_l_reads + pool_col_l_reads +
pool_temp_data_l_reads + pool_temp_index_l_reads + pool_temp_xda_l_reads + pool_temp_col_l_reads +
pool_data_writes + pool_index_writes + pool_xda_writes + pool_col_writes
9 Sort Time
Source: mon_get_activity.total_section_sort_time
10 Num Sorts
Source: mon_get_activity.total_sorts
11 Sort Overflows
Source: mon_get_activity.sort_overflows
12 FCM Traffic
Source: mon_get_activity
fcm_send_volume + fcm_recv_volume
13 Query Cost Estimate
Source: mon_get_activity.query_cost_estimate
14 Query Cardinality Estimate
Source: mon_get_activity.query_card_estimate
15 Lock Wait Time
Source: mon_get_activity.lock_wait_time
16 Lock Waits
Source: mon_get_activity.lock_waits
17 Lock Escalations
Source: mon_get_activity.lock_escals
18 Lock Wait Time (Global)
19 Lock Waits (Global)
Source: mon_get_activity.lock_waits_global
20 CF Wait Time
Source: mon_get_activity.cf_wait_time
21 CF Waits
Source: mon_get_activity.cf_waits
Default Sort Column
Item No, ascending
Navigation
Keyboard navigation: VBa
Dedicated shortcut key: (none)