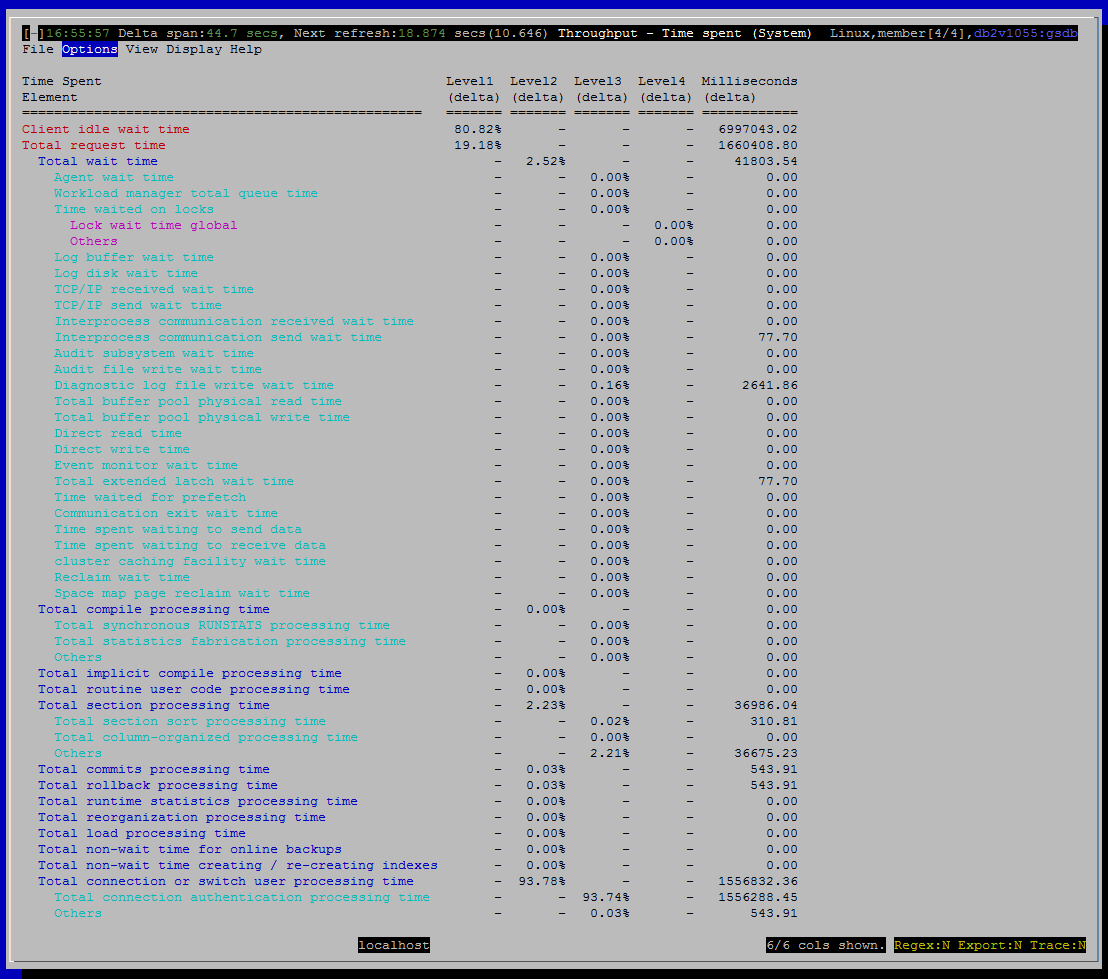
Throughput - Time Spent
Purpose
This view shows where the database is spending its time. You should be able to see at a glance if excessive time is being spent in non-productive areas, such as waiting on locks or writing to event monitors. There are some uncommon but important scenarios that are difficult to diagnose other than by noticing that the server is spending time on something strange.
DB2 organizes the monitor elements for time spent in a hierarchy. For example, there is a monitor element for time spent waiting, which is broken down into many individual elements covering the various things that activities wait for, such as locks, prefetchers, logging, etc. The particular hierarchy shown by dsmtop is the “System Dimension” one, documented here:
For each element shown, we show what percentage it constitutes of each of its parent element. In the current implementation, we present only a summarized view across all members, which means that the stats for the Fast Communication Subsystem (FCM), which routes data and requests between members, is excluded because there is no meaningful aggregation possible for these monitor elements.
Nesting (position in the hierarchy) is shown by indenting the names of the time monitor elements.
The last column shows the raw values for the elements. So if the display mode is “count”, this is the number of milliseconds the data server spent in that category since it was activated.
<TBD investigate and write-up what is shown in the last column when display mode is "delta">.

Summaries and Histograms (Gauges)
(none)
Metrics Shown
Client idle wait time
Time spent waiting for the client to send its next request.
Total request time
The total amount of time spent working on requests.
Total wait time
The total time spent waiting within the DB2 database server.
Agent wait time
Time spent by an application queued to wait for an agent under concentrator configurations.
Workload manager total queue time
The time spent waiting on a WLM queuing threshold.
Time waited on locks
The total elapsed time spent waiting for locks.
Lock wait time global
Time spent on global lock waits. This is relevant only for pureScale.
Others (nested under "Time waited on locks")
Source: mon_get_service_subclass
Log buffer wait time
The amount of time an agent spends waiting for space in the log buffer.
Log disk wait time
The amount of time an agent spends waiting for log records to be flushed to disk.
TCP/IP received wait time
The time spent waiting for an incoming client request over TCP/IP excluding idle time.
TCP/IP send wait time
Time spent blocking on a TCP/IP send to the client.
Interprocess communication received wait time
Source: mon_get_service_subclass.
Interprocess communication send wait time
Source: mon_get_service_subclass.
Audit subsystem wait time
Source: mon_get_service_subclass.
Audit file write wait time
Source: mon_get_service_subclass.
Diagnostic log file write wait time
Source: mon_get_service_subclass.
Total buffer pool physical read time
Source: mon_get_service_subclass.
Total buffer pool physical write time
Source: mon_get_service_subclass.
Direct read time
Source: mon_get_service_subclass.
Direct write time
Source: mon_get_service_subclass.
Event monitor wait time
Source: mon_get_service_subclass.
Total extended latch wait time
Source: mon_get_service_subclass.
Time waited for prefetch
Source: mon_get_service_subclass.
Communication exit wait time
Source: mon_get_service_subclass.
Time spent waiting to send data
Source: mon_get_service_subclass.
Time spent waiting to receive data
cluster caching facility wait time
Reclaim wait time
Space map page reclaim wait time
Total compile processing time
Total synchronous RUNSTATS processing time
Total statistics fabrication processing time
Total implicit compile processing time
Total routine user code processing time
Total section processing time
Total section sort processing time
Total column-organized processing time
Total commits processing time
Total rollback processing time
Total runtime statistics processing time
Total reorganization processing time
Total load processing time
Total non-wait time for online backups
Total non-wait time creating / re-creating indexes
Total connection or switch user processing time
Total connection authentication processing time
Default Sort Column
N / A - sorting is disabled for this view, since any rearrangement of the rows would scramble the time-spent hierarchy.
Navigation
Keyboard navigation: VTx
Dedicated shortcut key: (none)