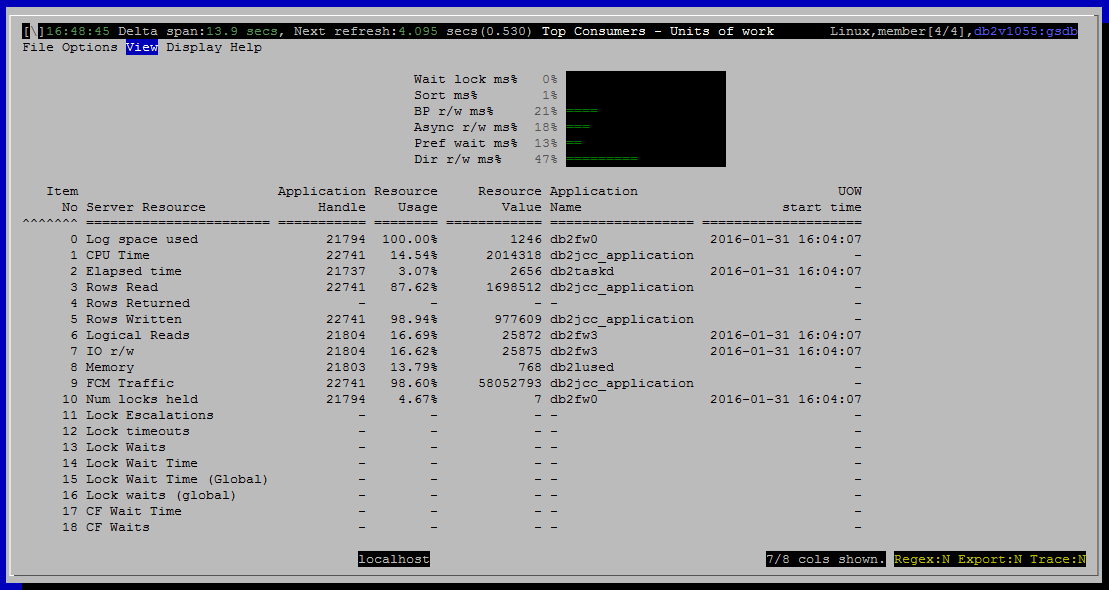
Top Consumers - Units of Work
Purpose
This view shows the user which units of work are consuming the most resources. There are some important scenarios that can be difficult to detect unless you look at metrics on transactions.
Transaction left open
If an application starts a transaction, does some work, and then never commits or rolls back, it will pin the log file where it started. Backup will be unable to free the log file, and depending on how the database is configured a number of bad things can happen, such as filling all available disk space with new log files.
Transaction holding excessive locks
Applications that acquire many locks in a single transaction and are slow to release them impact other work in the database.

Histograms and Summaries
<link TBD>
Metrics Shown
Normally, every connection (application handle) has one unit of work associated with it. So we show the associated application handle, rather than the actual identifier for the unit of work.
There is a grid with a row for each resource that is tracked. Each row names the resource and shows
- The application handle for the unit of work that has consumed the most of that resource
- What percentage of that resource this particular unit of work has consumed, relative to consumption by other current units of work
- How many locks held, how much log space consumed, etc.
- Transaction start time (uow_start_time from mon_get_unit_of_work())
- The name of the application that started this unit of work
The percentage shown in “Resource Usage” is found by adding up that resource across all current units of work and dividing the value for the top consuming unit of work into it.
If a resource is 0 for all units of work, then there is no top consumer and we show null (dash in the grid) for all the columns except Item No and Server Resource.
0 Log space used
1 CPU Time
Source: mon_get_unit_of_work.total_cpu_time
2 Elapsed time
Source: mon_get_unit_of_work.uow_start_time
Subtract uow_start_time from current timestamp
3 Rows Read
Source: mon_get_unit_of_work.rows_read
4 Rows Returned
Source: mon_get_unit_of_work.rows_returned
5 Rows Written
Source: mon_get_unit_of_work.rows_modified
6 Logical Reads
Source: mon_get_unit_of_work
7 IO r/w
Source: mon_get_unit_of_work.
8 Memory
Source: mon_get_memory_pool.memory_pool_used
9 FCM Traffic
Source: mon_get_unit_of_work
10 Num locks held
Source: mon_get_unit_of_work.num_locks_held
11 Lock Escalations
Source: mon_get_unit_of_work.lock_escals
12 Lock timeouts
Source: mon_get_unit_of_work.lock_timeouts
13 Lock Waits
Source: mon_get_unit_of_work.lock_waits
14 Lock Wait Time
Source: mon_get_unit_of_work.lock_wait_time
15 Lock Wait Time (Global)
16 Lock waits (global)
17 CF Wait Time
Source: mon_get_unit_of_work.cf_wait_time
18 CF Waits
Source: mon_get_unit_of_work.cf_waits
Default Sort Column
Item No, ascending
Navigation
Keyboard navigation: VBB
Dedicated shortcut key: alt-B