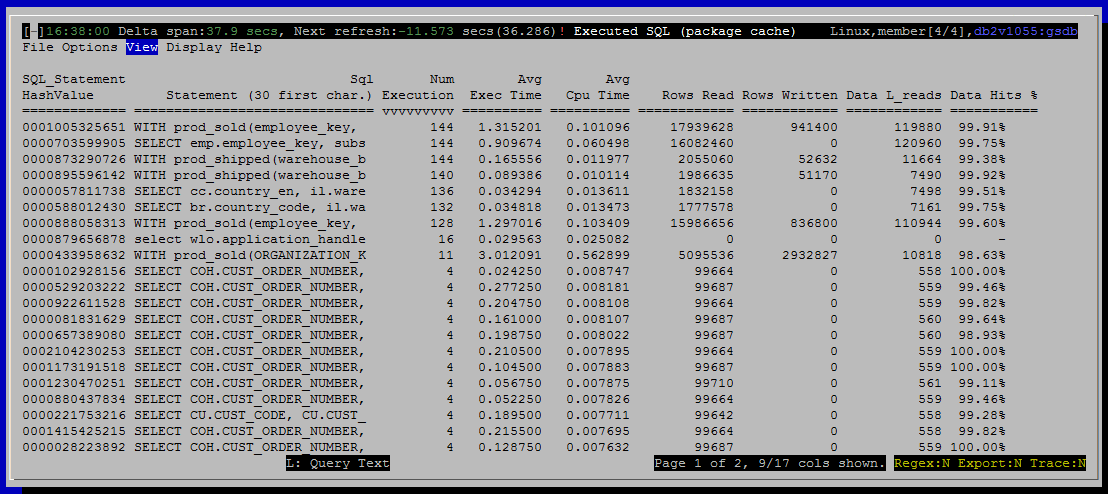
Executed SQL (package cache)
Purpose

Histograms
(none)
Summaries (Gauges)
(none)
Metrics Shown in Grid
SQL_Statement HashValue
A hash computed from the text of the SQL statement.
Sql Statement (30 first char.)
Num Execution
Number of times this statement has been executed. This count is reset if a statement falls out of the cache.
Source: mon_get_pkg_cache_stmt.num_executions
Exec Time
Source: mon_get_pkg_cache_stmt.stmt_exec_time
Avg Exec Time
Source: mon_get_pkg_cache_stmt
stmt_exec_time/ num_exec_with_metrics
Cpu Time
Total CPU time consumed by all executions of this statement.
Source: mon_get_pkg_cache_stmt.total_cpu_time
Avg Cpu Time
Average CPU time consumed by an execution of this statement.
Source: mon_get_pkg_cache_stmt
total_cpu_time / num_exec_with_metrics
Rows Read
Source: mon_get_pkg_cache_stmt.rows_read
Rows Written
Source: mon_get_pkg_cache_stmt.rows_modified
Data L_reads
Data Hits %
Approximate hit ratio for data (row based) reads experienced by this query.
This value does not account for data read asynchronously.
Source: mon_get_pkg_cache_stmt
(1.0 - pool_data_p_reads / pool_data_l_reads) * 100.0
Index L_Reads
Index Hits %
Approximate hit ratio for index reads experienced by this query.
This value does not account for index data read asynchronously.
Source: mon_get_pkg_cache_stmt
(1.0 - pool_index_p_reads / pool_index_l_reads) * 100.0
Temp L_Reads
Source: mon_get_pkg_cache_stmt
pool_temp_data_l_reads + pool_temp_index_l_reads
Temp Hits %
Source: mon_get_pkg_cache_stmt
(1.0 - (pool_temp_data_p_reads + pool_temp_index_p_reads) /
(pool_temp_data_l_reads + pool_temp_index_l_reads)) * 100.0
Avg Sort Per Exec
Source: mon_get_pkg_cache_stmt
total_section_sorts / num_exec_with_metrics
Sort Time
Source: mon_get_pkg_cache_stmt.total_section_sort_time
Default Sort Order
Num Execution (descending)
Navigation
Keyboard navigation: VsD
Dedicated shortcut key: alt-D