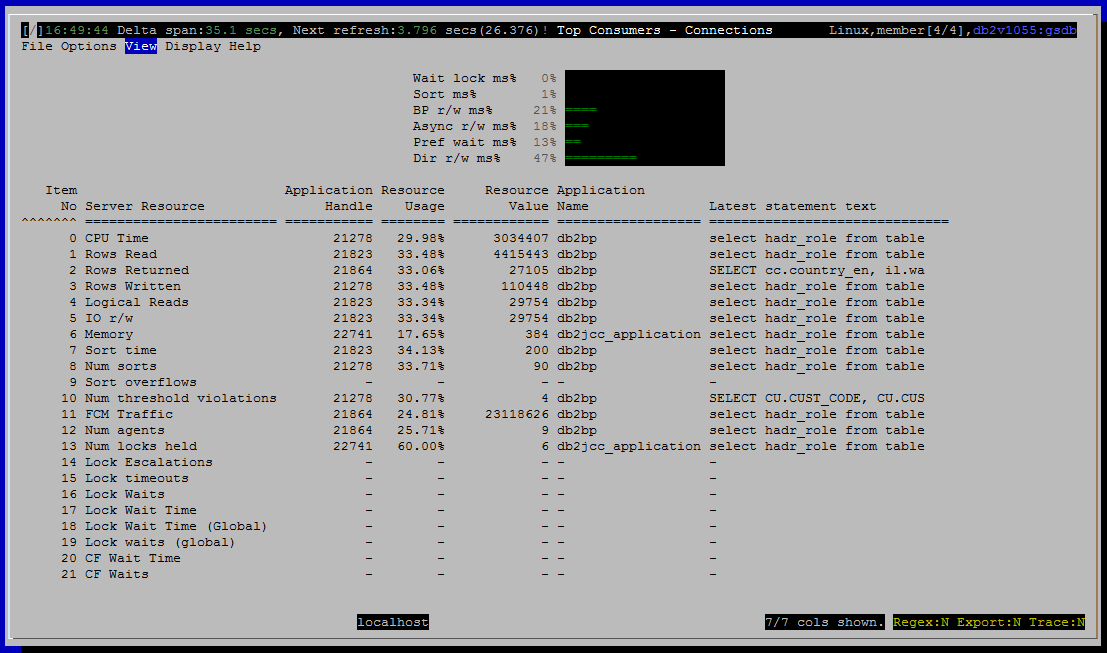
Top Consumers - Connections
Purpose
Find the connections (sessions) that have consumed the most resources over their lifetime. This view is helpful for diagnosing problems where large numbers of small activities in aggregate are consuming excessive resources. A common scenario of this type is applications loading data one row at a time using singleton inserts. This can be very disruptive but each individual insert is tiny and so is the singleton transaction associated with it. This view will highlight connections engaged in these sort of activities.
Note that this overlaps somewhat in functionality with the Sessions (connections) view. If you go to the connections view, in counter mode, you could select various columns one at a time and sort by them to find the connections that have consumed the most CPU, read the most rows, etc. This view provides a convenient way to get similar information in one step.

Histograms and Summaries (Gauges)
<link TBD>
Metrics Shown
There is a grid, with a row for each resource that is tracked. Each row names the resource and shows
- Item no, so that the user can use sort to restore the grid to its canonical ordering if it has been sorted on some other column.
- Server resource (CPU, Rows Read, etc.)
- The application handle for the connection that has consumed the most of this resource.
- What percentage of the resource this particular connection has consumed, relative to consumption by other connections.
- How many rows read, CPU seconds used, etc.
- The name of the application associated with this connection.
- SQL text of most recently executed statement, if available.
0 CPU Time
Source: mon_get_connection.total_cpu_time
1 Rows Read
Source: mon_get_connection.rows_read
2 Rows Returned
Source: mon_get_connection.rows_returned
3 Rows Written
Source: mon_get_connection.rows_modified
4 Logical Reads
Source: mon_get_connection
5 IO r/w
6 Memory
7 Sort time
Source: mon_get_connection.total_section_sort_time
8 Num sorts
Source: mon_get_connection.total_sorts
9 Sort overflows
Source: mon_get_connection.sort_overflows
10 Num threshold violations
Source: mon_get_connection.thresh_violations
11 FCM Traffic
Source: mon_get_connection
fcm_send_volume + fcm_recv_volume
12 Num agents
Source: mon_get_connection.num_assoc_agents
13 Num locks held
Source: mon_get_connection.num_locks_held
14 Lock Escalations
Source: mon_get_connection.lock_escals
15 Lock timeouts
Source: mon_get_connection.lock_timeouts
16 Lock Waits
Source: mon_get_connection.lock_waits
17 Lock Wait Time
Source: mon_get_connection.lock_wait_time
18 Lock Wait Time (Global)
Source: mon_get_connection.lock_wait_time_global
19 Lock waits (global)
Source: mon_get_connection.lock_waits_global
20 CF Wait Time
Source: mon_get_connection.cf_wait_time
21 CF Waits
Source: mon_get_connection.cf_waits
Default Sort Column
Item No, ascending
Navigation
Keyboard navigation: VBc
Dedicated shortcut key: (none)