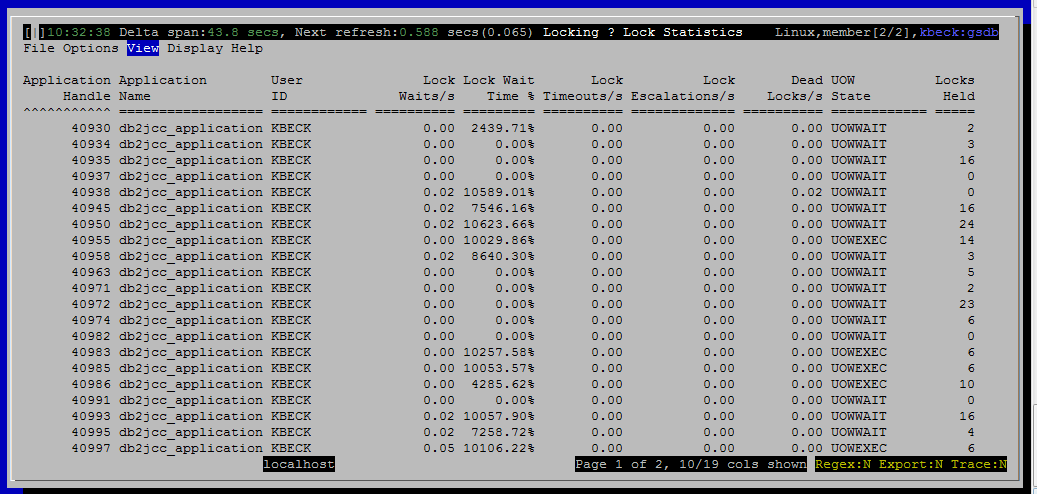
Locking - Lock Statistics
Purpose
Use this view to find sessions (connections) that have been involved in locking problems:
- Sessions that have recently experienced excessive lock waits, time outs, escalations or deadlocks
- Sessions that have consumed excessive log space over their lifetime
- Sessions that are currently holding many locks
- Idle sessions
For context, this view also shows some basic information to help you identify the session without needing to jump to another view:
- Application Name
- User ID
- Workload Name

Histograms and Summaries (Gauges)
(none)
Metrics Shown
Application Handle
Application Name
User ID
Lock Waits/s
Lock Wait Time %
Lock Timeouts/s
Lock Escalations/s
Dead Locks/s
UOW State
Conection Start Time
Coordinator Number
% CPU Time
Memory Pool Used(KB)
Rows Read/s
Logical reads/s
Locks Held
Log Used (KB)
Idle Time
Workload Name
Default Sort Column
Application Handle, descending
Navigation
Keyboard navigation: VLs
Dedicated shortcut key: (none)