Lab 3: Application Monitoring
Here we use the IBM Cloud Monitoring (lite plan) service.
Architecture
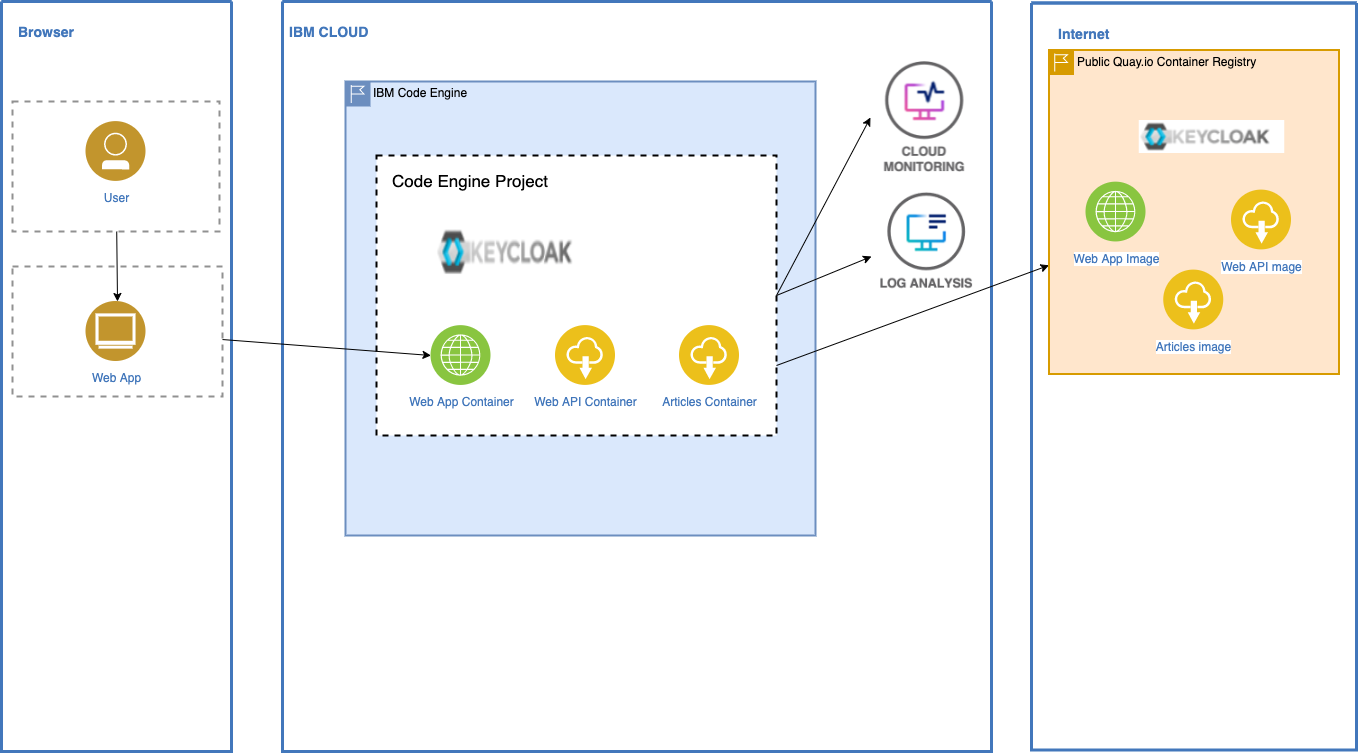
The following simplified architecture diagram show the dependencies of the Code Engine project, the Quay Container Registry, the IBM Cloud Logging and the ÌBM Cloud Monitoring.
Create the monitoring service automatically
Note: If you are using an
IBM Cloud TechZone Environment, you can skip theCreate the monitoring service automaticallyyou don't need to create the service because the service exists.
You can create the lite service instances for logging and monitoring by using this bash script ce-create-monitoring-logging-services.sh.
cd $ROOT_FOLDER/CE
bash ce-create-monitoring-logging-services.sh
Open the monitoring for all applications
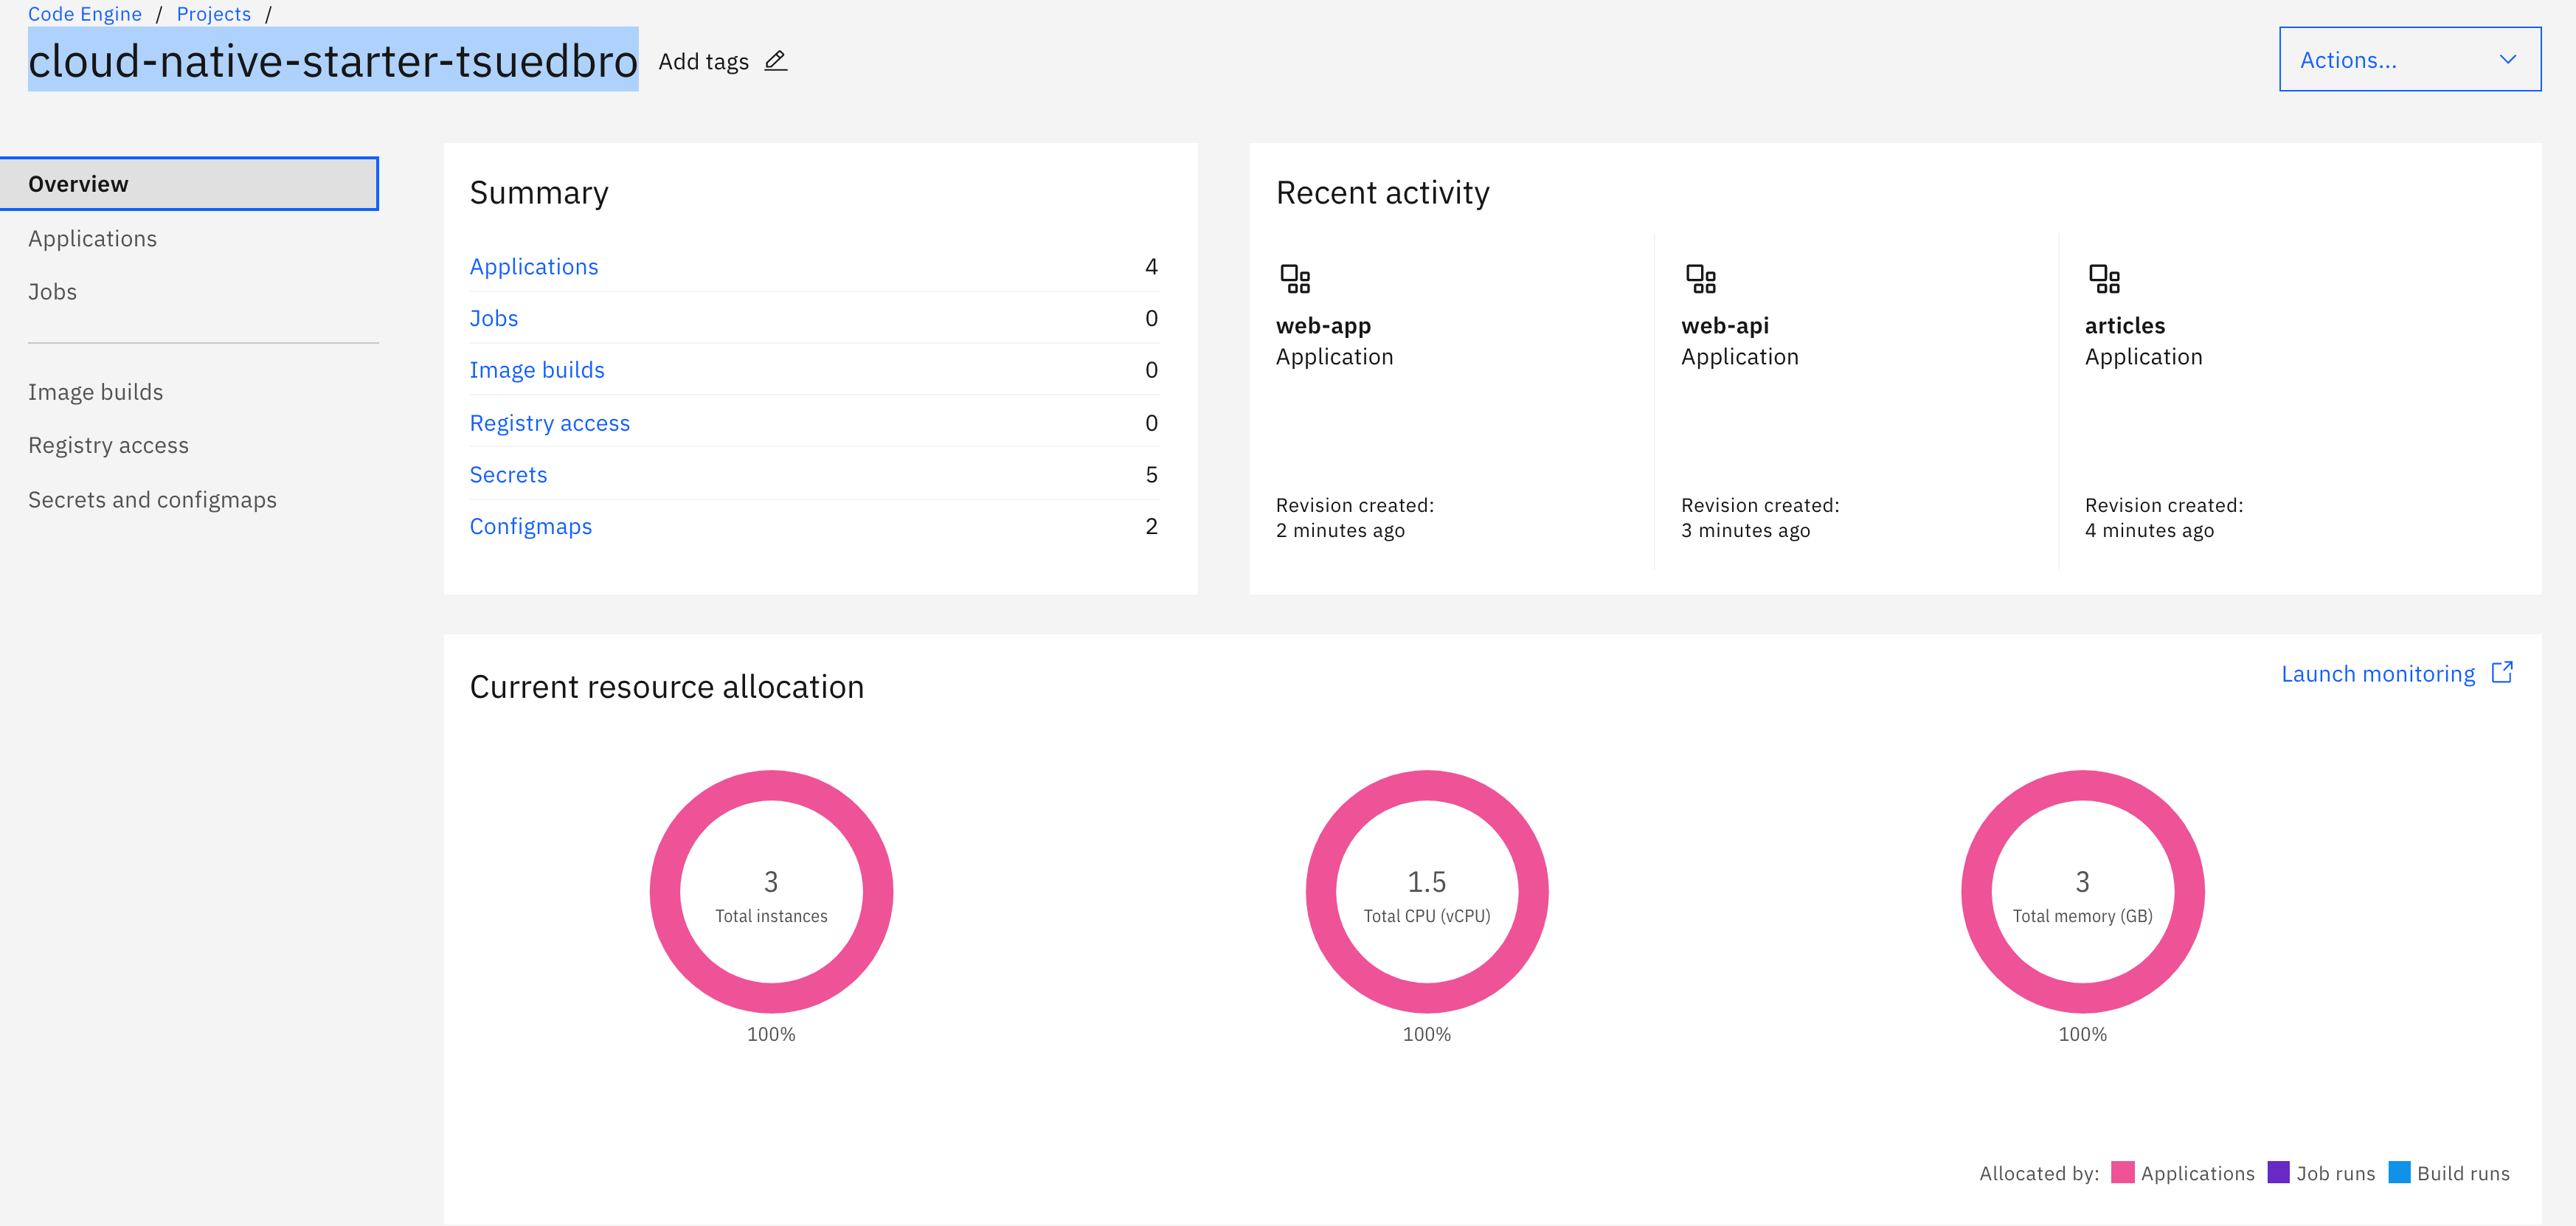
Step 1: Go back to the project overview
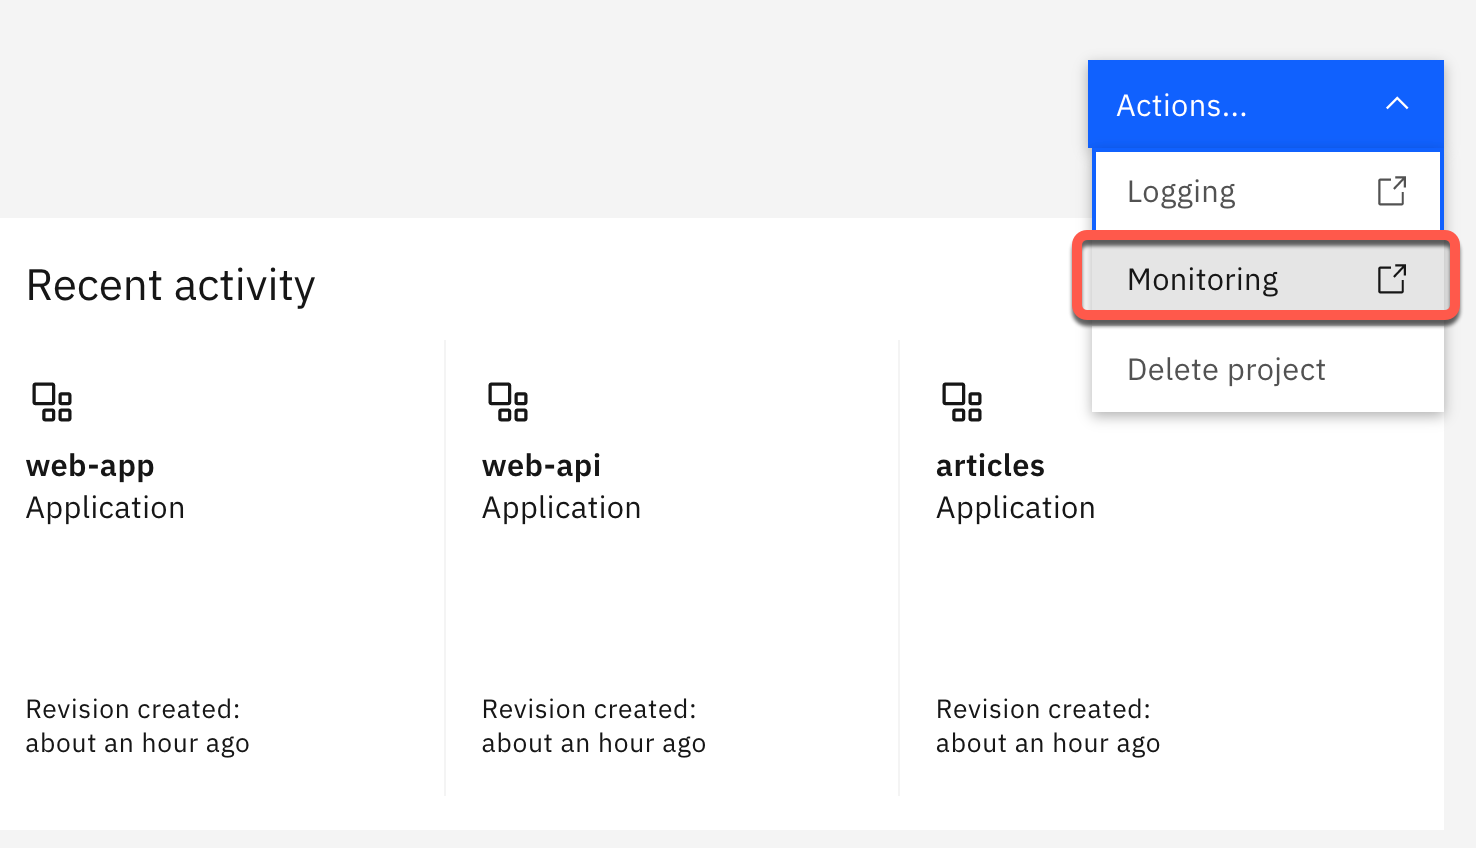
Step 2: Select Actions -> Monitoring
In case you don't have an existing instance of
IBM Cloud MonitoringCode Engine, follow steps inCreate an IBM Cloud Monitoring service manuallyor use thebash script.
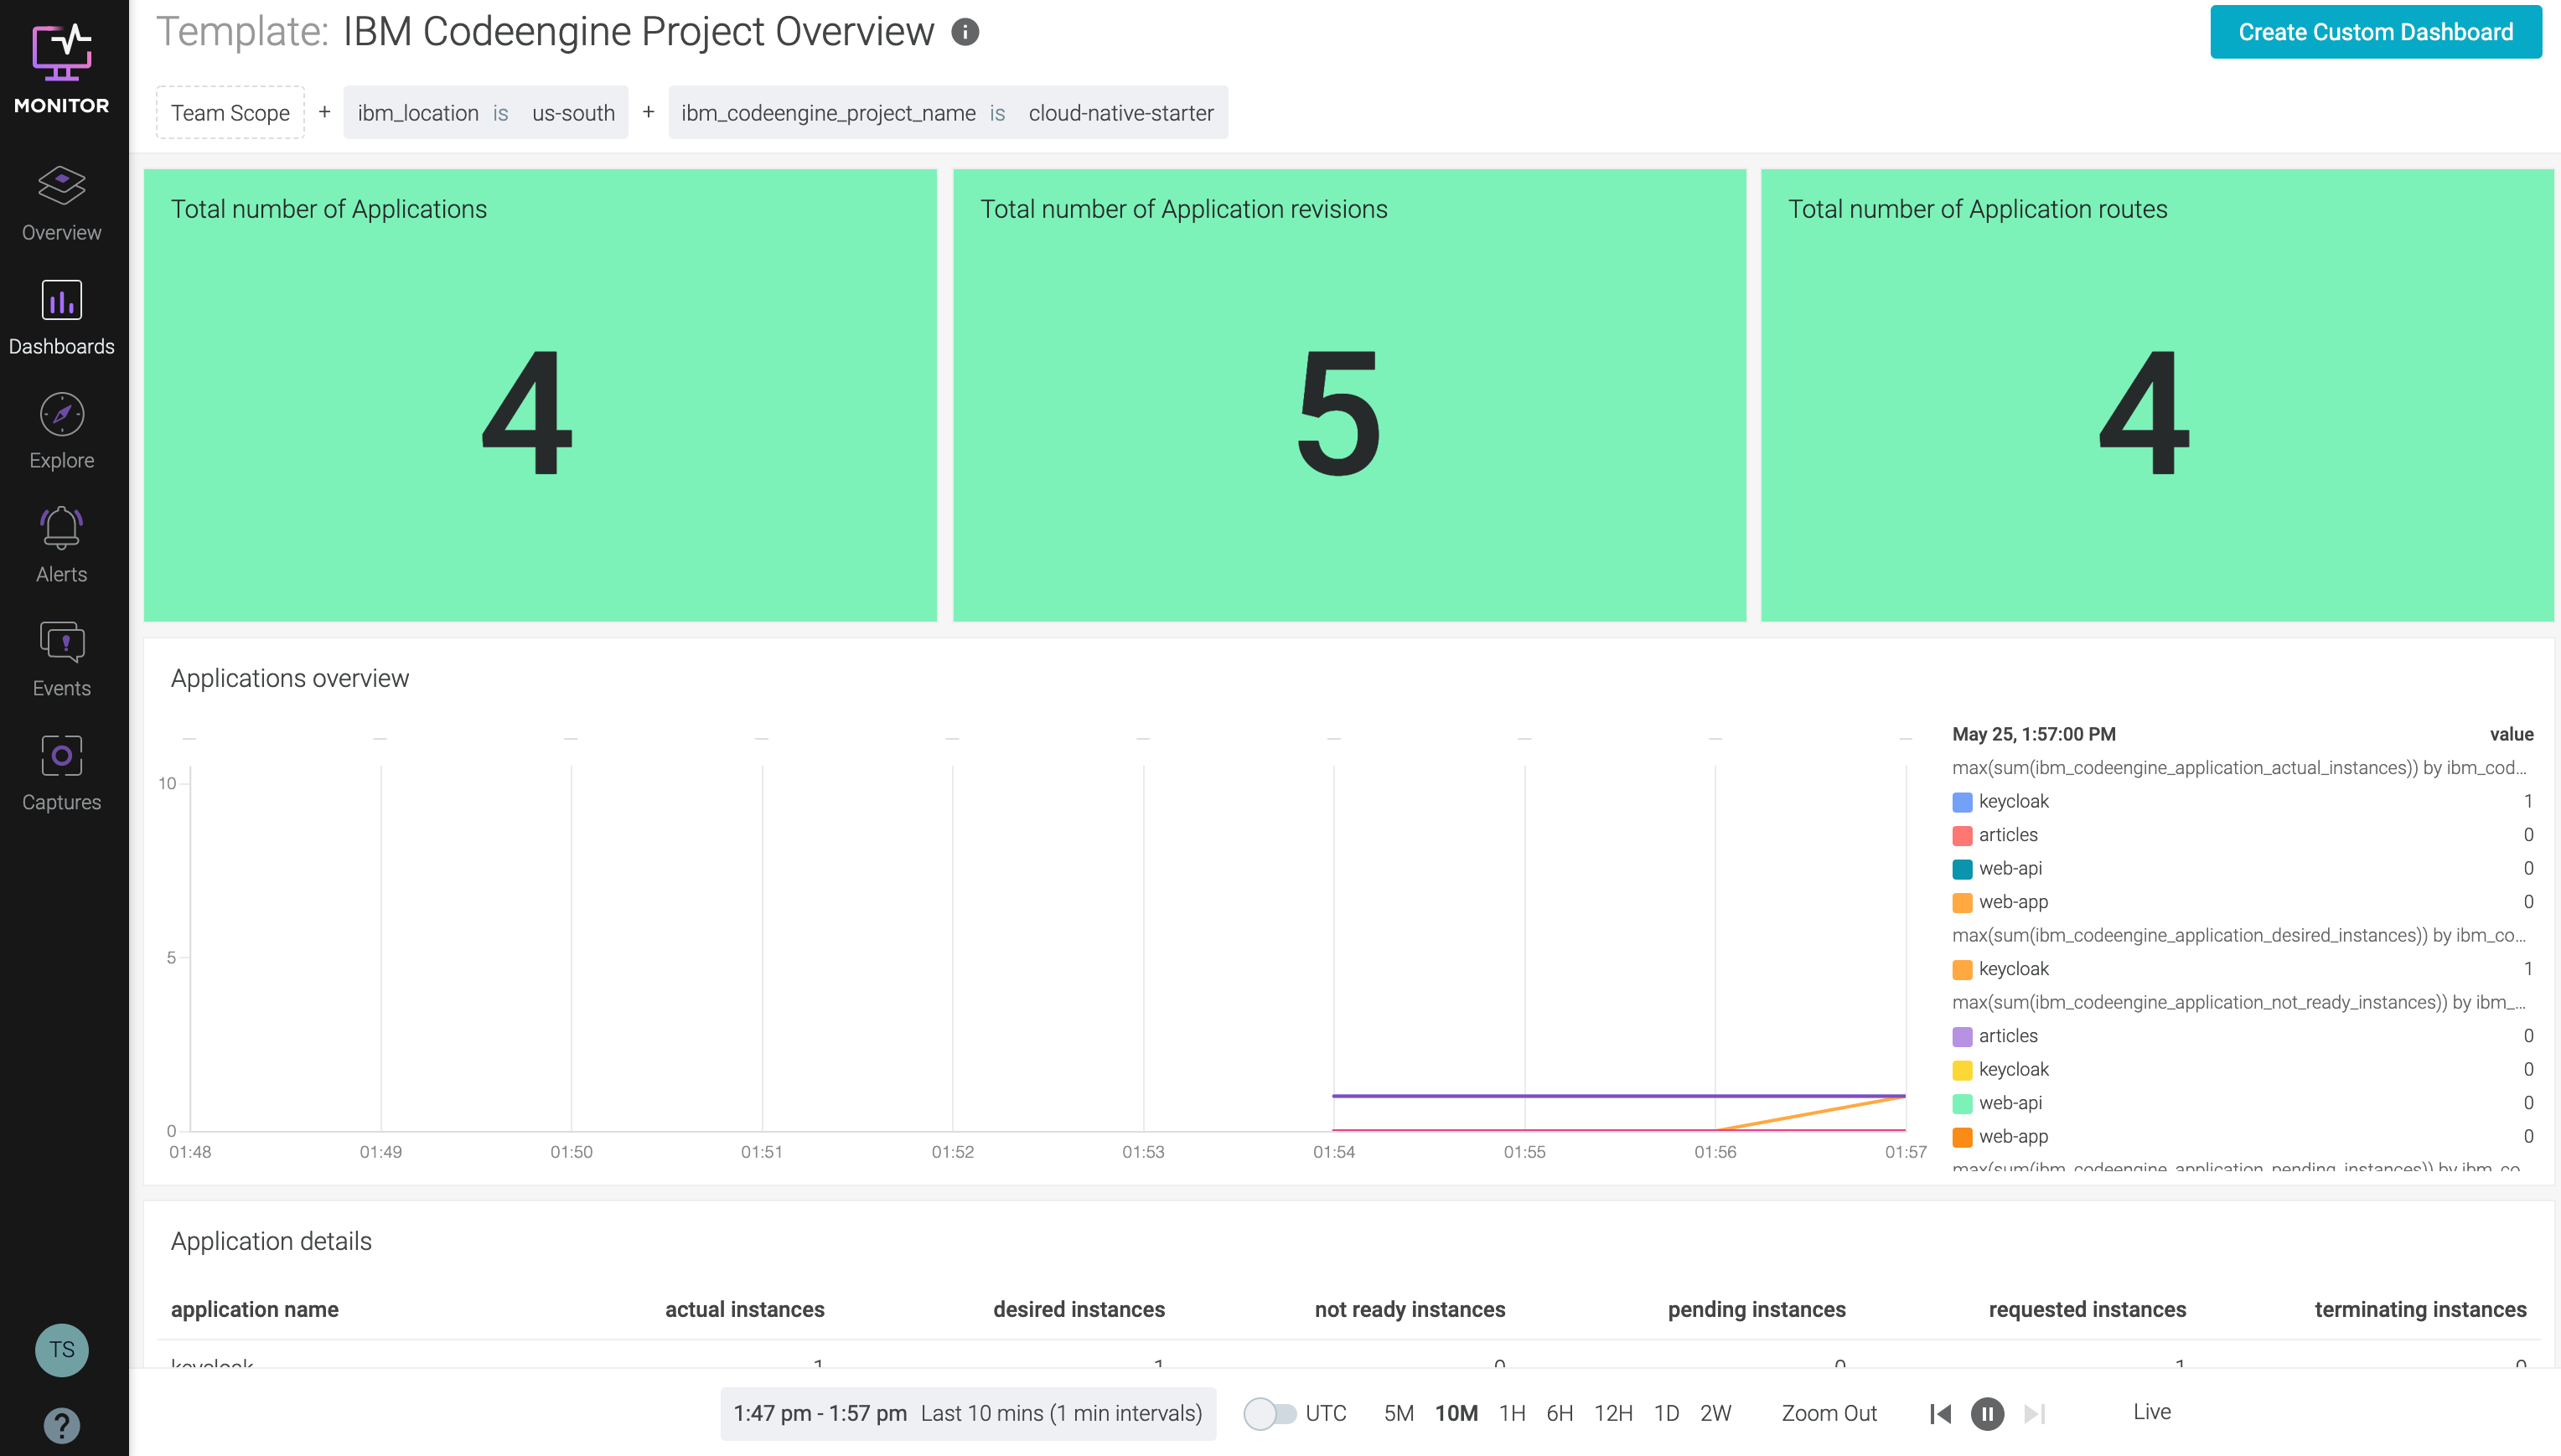
Step 3: Verify that IBM Cloud Monitoring opens in the browser
Create an IBM Cloud Monitoring service manually
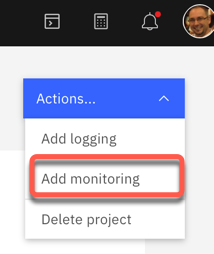
Step 1: Select Add monitoring
In case you don't have an existing instance of IBM Cloud Monitoring Code Engine will automatically guide you to create a lite plan instance, when you select Add monitoring.
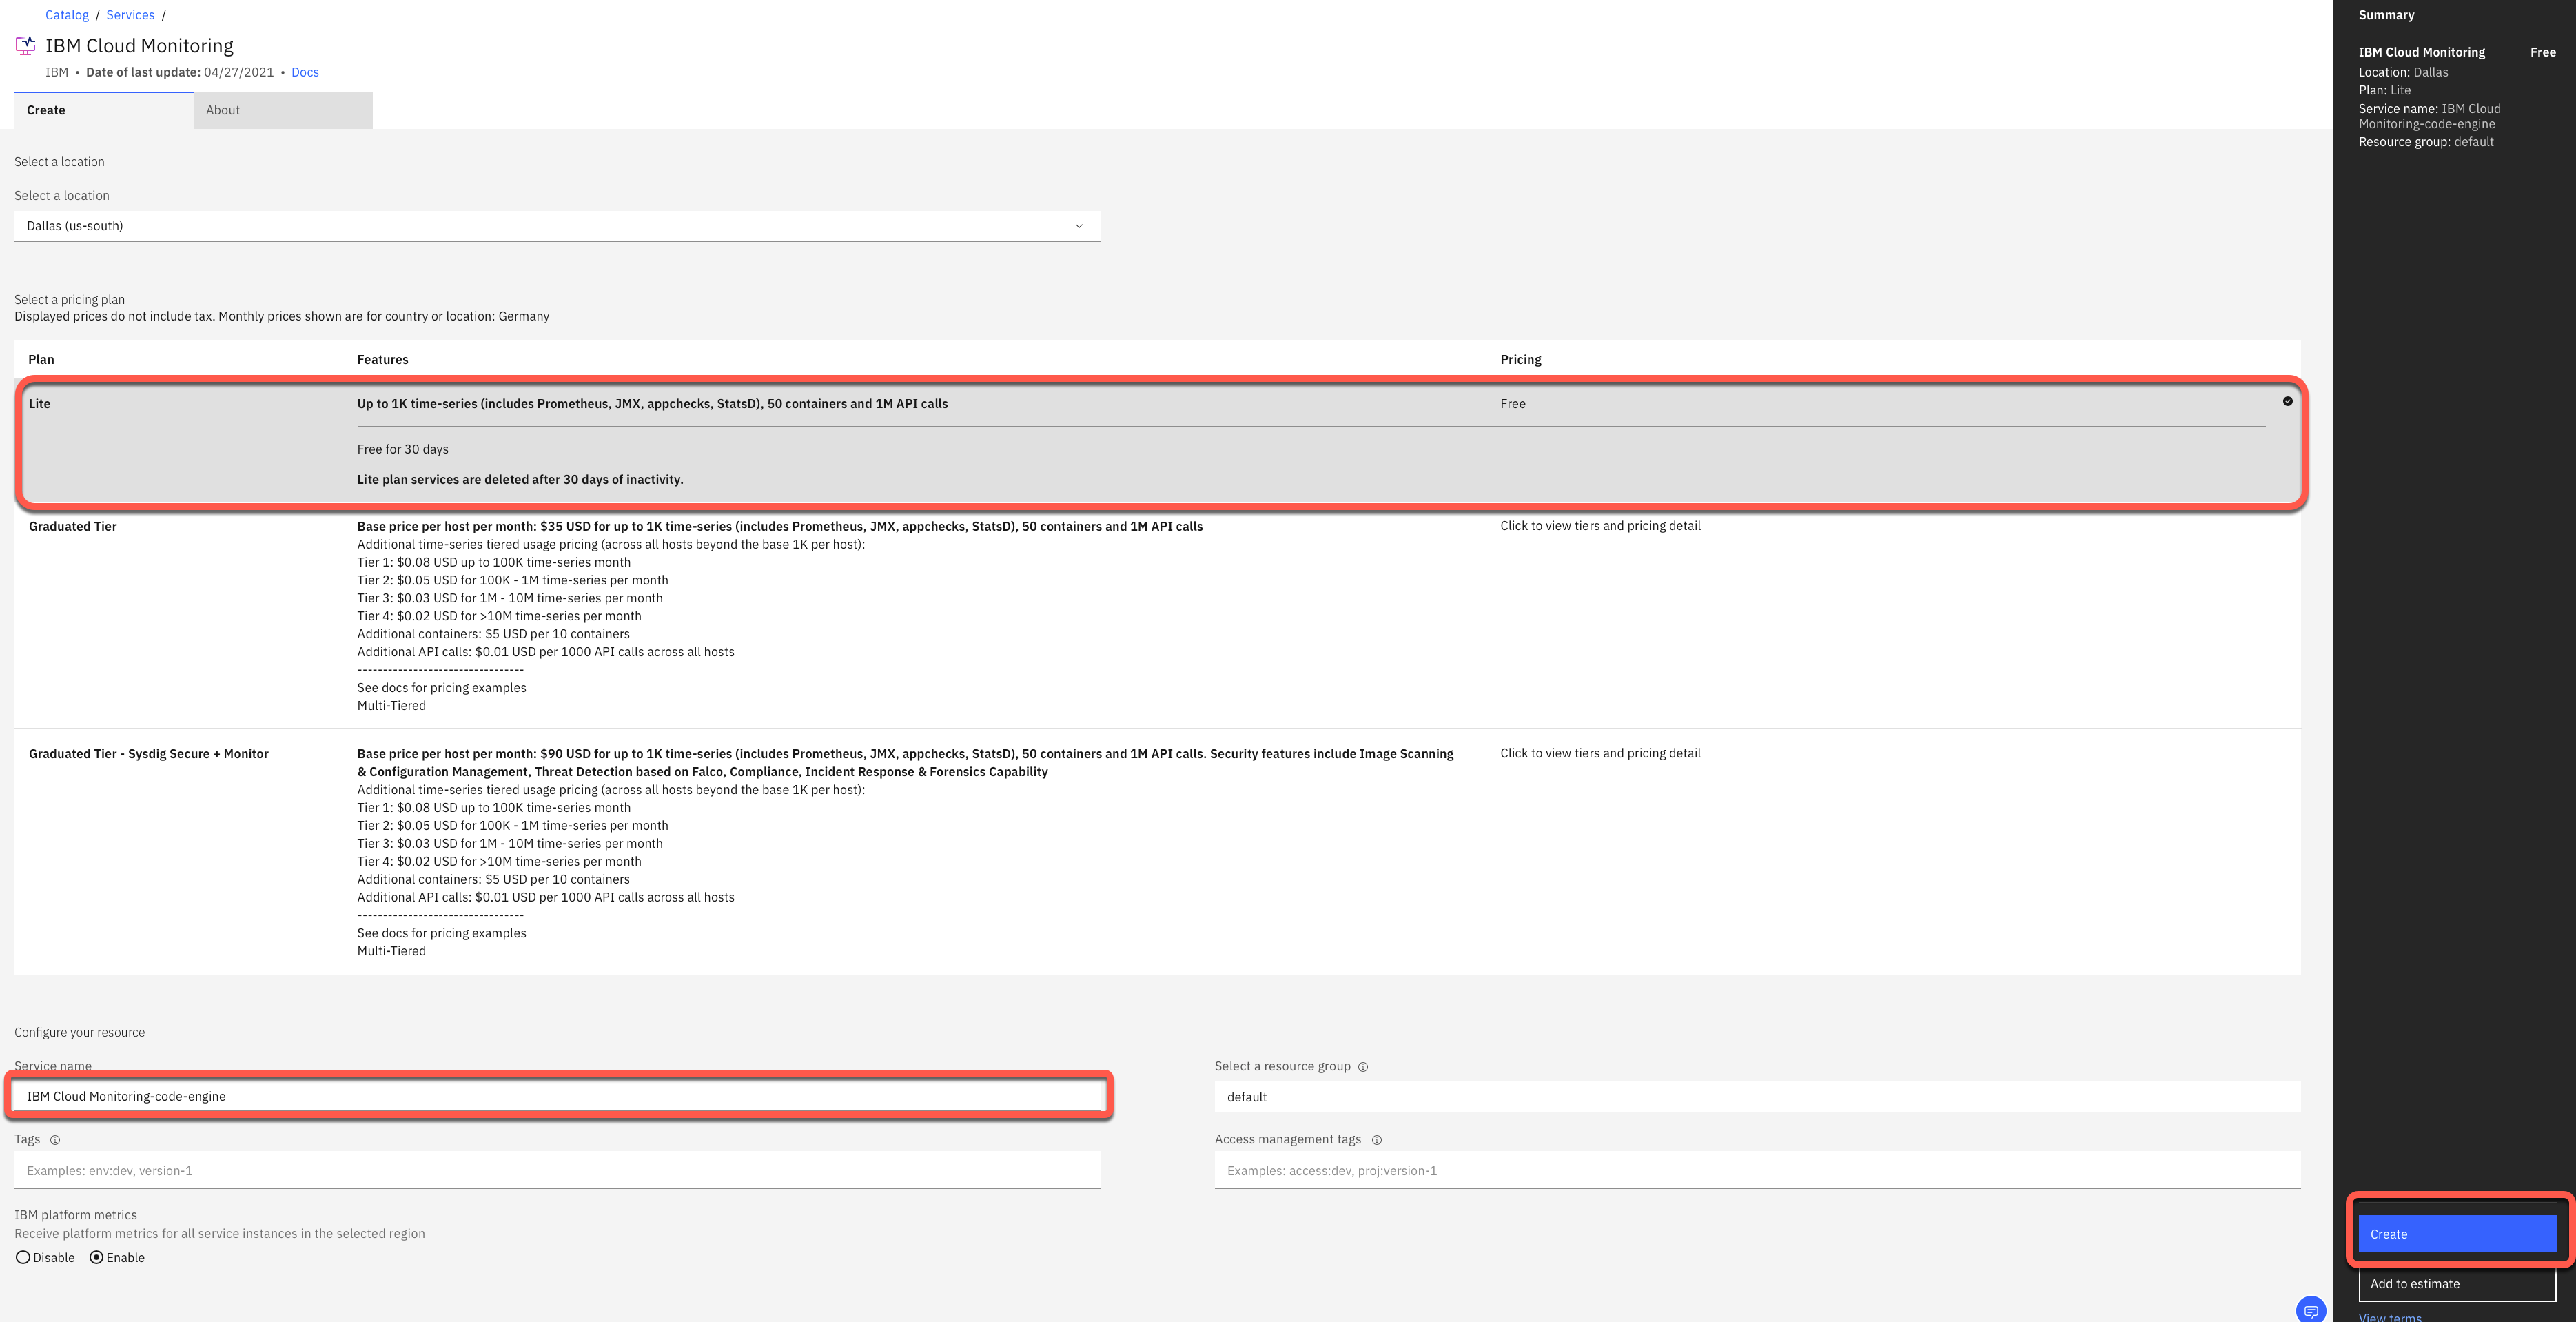
Step 2: In the upcoming dialog select Lite and leave the defaults selected for region and resource group
Name the service instance IBMCloudMonitoring-Code-Engine and press Create.
Step 3: Refresh your browser with your Code Engine project.
Now you will notice that you can select Actions -> Monitoring.
Inspect the monitoring posibilities
Step 1: Expore the given monitoring posibilities
For more details please use the IBM Cloud Code Engine documentation for monitoring.
Congratulations, you have successfully completed this hands-on lab
Application Monitoringof the workshop. Awesome
