Gathering statistics about a transformed query (SQL Annotator)
You can use the SQL Annotator feature to gather statistical information about database objects that are used for access path selection and a cost estimate for running a particular query. This information can help you understand how a query is processed by the Db2 optimizer.
SQL Annotator produces two forms of output: a formatted query that shows the intermediate SQL statement before query transformation, and a transformed query that shows the SQL statements after query transformation.
Note: This feature requires a Db2 Query Workload Tuner for z/OS (QWTz) license. Make sure you have a valid license installed before you use this feature. See Software requirements for using the SQL tuning features for more information.
-
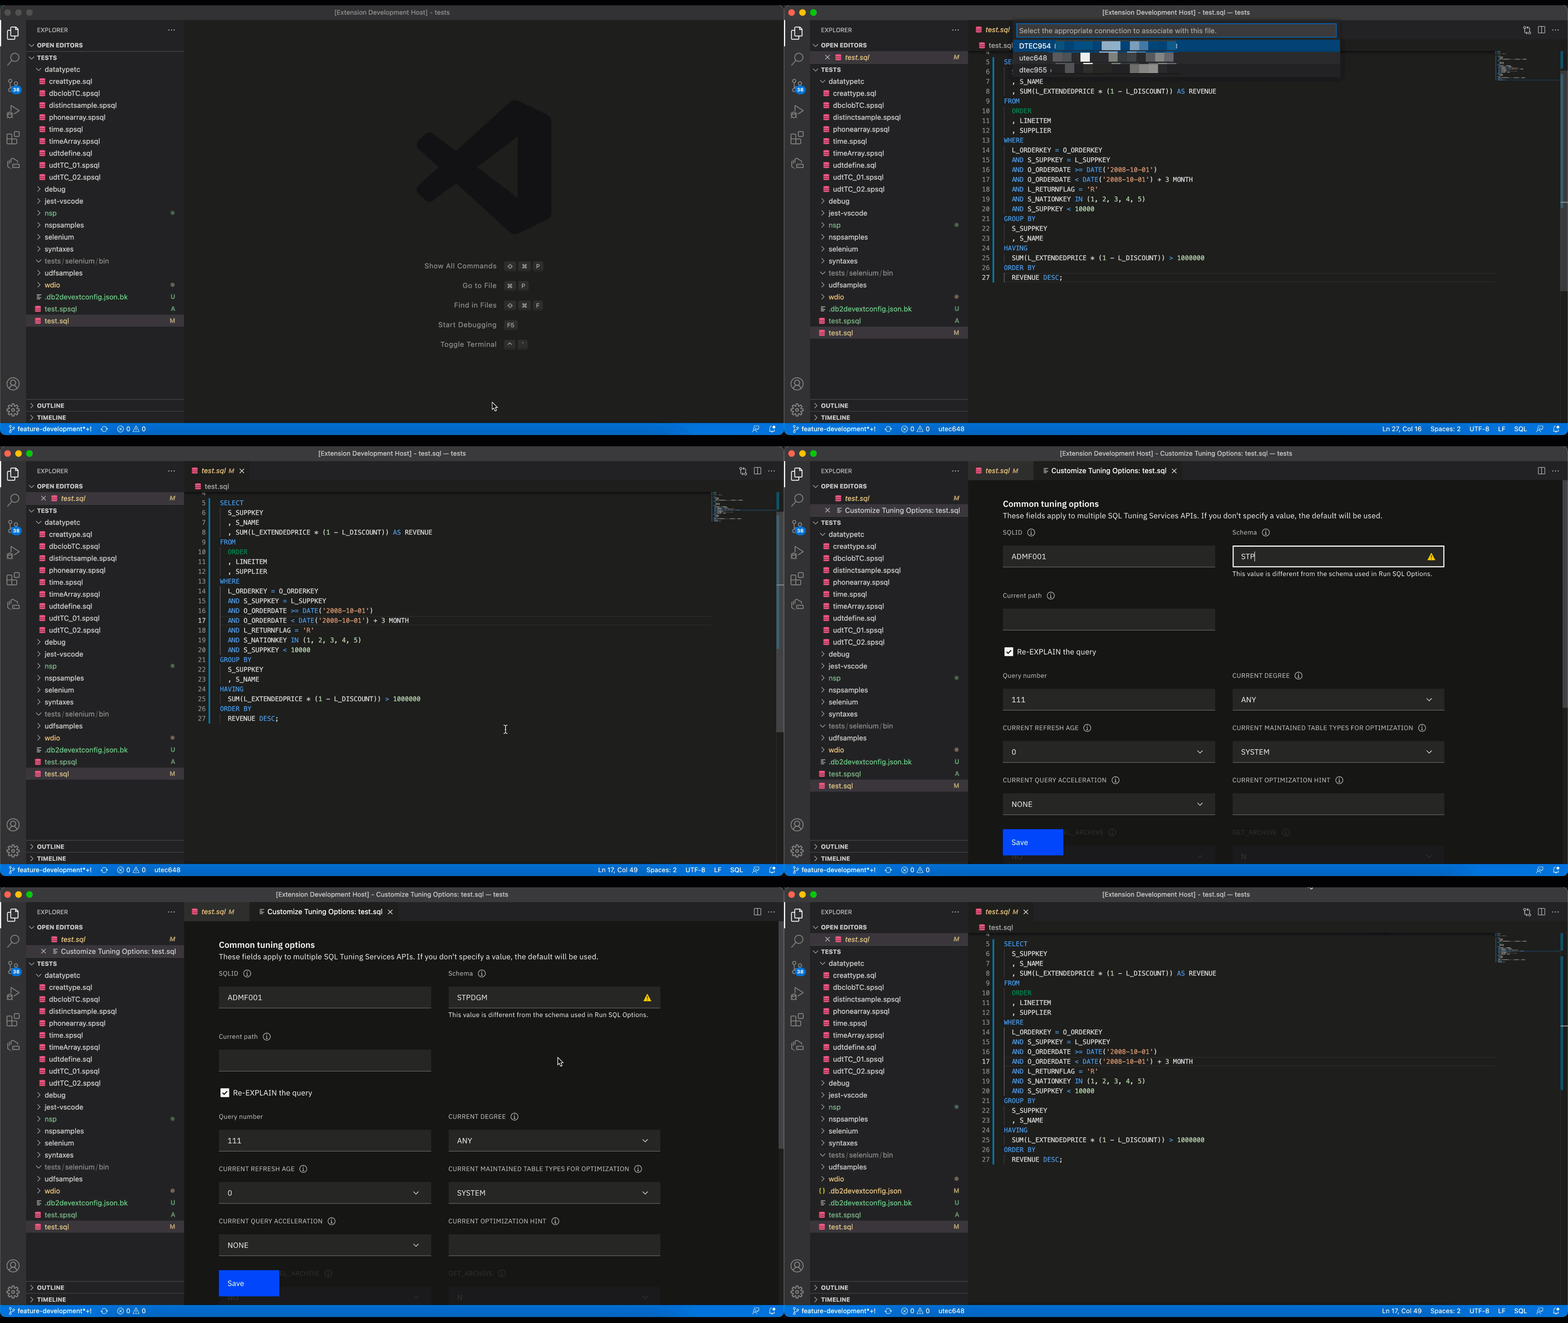
Open an SQL file and click on the connection in the Status Bar. Select a Db2 connection from the list that’s displayed. If you are using a tuning profile, make sure the connection that you select already has a tuning profile associated with it. If not, see Creating a tuning profile.
Note: The message “No connection” is displayed in the Status Bar if a Db2 connection hasn’t been associated with the profile.
-
Right-click in the .sql file and select SQL Tuning Options. The Customize Tuning Options dialog is displayed.
-
Verify that the tuning options, such as SQL ID, schema, and current path, are correct for the environment that you want to capture.
-
If you changed any tuning options, click Save. Otherwise, close the Customize Tuning Options dialog. The SQL statement is redisplayed.

-
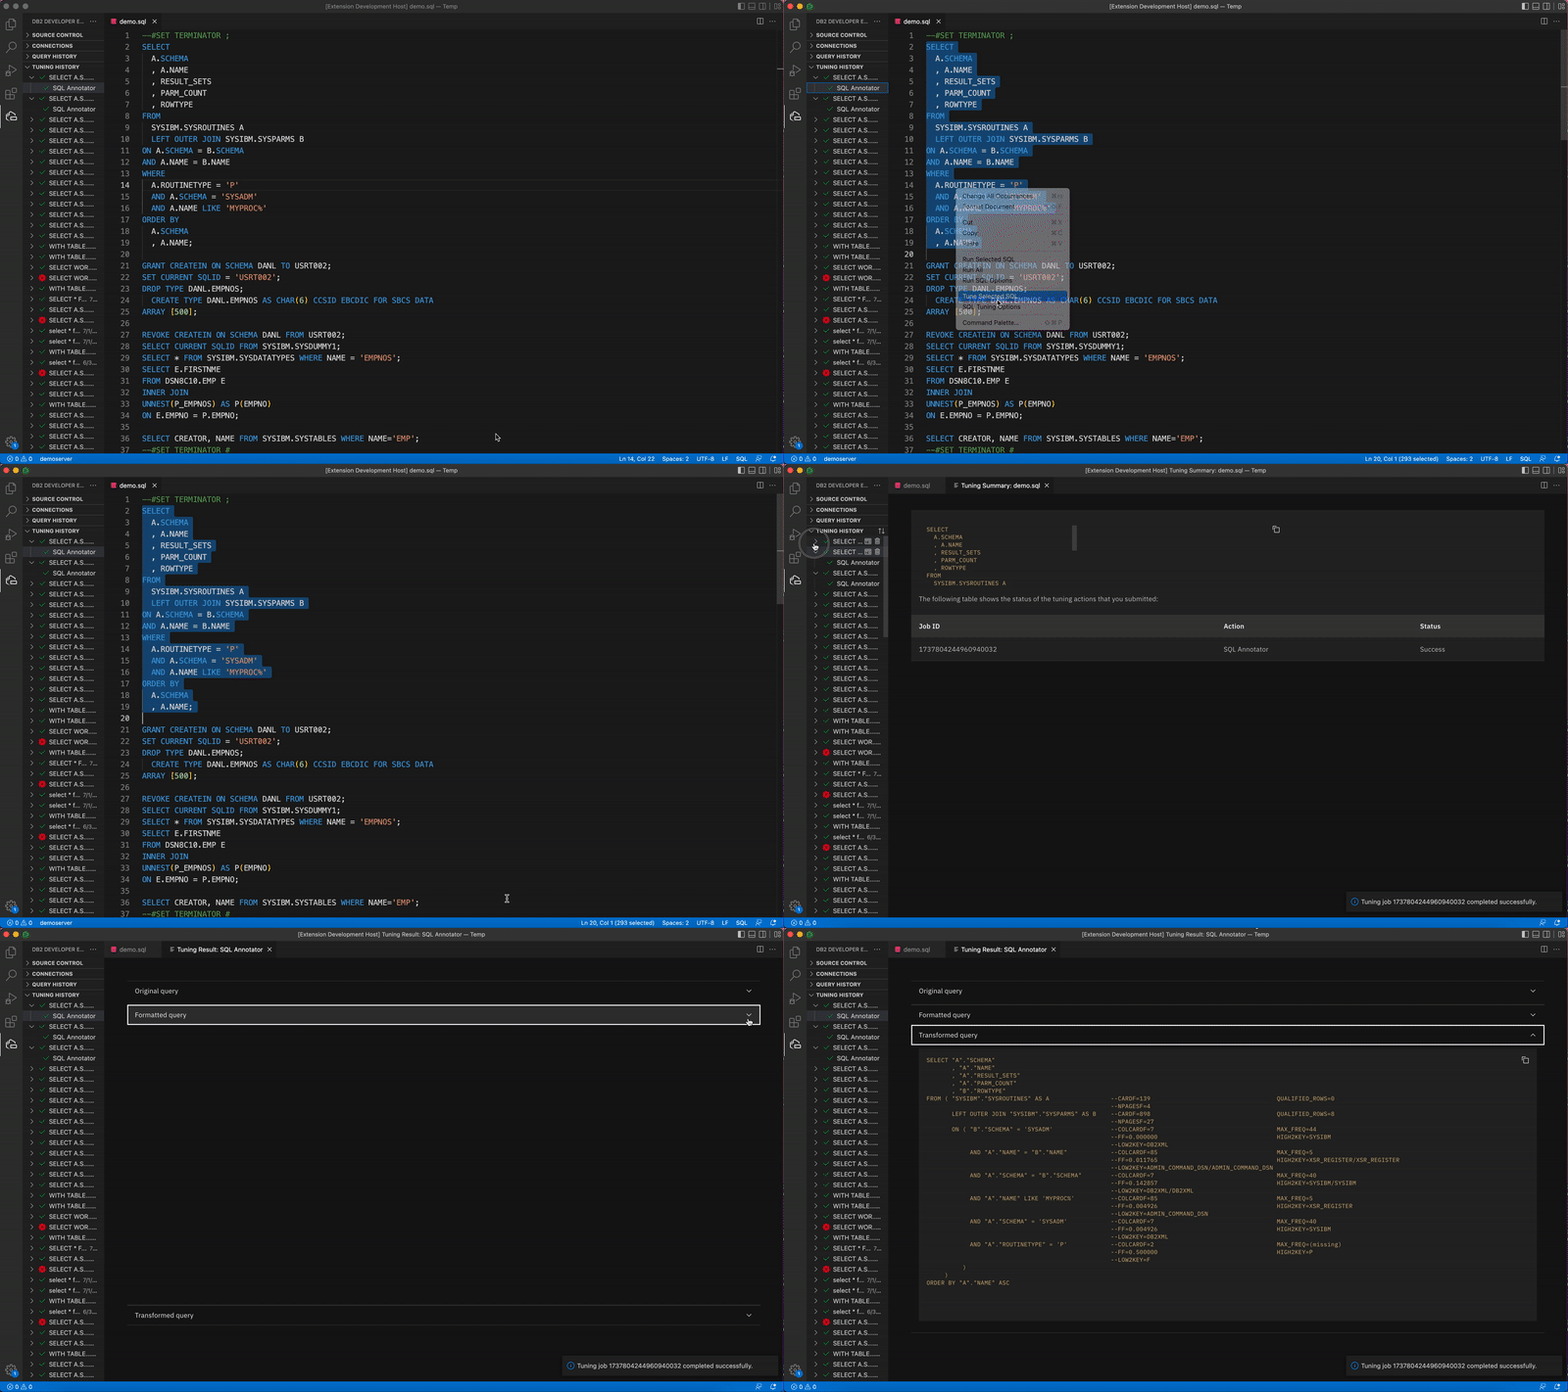
Select the entire statement, right-click, and select Tune Selected SQL. The Tuning Actions dialog opens in the right side of the editor, and the statement is displayed at the top of the dialog.
-
Select the SQL Annotator checkbox and click Tune. The Tuning Summary window opens, which shows that the status for SQL Annotator is Pending. When the job completes, the status changes to Success, and the TUNING HISTORY view is populated with the result.
-
Click SQL Annotator in the TUNING HISTORY view. The original query is displayed at the top of the view, followed by the formatted query and the transformed query. Comparing the formatted query and the transformed query can help you identify and correct access problems for the query.
-
The Formatted query is the query that’s been prepared for query transformation along with statistical information about the database objects and cost estimates. The syntax of the formatted query is typically identical to that of the original query, but in formatted SQL each table reference, column reference in the SELECT clause, and predicate is displayed on a separate line.
A formatted query provides the following information:
- For tables, it provides the CARDF and NPAGES catalog statistics. A cost estimate is indicated by the number of qualified rows (QUALIFIED_ROWS).
- For predicates, it provides the COLCARDF, MAX_FREQ, LOW2KEY, and HIGH2KEY catalog statistics. A cost estimate is indicated by the filter factor (FF) for each predicate.
-
The Transformed query is the query that has been modified by Db2 to improve access path efficiency. It also includes the statistical information about the database objects and cost estimates that are included with the formatted query.

-
-
Evaluate the accuracy and completeness of the statistics for the objects used in the query to identify access path problems for that particular query. Based on your analysis, perform the appropriate remedies, such as gathering missing statistics or rewriting the query.