Debugging native and external SQL stored procedures and user-defined functions
This article shows you how to use the Db2 Developer Extension tool to debug native and external SQL stored procedures and user-defined functions (UDFs).
Note: Although the screens in this topic show a stored procedure, the process of debugging a UDF is identical.
Requirements
-
To enable the stored procedure debugging capabilities in Db2 Developer Extension, you must set up the Unified Debugger on Db2 for z/OS. See Debugging stored procedures by using the Unified Debugger for instructions.
-
For UDFs, only compiled scalar UDFs that include the VERSION parameter are eligible for debugging.
-
When you deploy a routine, you must set the Enable debugging option to On.
Debugging a routine
The Debug action allows you to debug your routine by using the native IDE debugger. You can set breakpoints in the editor, and you can watch values change over time in the debug environment. Setting conditional breakpoints is covered later in this topic.
You can also specify additional debugging options by using the Run SQL Options dialog. If input variables are specified in the SQL, you’ll be prompted to specify values for them before the SQL goes through debugging.
Note: If you are using multi-factor authentication, you will be prompted to enter an MFA token twice: when you first connect to Db2 and again when you initiate the debugging process. Use the IBM Verify app to generate these MFA tokens. You can eliminate the need to generate a new token for the second request if the MFA_AUTHCACHE_UNUSED_TIME and AUTHEXIT_CACHEREFRESH=ALL Db2 subsystem parameters are set appropriately.
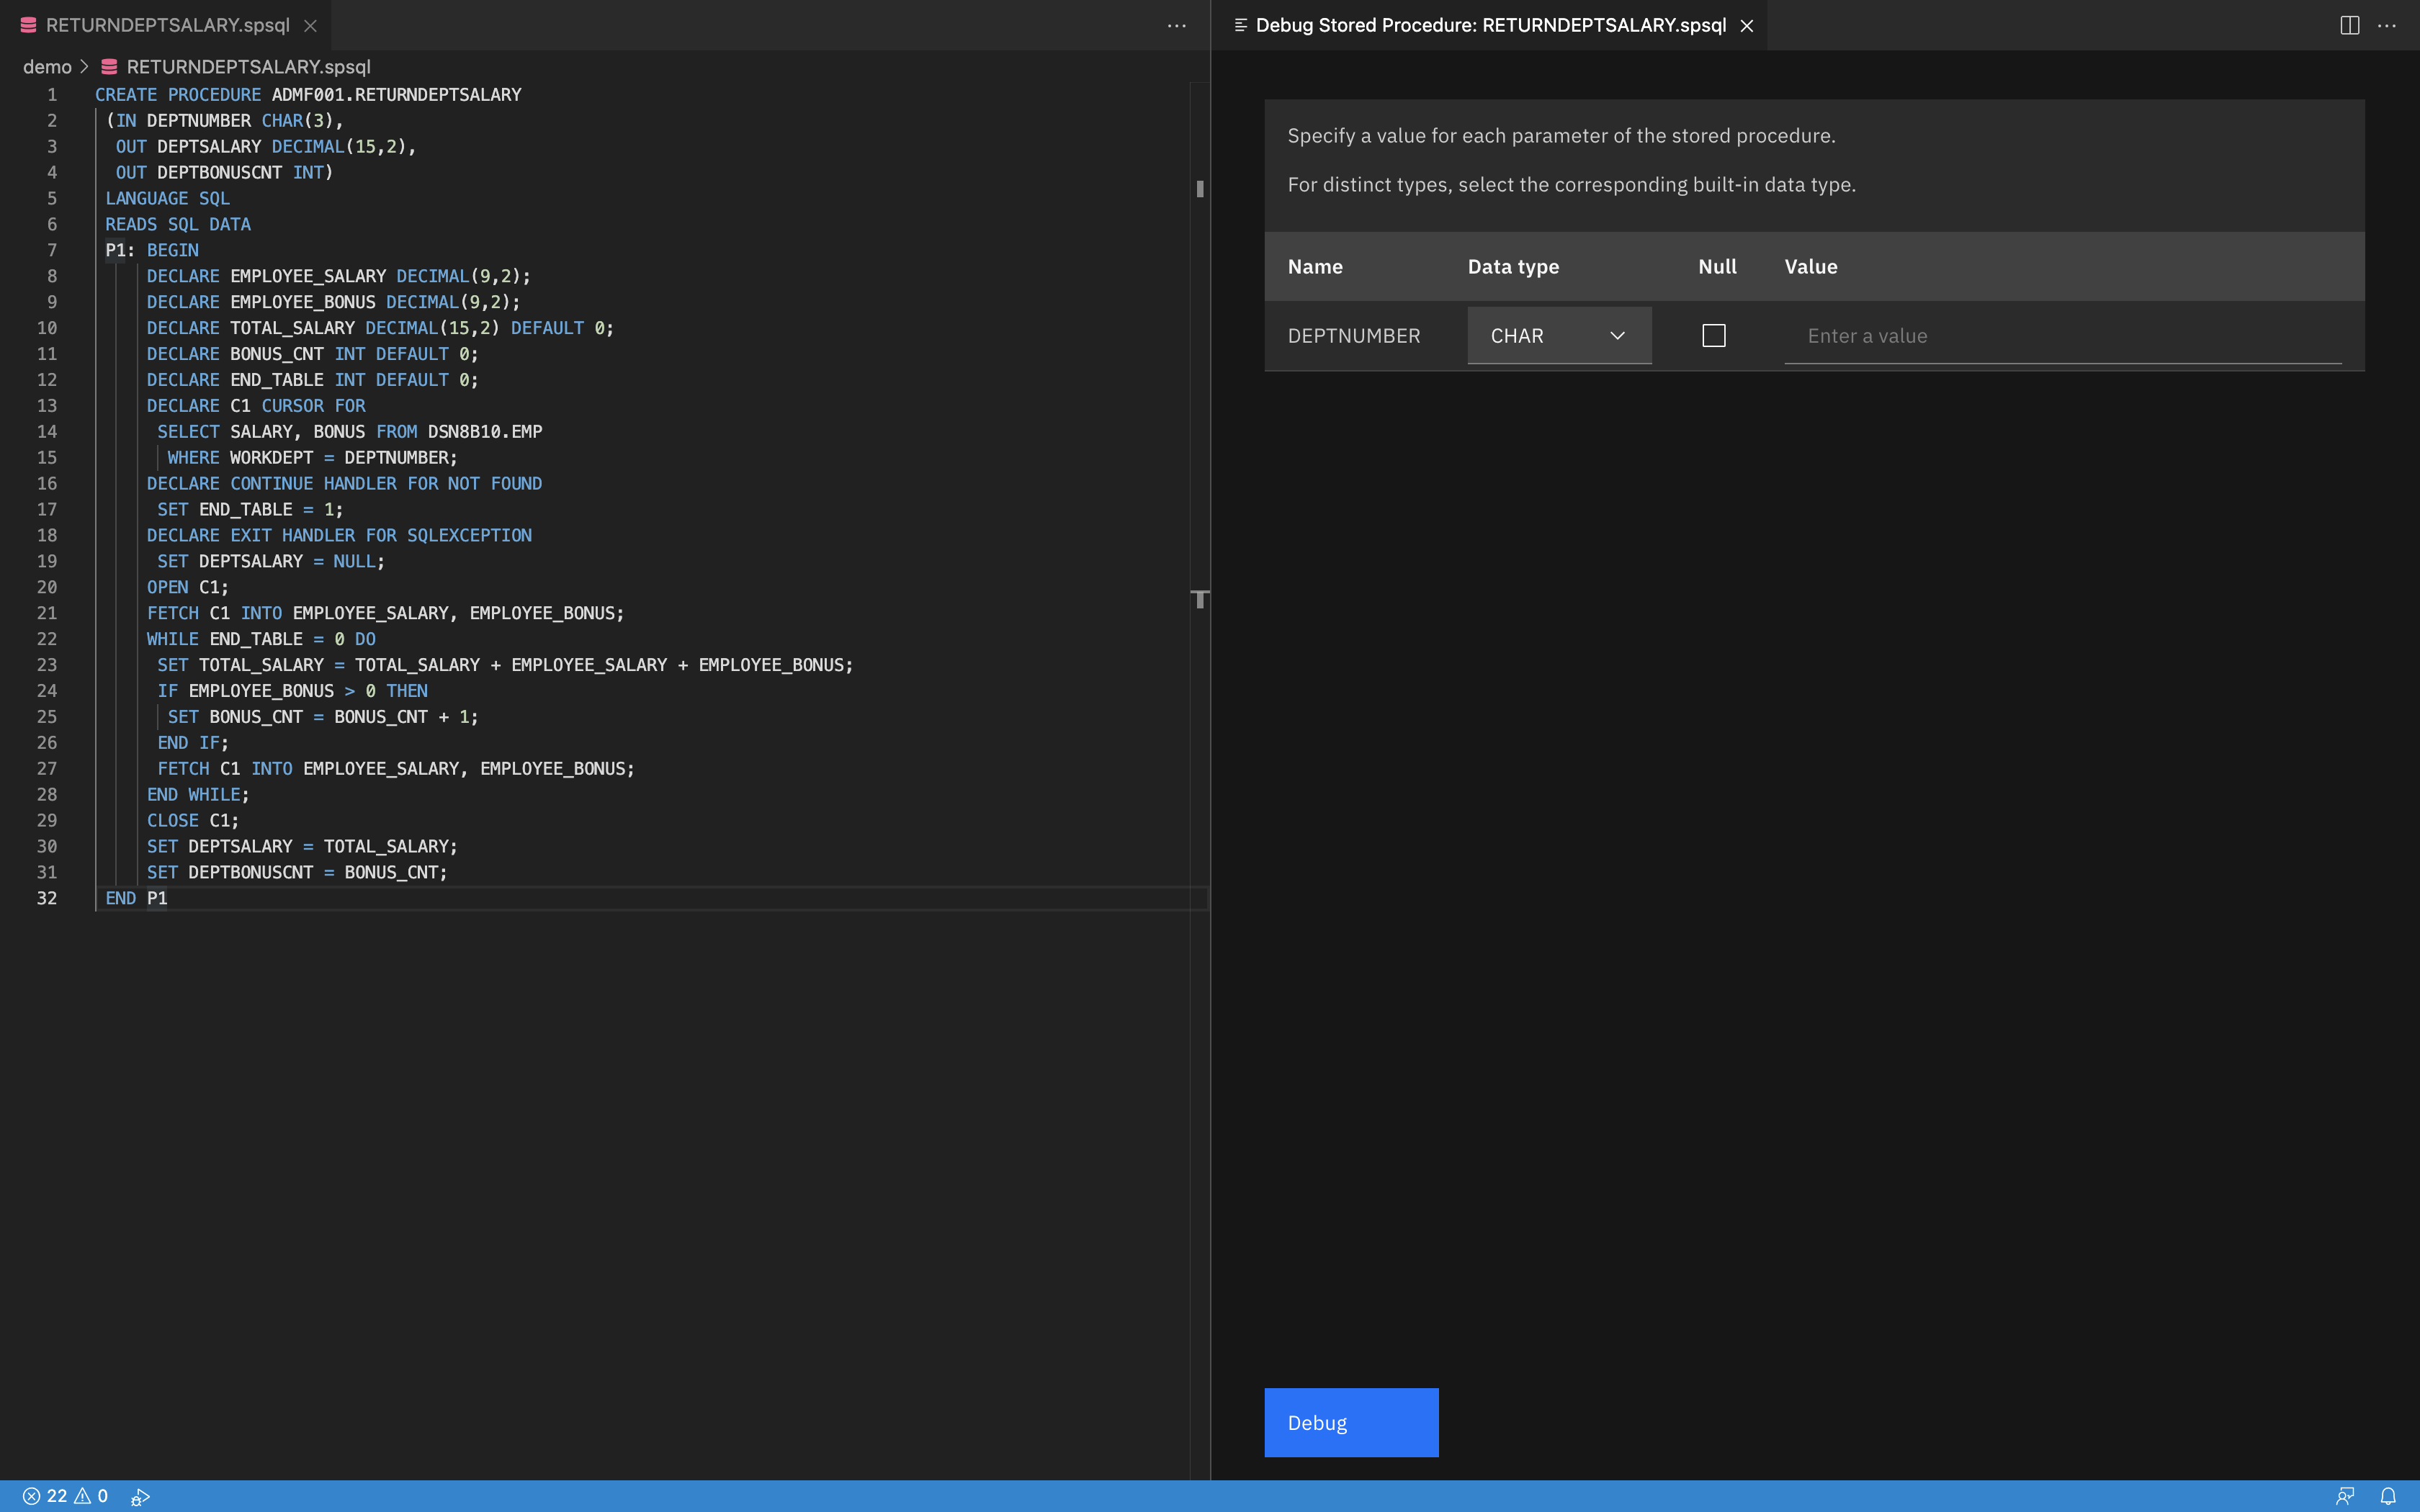
Click the Debug action to start debugging process. If your routine contains input variables, you’ll be prompted to specify values for them before the SQL goes through debugging, as shown in the following figure. Note that built-in data types for each input variable are detected automatically and are set to the correct data type.
Note: Only native SQL stored procedures can include a mix of NULL and non-NULL elements in the array input values (for example: [value1; NULL; NULL; value4; NULL; value6]).
After you specify input parameter values, click Debug. Set the breakpoints for where you want the debugger to pause execution:
When the debugging process starts, the following toolbar is displayed at the top of the view:
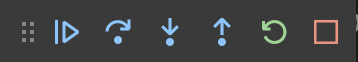
You use this toolbar to step through your code. From left to right, these actions are:
-
Continue execution of the program until it hits a breakpoint, encounters an error, or completes
-
Step Over to the next line of the program in the same code level
-
Step Into the program to enter a deeper code level if the current line is a method
-
Step Out to the caller if the current code level is inside a method
-
Restart the debugging program
-
Stop the debugging program
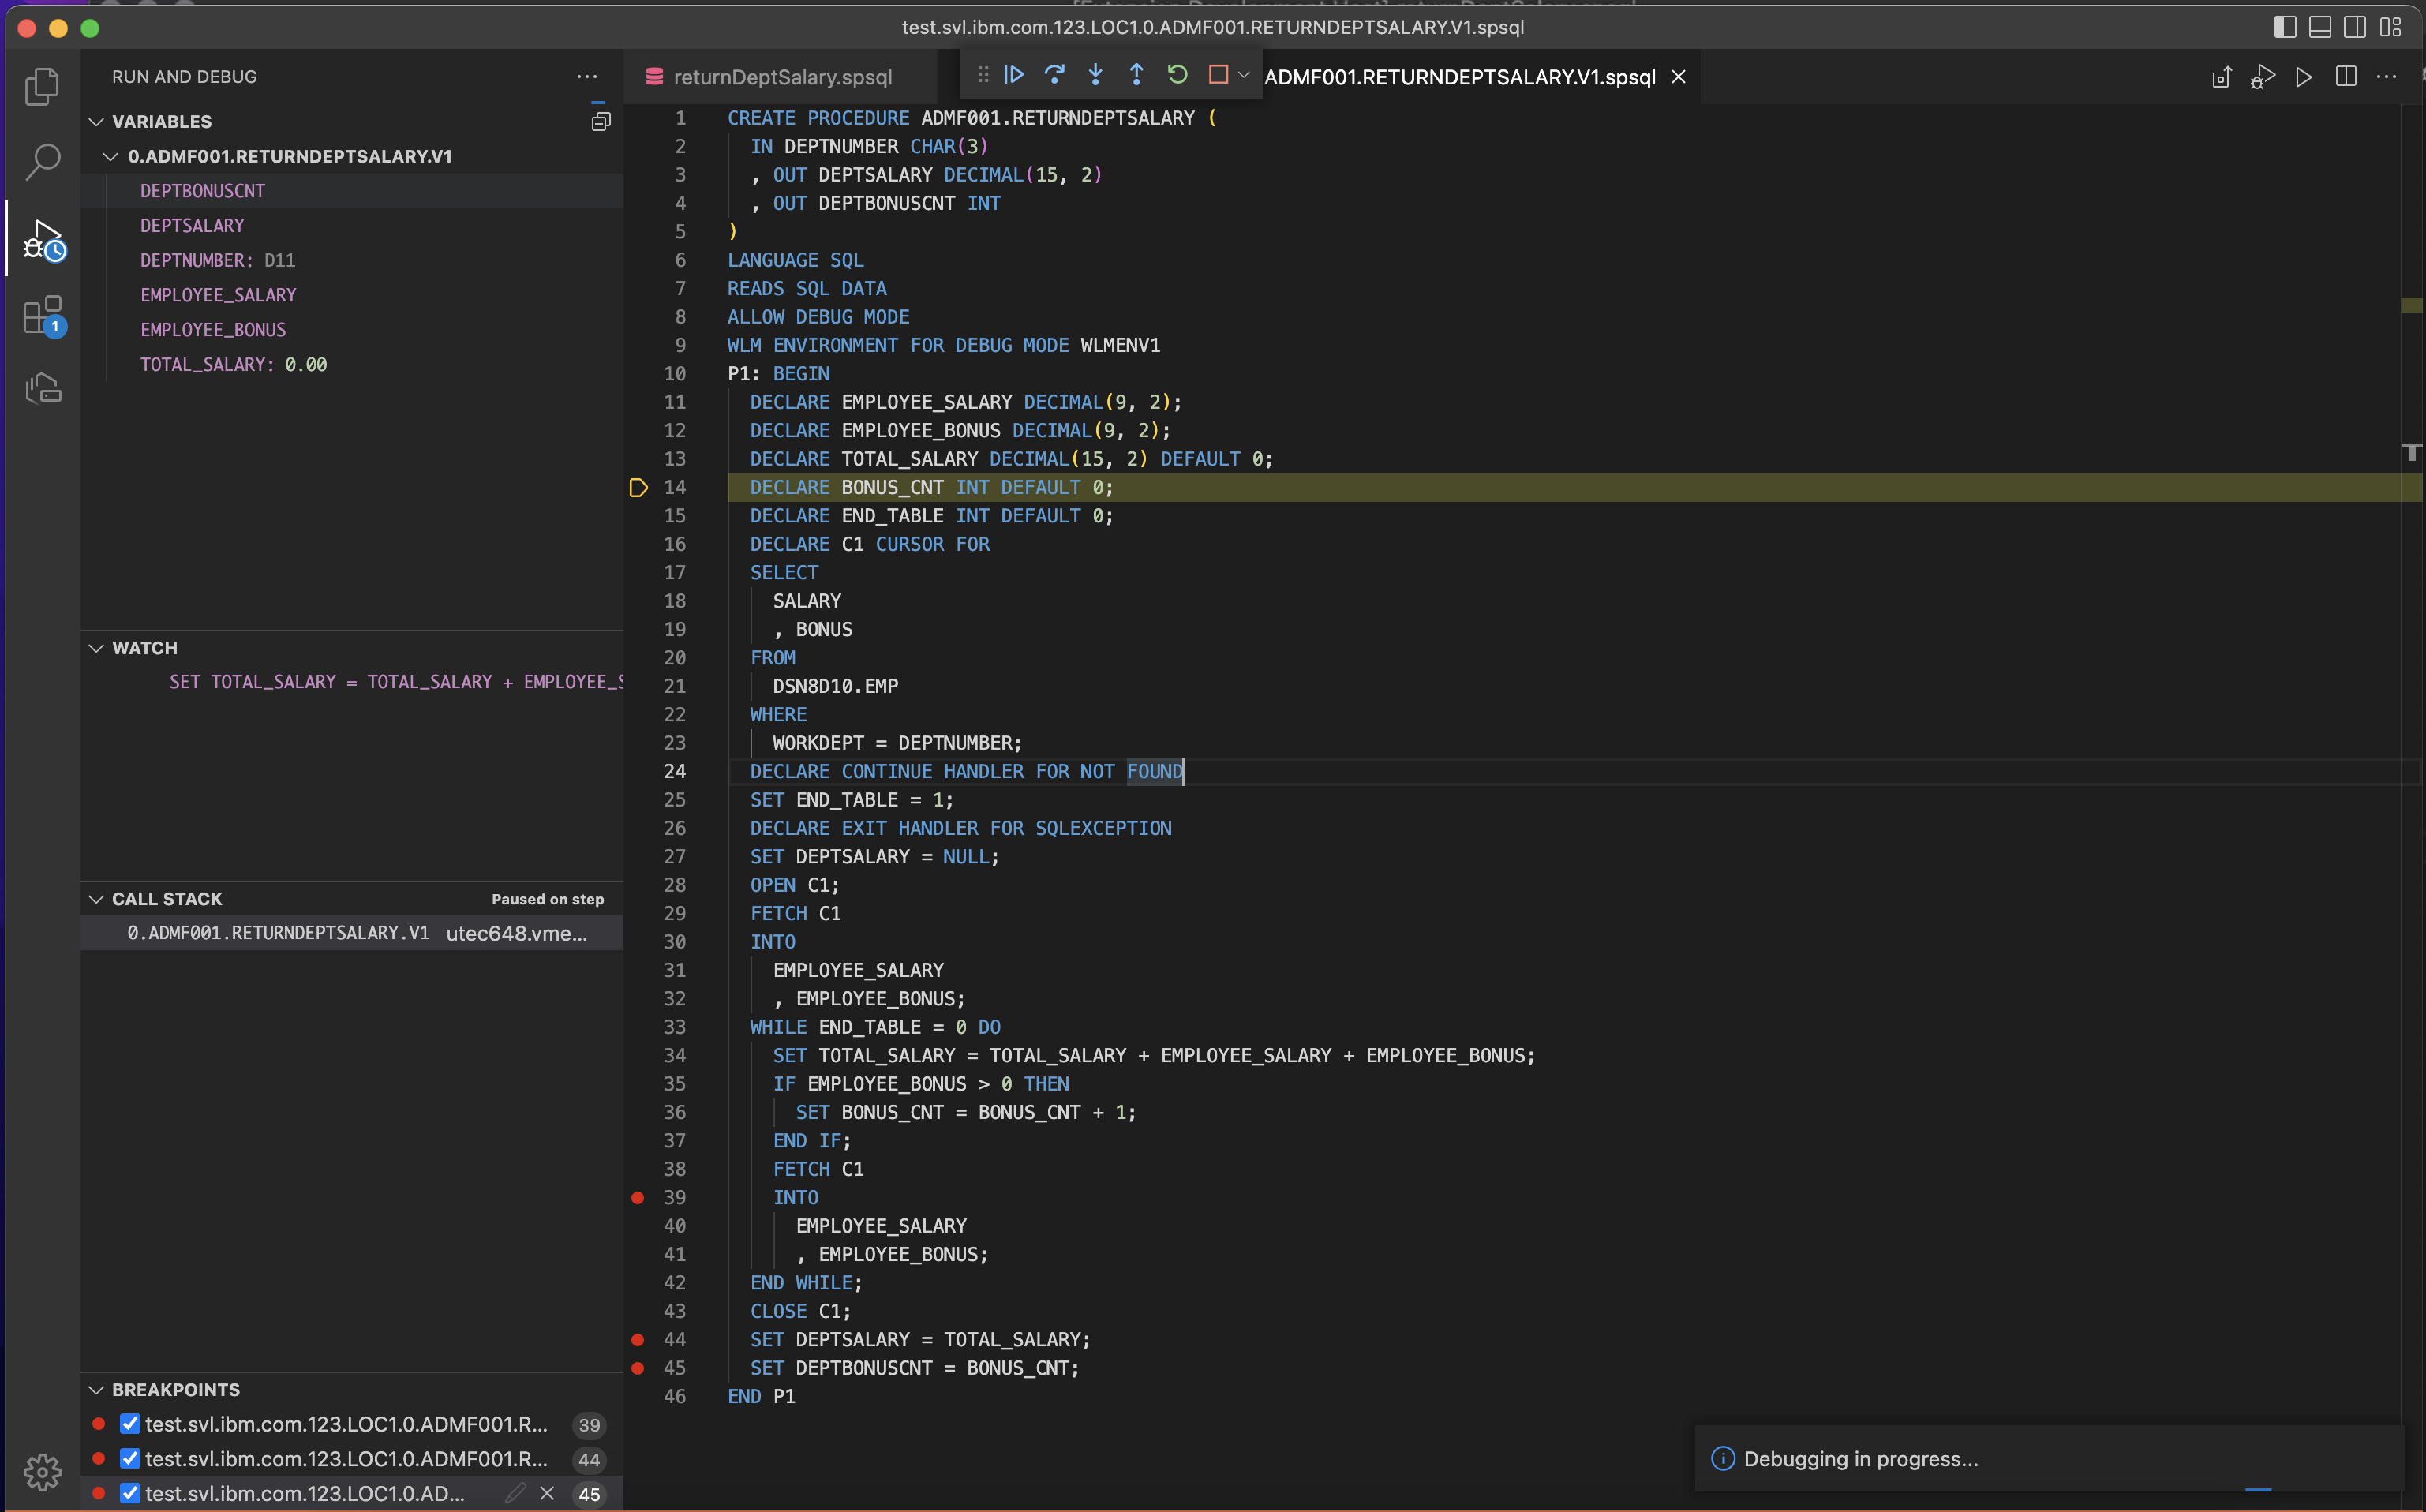
Click the Run and Debug icon in the Activity Bar (![]() ) to display the following sections:
) to display the following sections:
-
The Variables section contains variables declared through program execution and keeps track of the defined value of each variable as the debugger works its way through the code.
-
Use the Watch section to specify variables or expressions that you want to be evaluated by the debugger.
-
The Call stack section keeps track of the current code level during debugger execution.
-
The Breakpoints section keeps track of the breakpoints set throughout the code module.
For more information about debugging your code in Visual Studio Code, see https://code.visualstudio.com/docs/editor/debugging.
Setting conditional hit-count breakpoints
You can specify a hit count when you define a breakpoint, which means that when the breakpoint is reached, instead of pausing, execution continues until the hit count that you specified is reached. This feature is useful when you debug routines that contain loops. You can allow execution to continue for the specified number of loops, and then debug the code when that number is reached.
To set a breakpoint that includes a hit count:
- For a routine that has already been deployed, right-click and select Debug Routine.
- Set any input parameters that need to be set.
- Click Debug. A .spsql or .udfsql file opens and the debugger starts at the top of this file.
- Click the line that you want to set the conditional breakpoint for, then right-click and select Edit Breakpoint > Add Conditional Breakpoint > Hit Count. (Note that in this release, the Expression and Log Message options are not supported.)
- Specify the number of times the loop should be run before the debugger pauses.
- Click Continue (
 ) to proceed with debugging.
The breakpoints that you set persist on the file. You don’t need to reset these breakpoints if you want to debug this file again.
You can clear breakpoints by deselecting them in the BREAKPOINTS view or by clicking on and removing them individually from the file.
After you’re familiar with the basic debugging process, check out Advanced techniques for debugging native and external SQL stored procedures.