Debugging external Java and SQLJ stored procedures
This topic shows you how to use Db2 Developer Extension to debug external Java and SQLJ stored procedures.
Before you begin
-
You must deploy the Java or SQLJ stored procedure before you can debug it. See Deploying and running external Java and SQLJ stored procedures for more information.
-
Debugging Java and SQLJ stored procedures requires the Debugger for Java extension, which is included with the Extension Pack for Java. If this extension is not already part of your VS Code environment, follow these instructions to install it from within VS Code.
Procedure
To debug an external Java or SQLJ stored procedure:
-
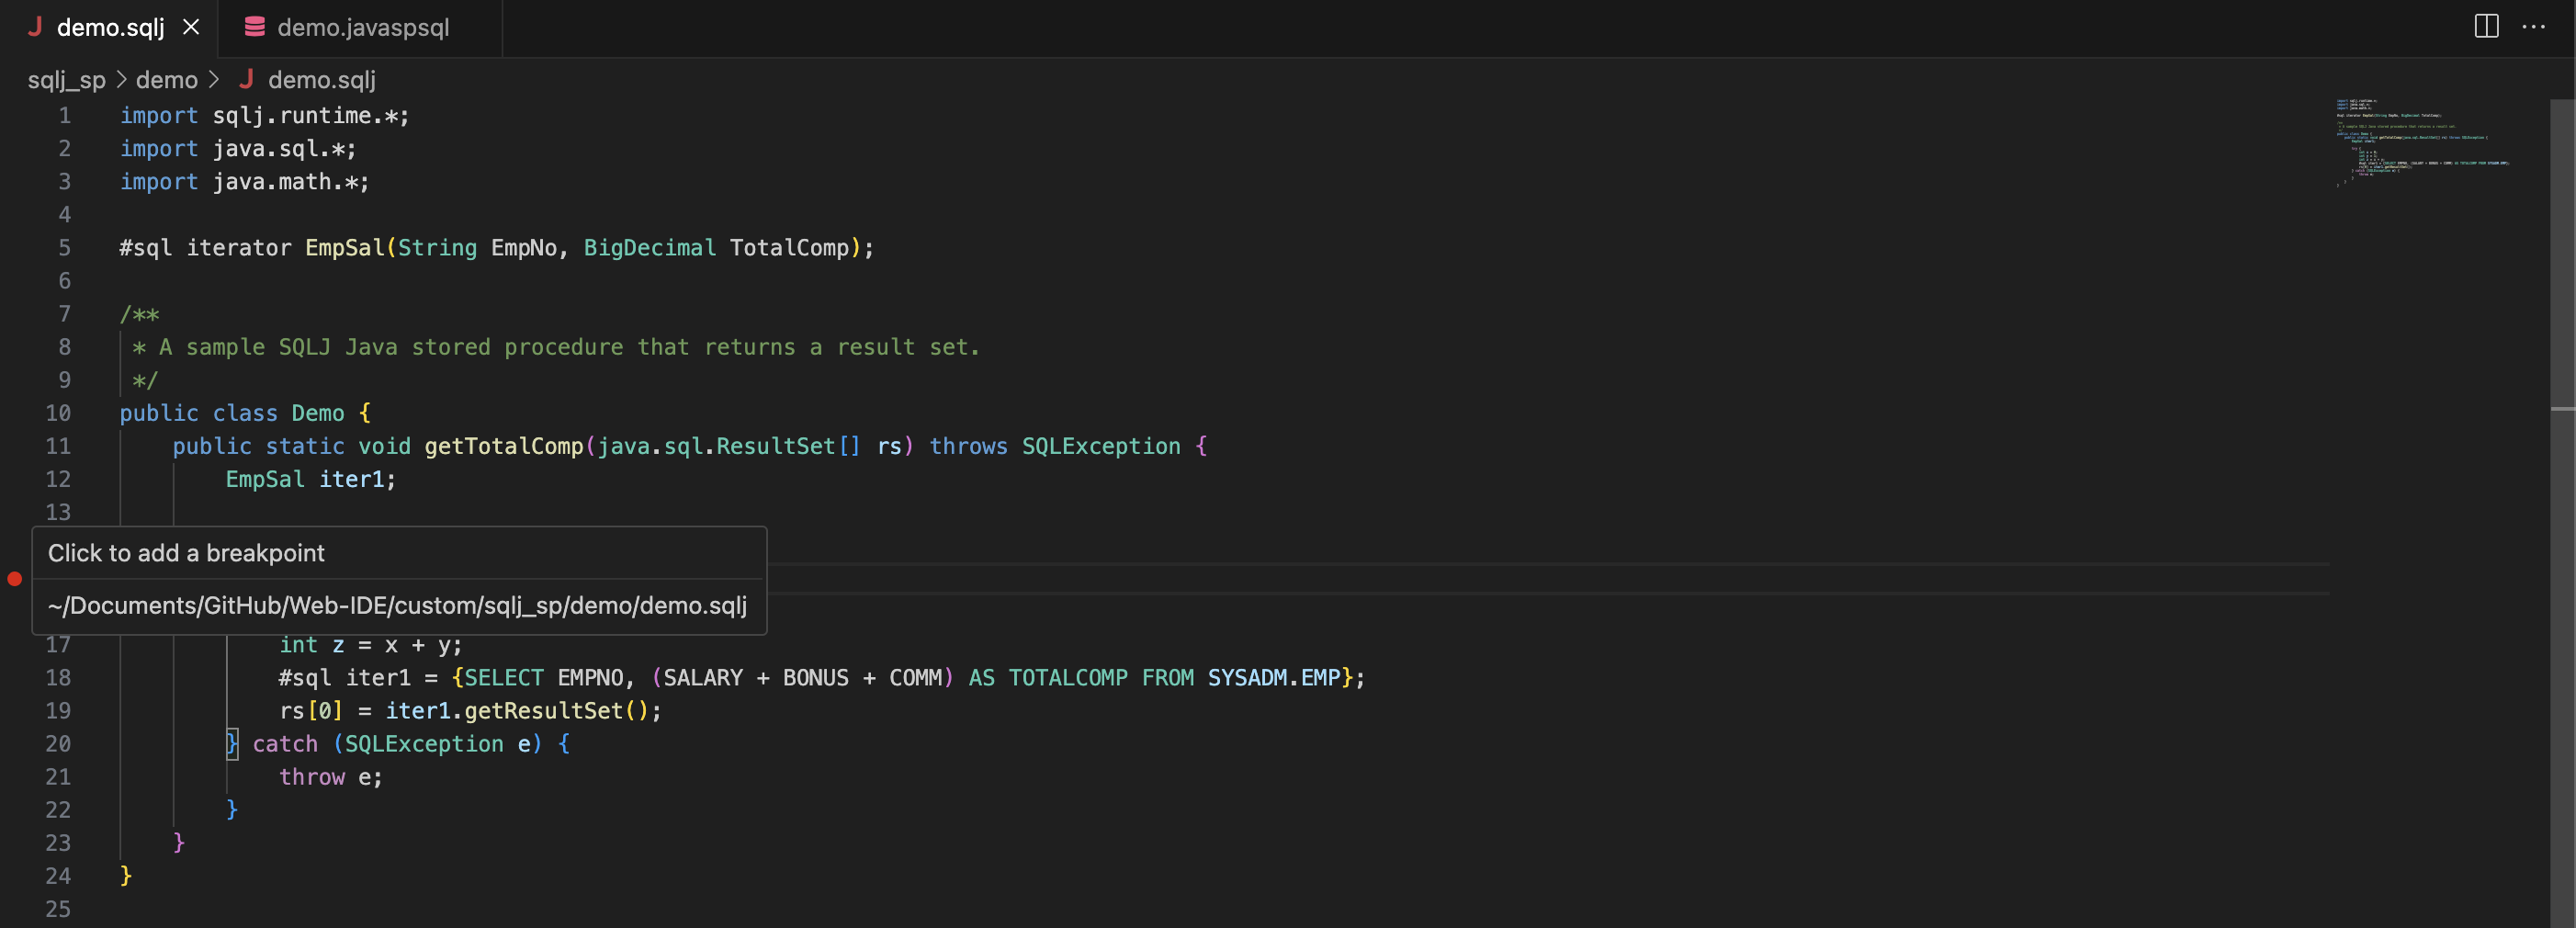
Open your .java or .sqlj source file and set the breakpoints for where you want the debugger to pause execution.

-
Open the .javaspsql or .spsql file that contains the DDL of the Java or SQLJ stored procedure and click the Debug Stored Procedure icon.

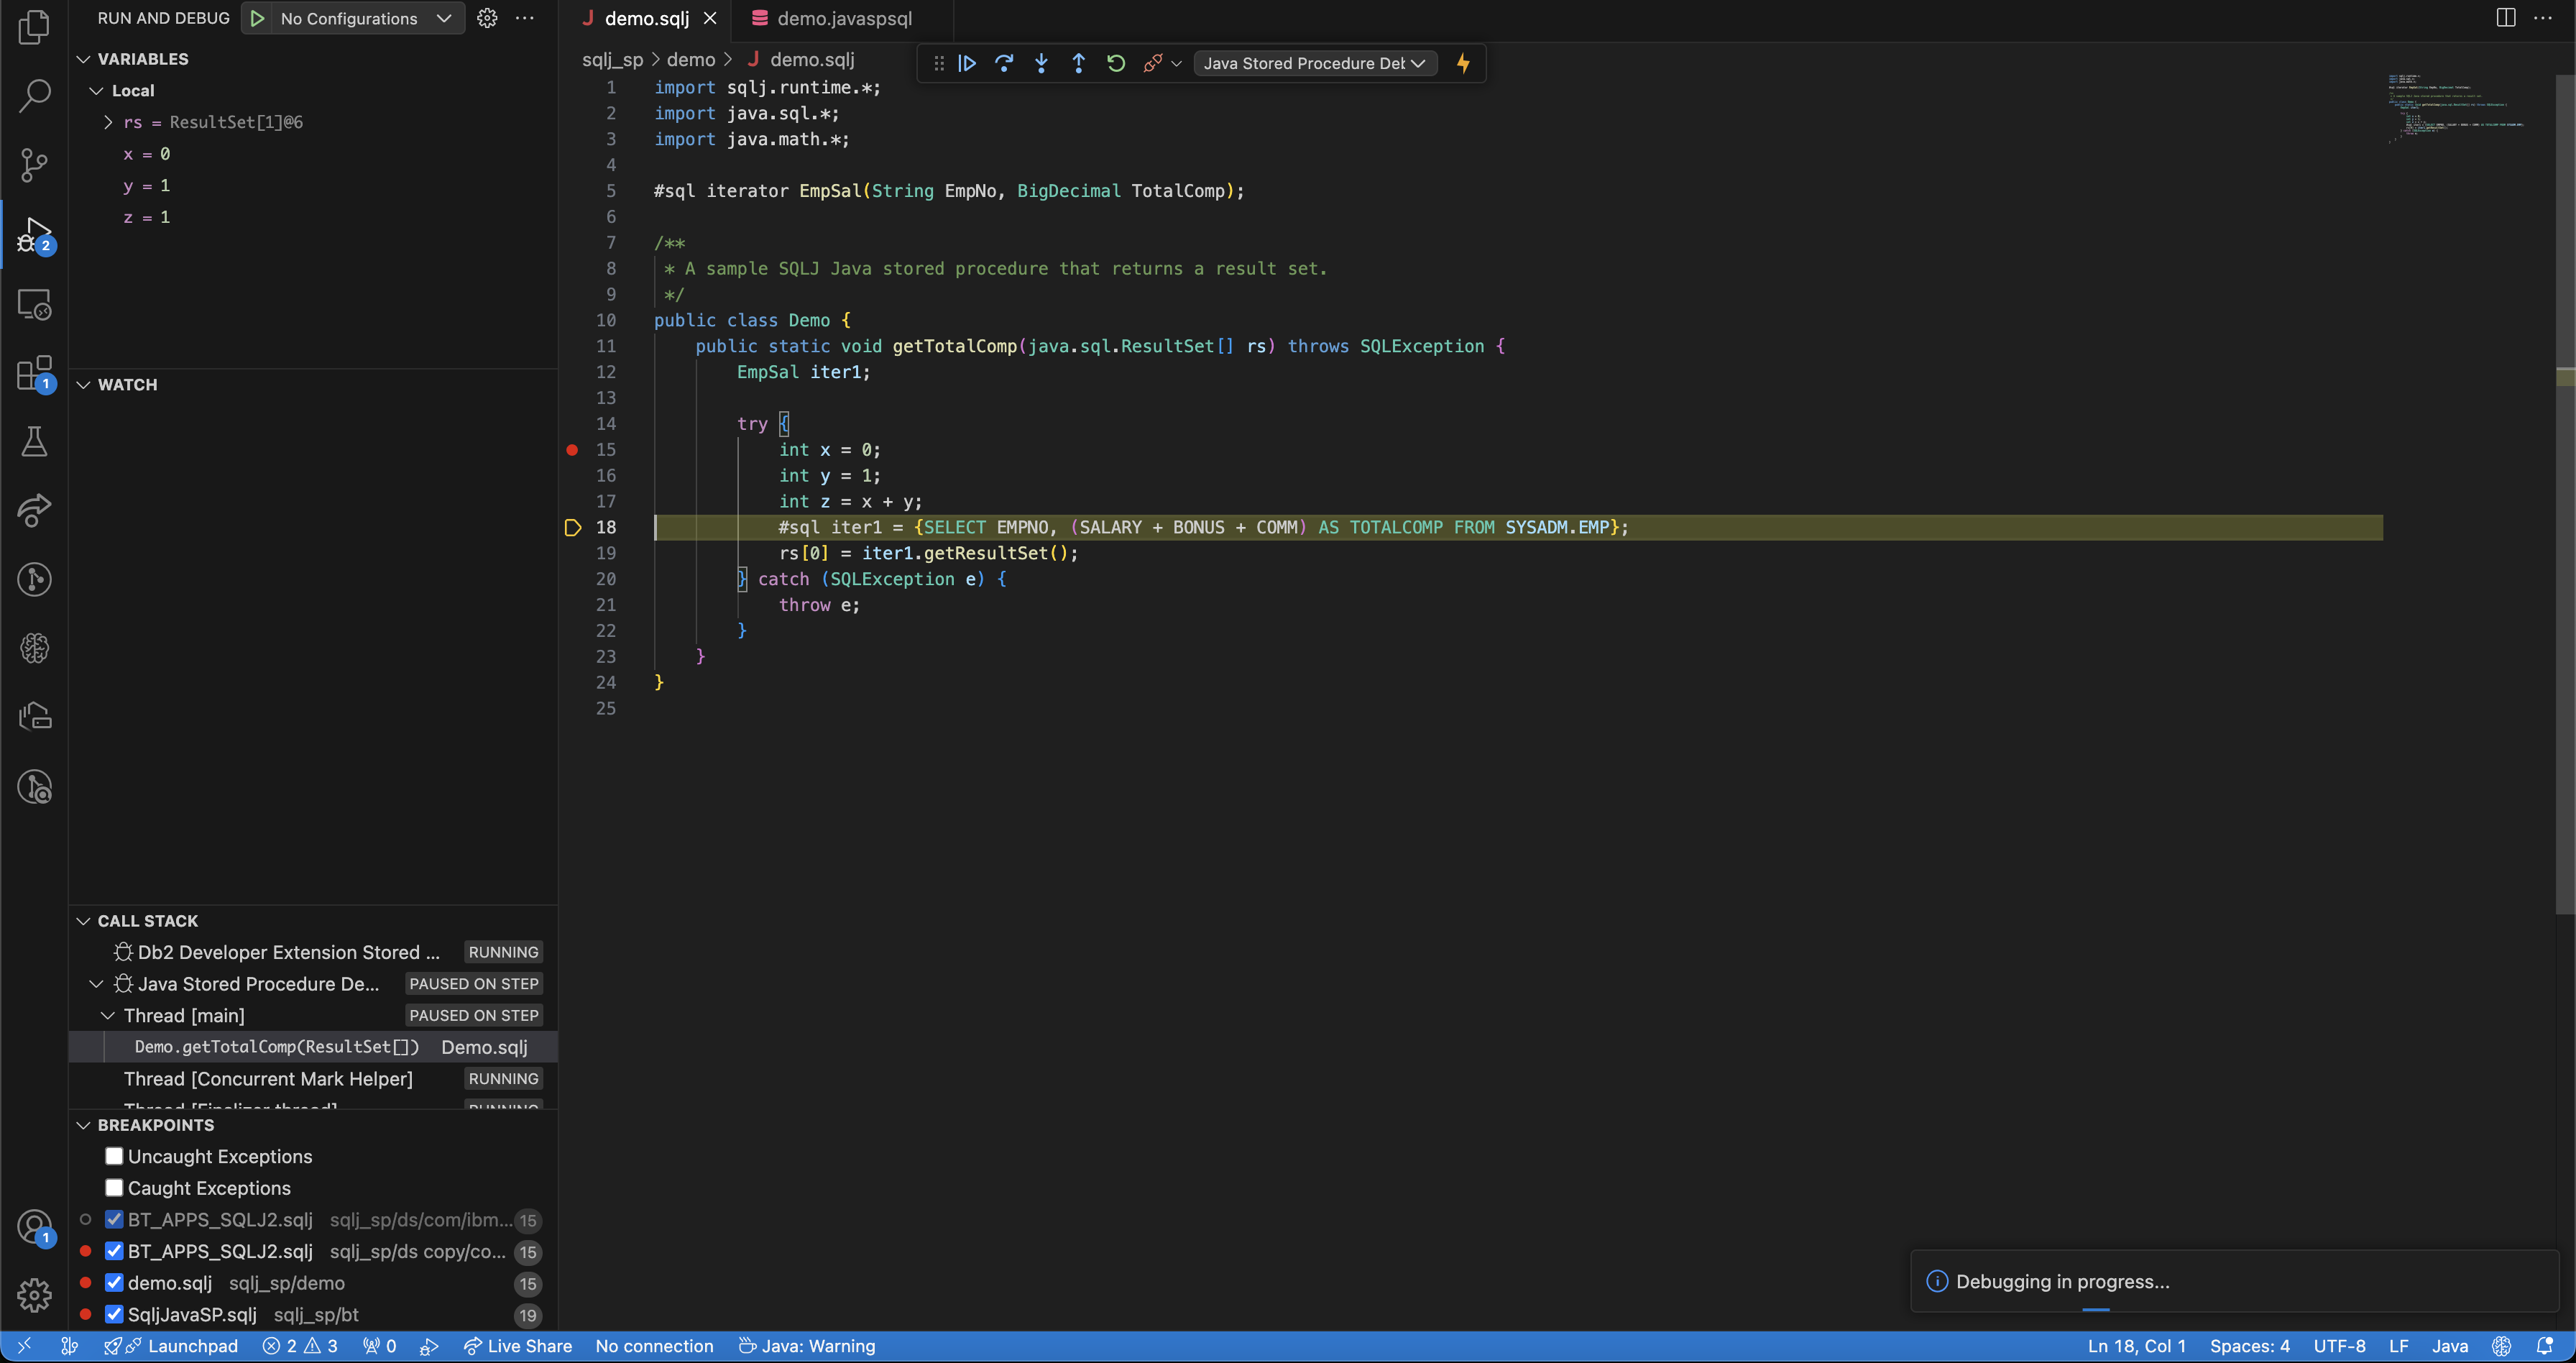
The file that you are debugging opens in the Debug view and debug processing begins.

When the debugging process starts, the following toolbar is displayed at the top of the view:

You use this toolbar to step through your code. From left to right, these actions are:
-
Continue execution of the program until it hits a breakpoint, encounters an error, or completes
-
Step Over to the next line of the program in the same code level
-
Step Into the program to enter a deeper code level if the current line is a method
-
Step Out to the caller if the current code level is inside a method
-
Restart the debugging program
-
Stop the debugging program
The Debug view also displays the following sections in the Primary side bar:
-
The Variables section contains variables declared through program execution and keeps track of the defined value of each variable as the debugger works its way through the code.
-
Use the Watch section to specify variables or expressions that you want to be evaluated by the debugger.
-
The Call stack section keeps track of the current code level during debugger execution.
-
The Breakpoints section keeps track of the breakpoints set throughout the code module.
For more information about debugging your code in Visual Studio Code, see https://code.visualstudio.com/docs/editor/debugging.
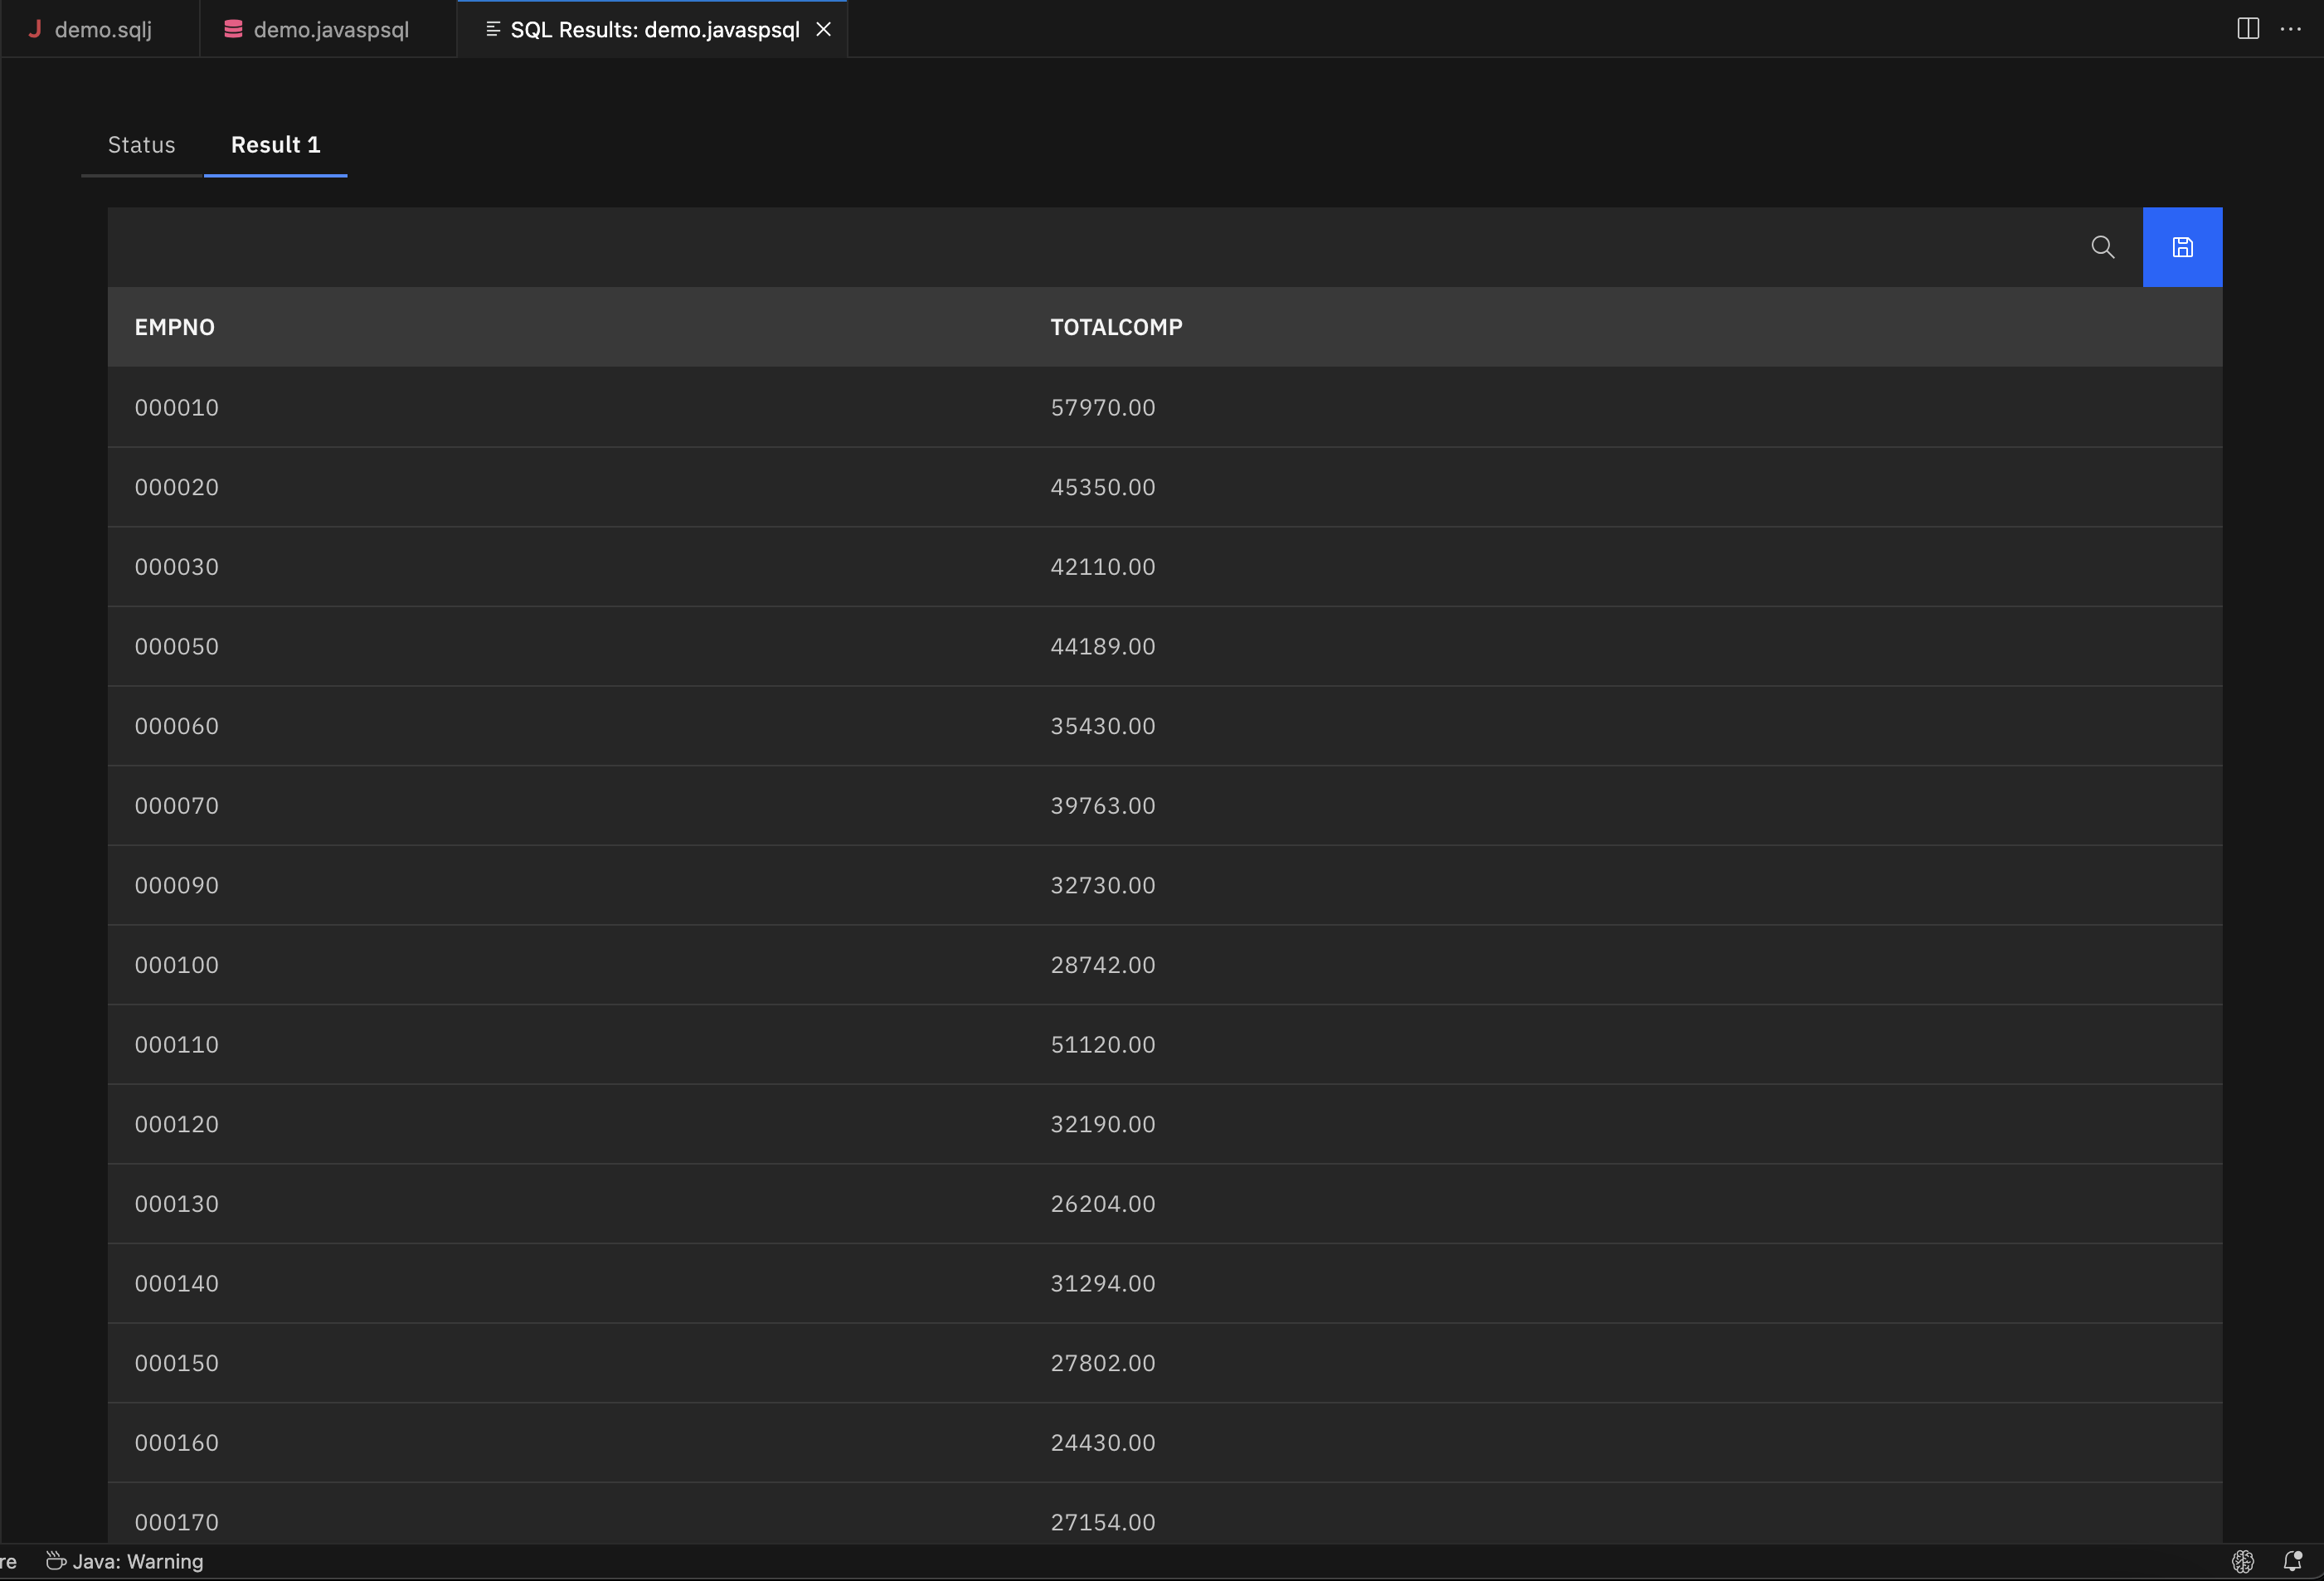
When debugging is complete, the results view will display the final results of the execution of the stored procedure.

-
Known issues
- For SQLJ stored procedures, inner classes and their methods cannot be stepped into. This behavior is consistent with the debugging capabilities of Data Studio.
- For SQLJ stored procedures, using functions in SQL statements prevents breakpoints from being verified in Debugger for Java and results in breakpoints being ignored.*
- Duplicate class names in different directories can cause the debugger to select the wrong class file for debugging.*
* This is a Debugger for Java issue and is not unique to Db2 Developer Extension.