Capturing your query environment
When working with IBM Support to resolve a performance problem with an SQL statement, you can use the Capture Query Environment feature to capture the statement’s environment in a set of files.
-
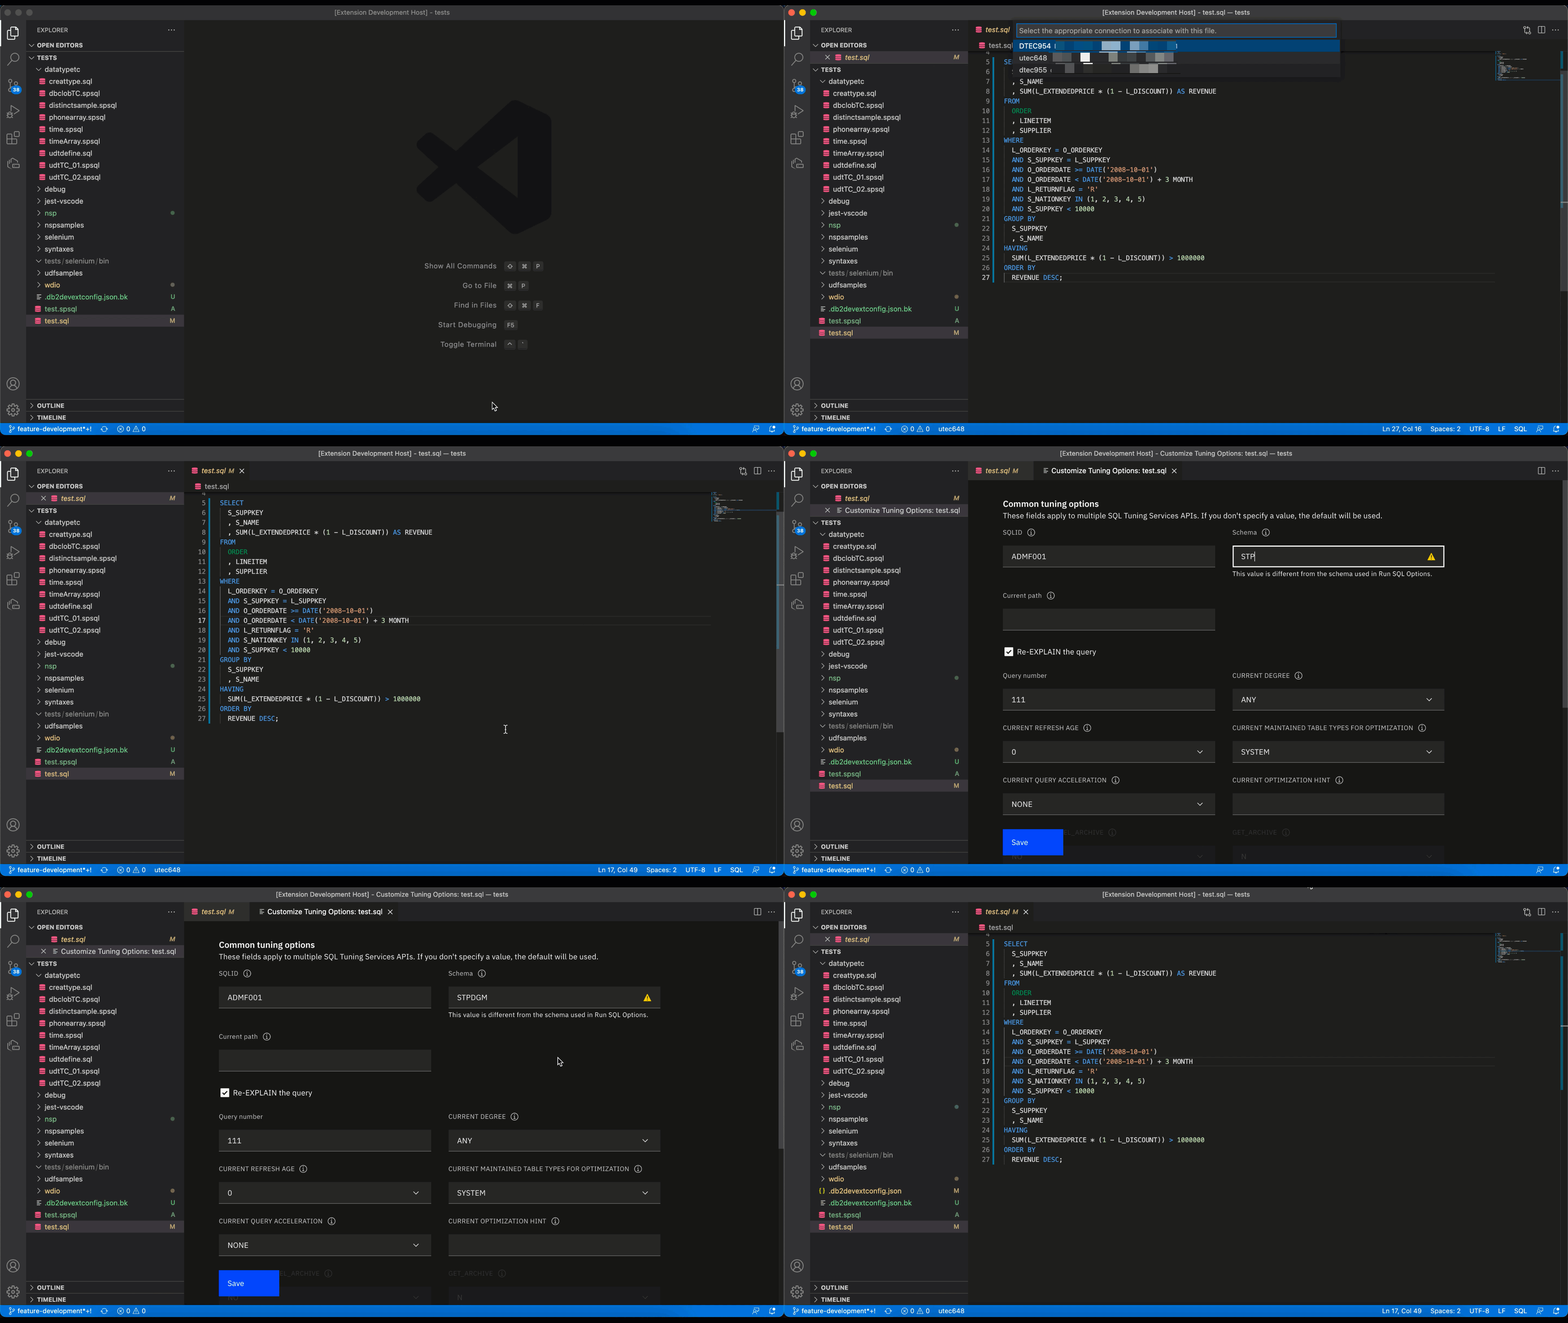
Open an SQL file and click on the connection in the Status Bar. Select a Db2 connection from the list that’s displayed. If you are using a tuning profile, make sure the connection that you select already has a tuning profile associated with it. If not, see Creating a tuning profile.
Note: The message “No connection” is displayed in the Status Bar if a Db2 connection hasn’t been associated with the profile.
-
Right-click in the .sql file and select SQL Tuning Options. The Customize Tuning Options dialog is displayed.
-
Verify that the tuning options, such as SQL ID, schema, and current path, are correct for the environment that you want to capture.
-
If you changed any tuning options, click Save. Otherwise, close the Customize Tuning Options dialog. The SQL statement is redisplayed.

-
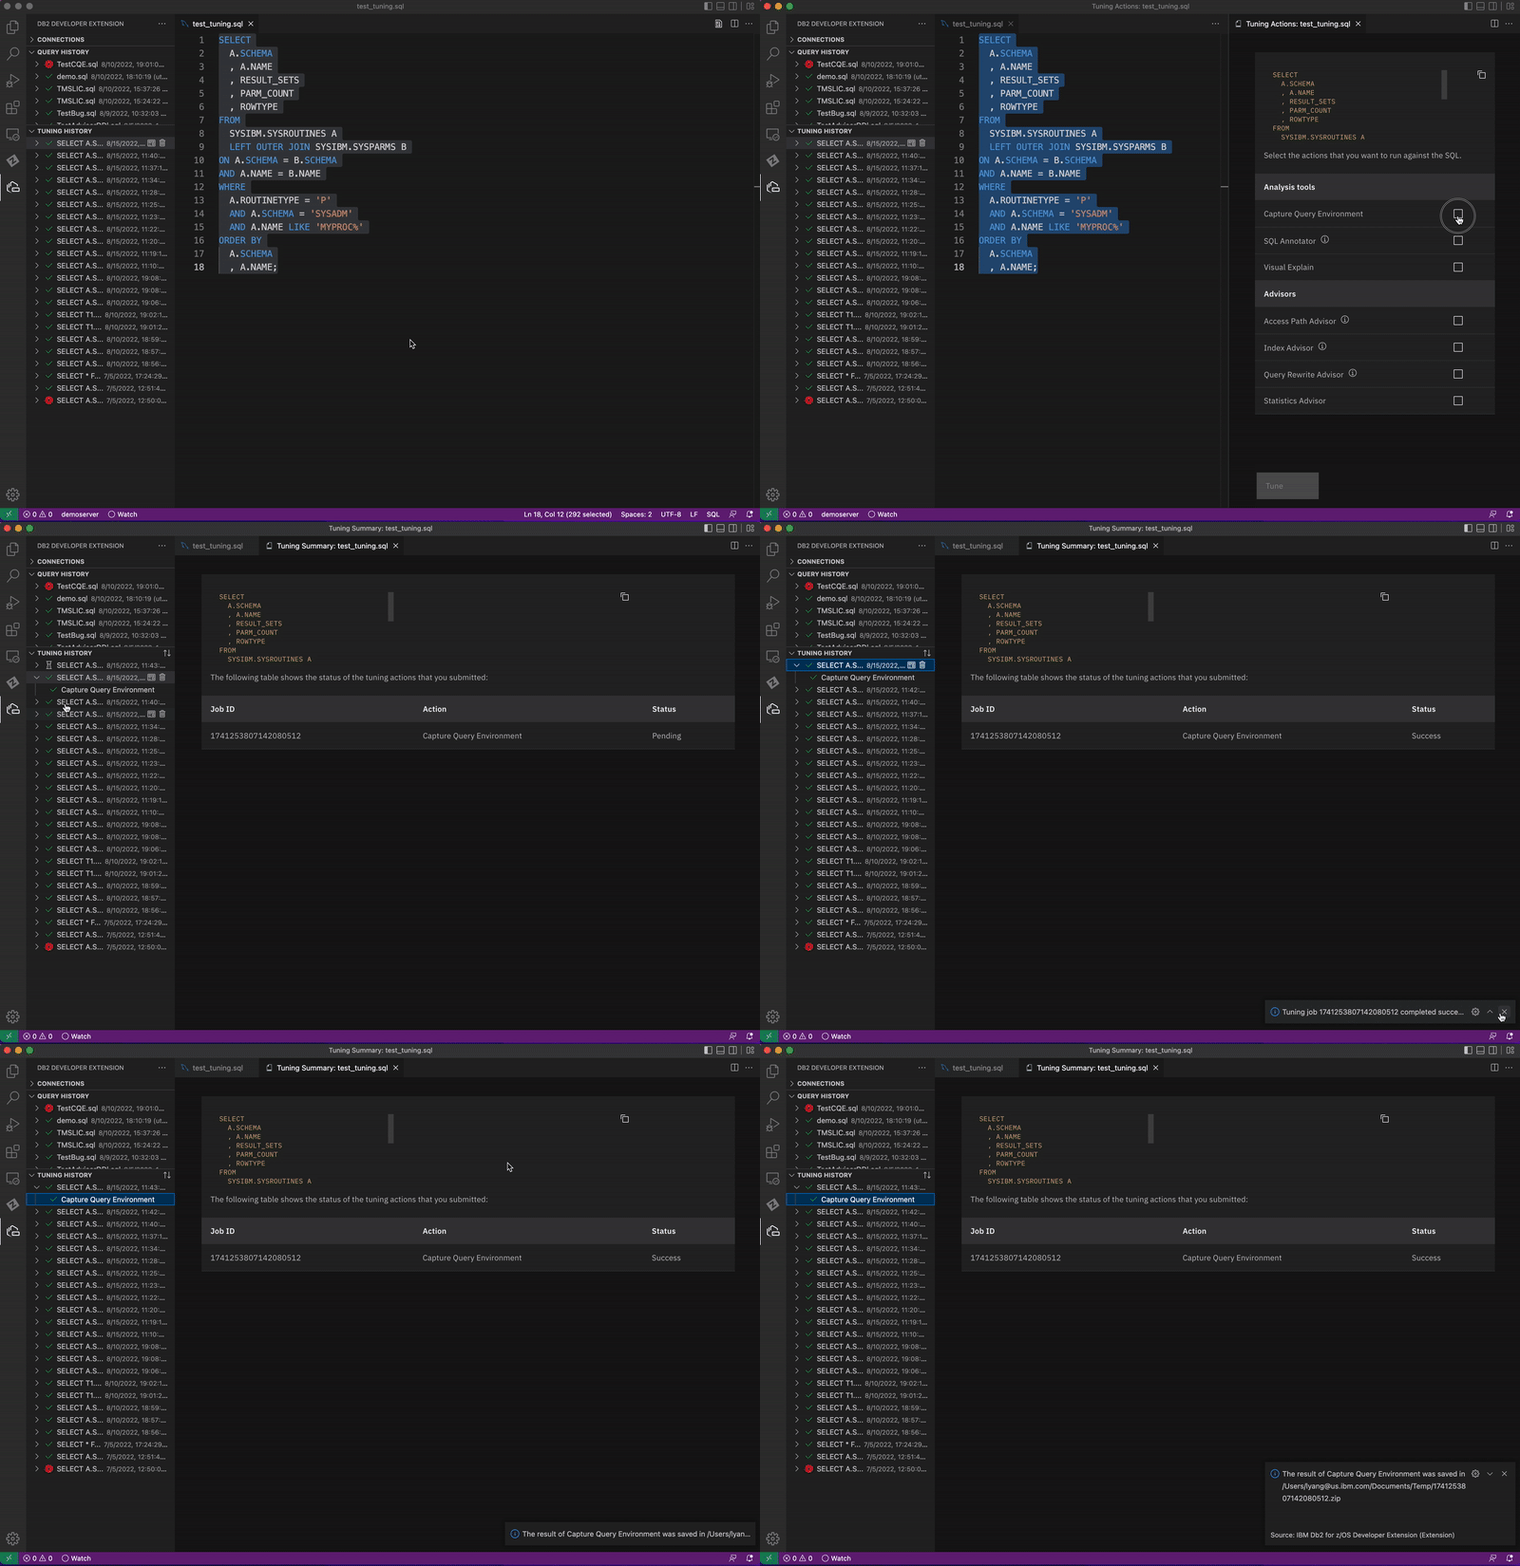
Select the entire statement, right-click, and select Tune Selected SQL. The Tuning Actions dialog opens in the right side of the editor, and the statement is displayed at the top of the dialog.
-
Select the Capture Query Environment checkbox and click Tune.
The Tuning Summary window opens, which shows that the status for Capture Query Environment is Pending. When the job completes, the status changes to Success.
-
From the TUNING HISTORY view, select Capture Query Environment, then specify the full path to contain the results.
-
Press Enter. A message is displayed that indicates that the results of running Capture Query Environment were successfully saved in the path that you specified.
-
Go to Explorer to locate the file.
