Debugging stored procedures
After you understand how to use Db2 Developer Extension to create a stored procedure and the basic process of deploying, running, and debugging stored procedures, you might need some more in-depth information about using Db2 Developer Extension to do debug more complex problems in native stored procedures (NSPs).
For example, many stored procedures contain extremely complex business logic, especially when nested stored procedures are involved. In these types of stored procedures, locating, analyzing, and fixing a problem can be quite a challenge.
This article uses two example stored procedures to show you how to step through nested stored procedures, set breakpoints, and modify stored procedure variable values at runtime.
The first example stored procedure is RETURNBESTDEPTINFO, shown in the following figure. This is the caller stored procedure. It will retrieve the list of department names from the WORKDEPT column of the DSN8D10.EMP sample table.
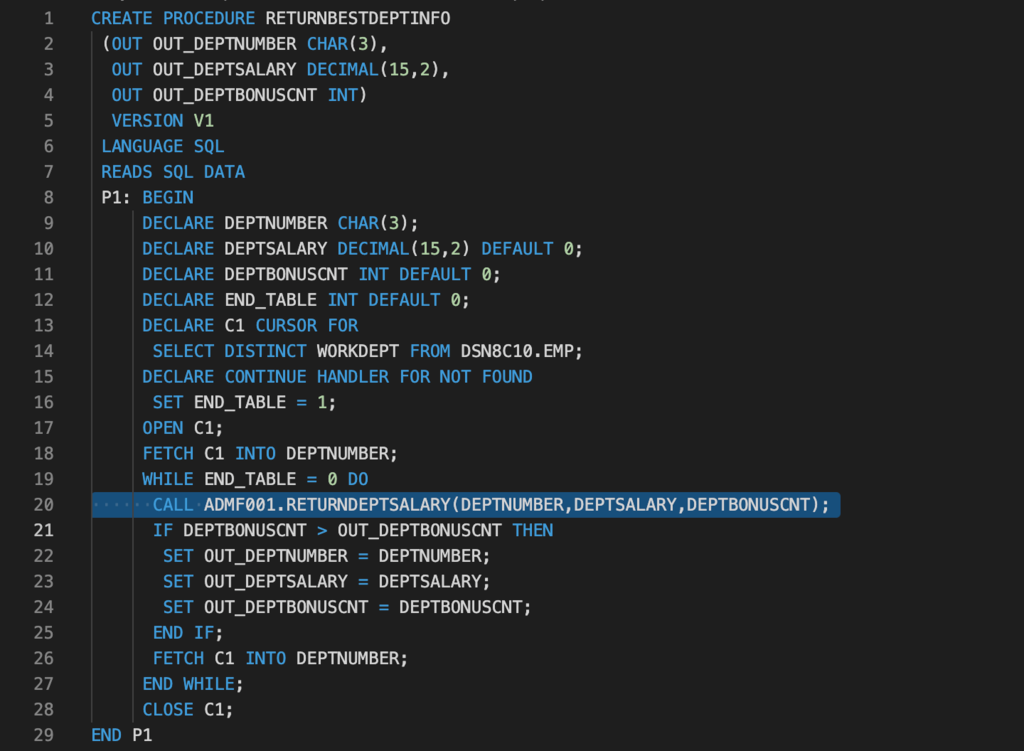
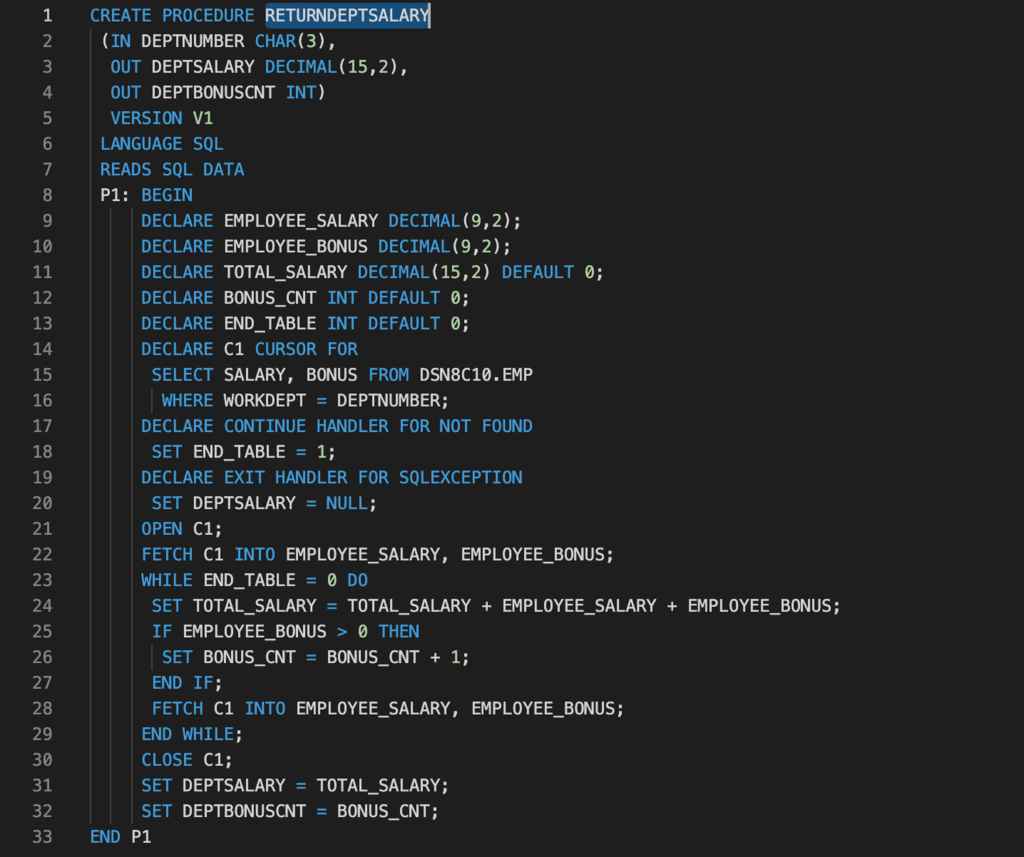
Then, the RETURNBESTDEPTINFO caller stored procedure will pass each department name in this list to the callee stored procedure, RETURNDEPTSALARY (shown in the following figure), in a loop to get the total salary and bonus count of that department. Within the loop, the caller stored procedure will continue to compare the bonus count between each department to determine the department with the highest bonus and return this information to the user.
Unfortunately, the caller stored procedure isn’t working as expected. It always returns blank output values, as shown in the following figure. We need to determine if the code bug is in the caller stored procedure or in the callee stored procedure.
Our first step in debugging these nested stored procedures is to deploy them with ENABLE DEBUGGING turned on. We also need to specify the WLM environment name for debugging. These steps are documented in Deploying, running, and debugging stored procedures.
After the stored procedures are deployed correctly, we start to debug them by clicking Debug Stored Procedure. When the execution cursor is displayed on the first line of the RETURNBESTDEPTINFO caller stored procedure, we set a breakpoint on the line of code that calls the RETURNDEPTSALARY callee stored procedure. Then we either click Continue or we press F5 to continue the execution. When the execution cursor reaches that breakpoint (line 22 in the following figure), execution pauses.
Now we either click Step Into or we press F11, which causes the execution cursor to switch to the RETURNDEPTSALARY callee stored procedure. From within the callee stored procedure, we can check if the variable values are assigned correctly by setting another breakpoint at the end of the callee stored procedure and then clicking Continue to resume execution until that breakpoint is reached, as shown in the following figure:
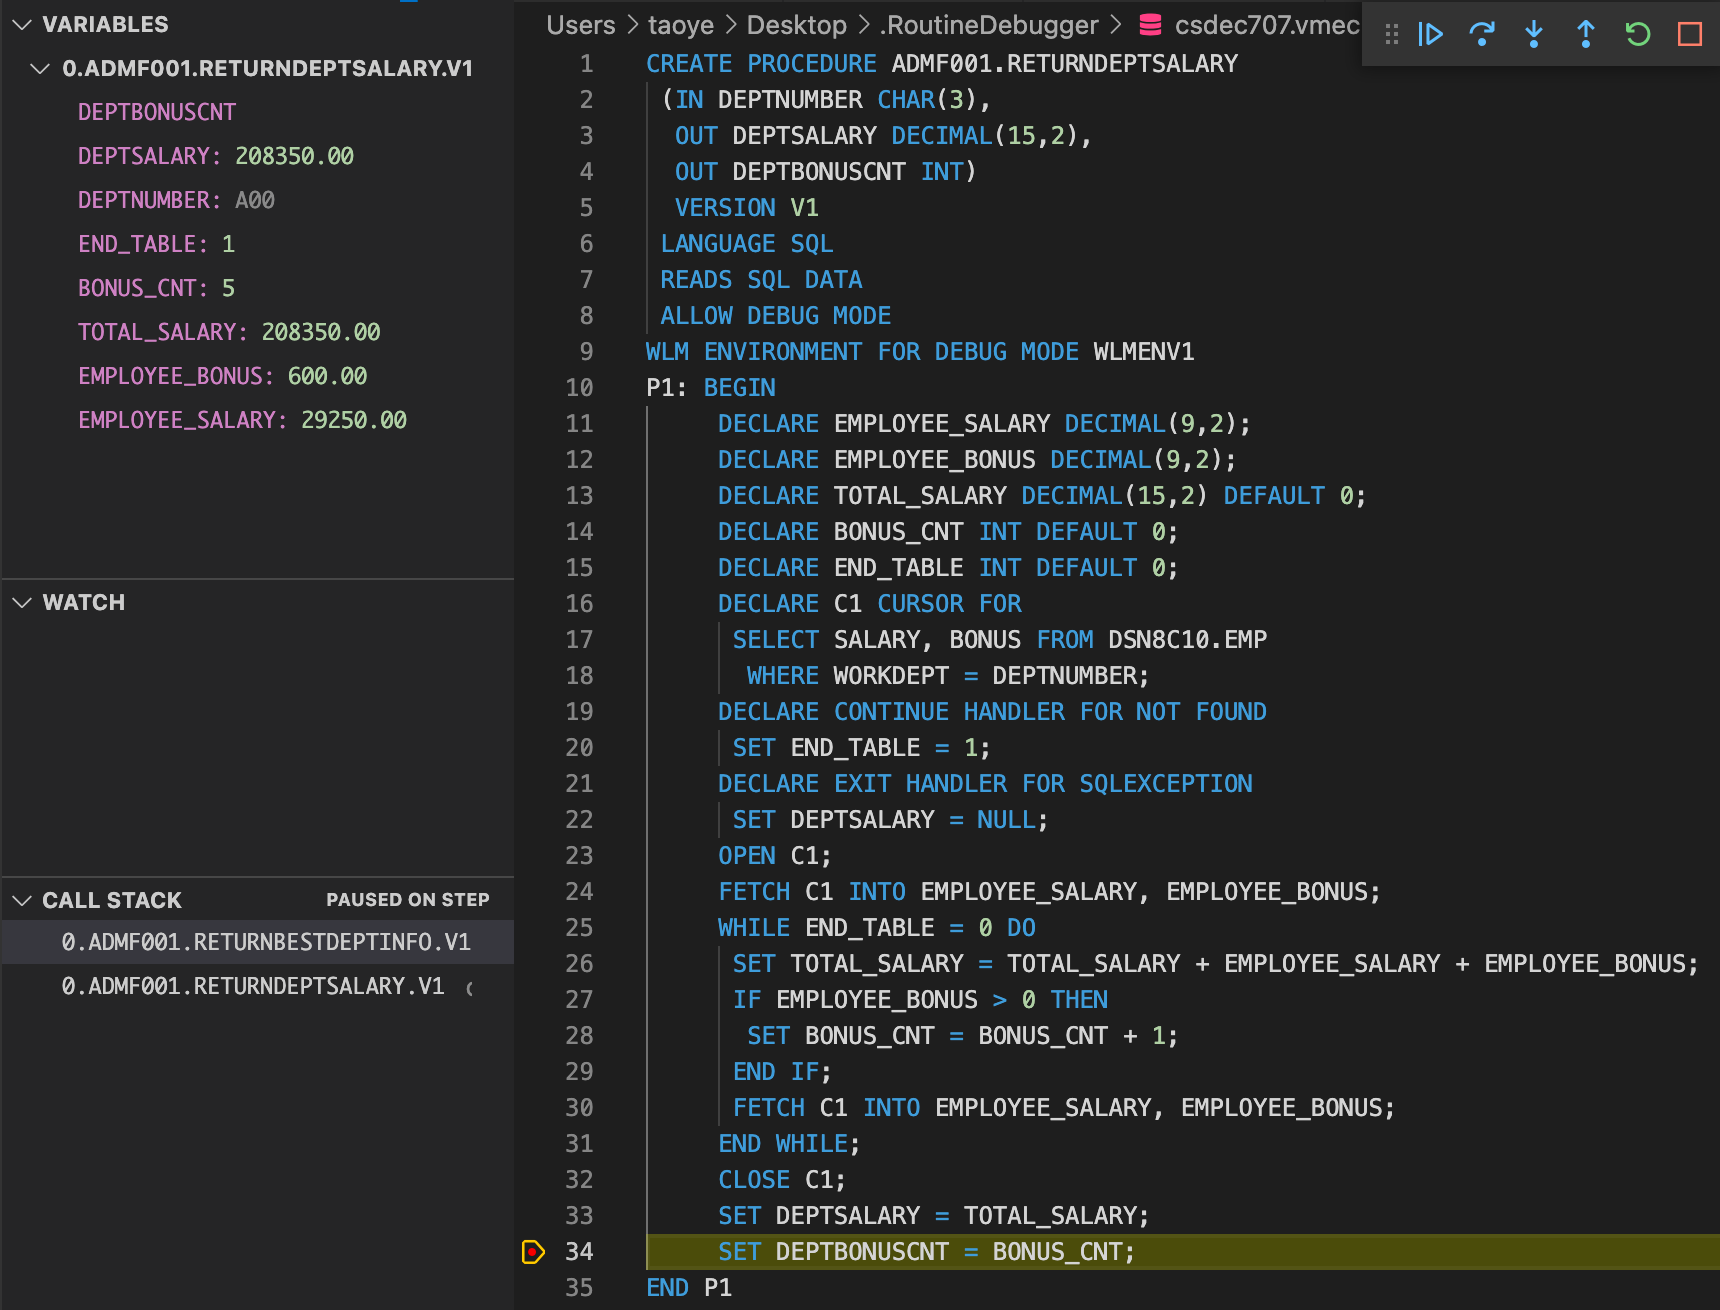
From the CALL STACK view on the left in the previous figure, we can see that we have a call stack structure of two stack frames. The upper one is the the RETURNBESTDEPTINFO caller stored procedure, and the lower one is the RETURNDEPTSALARY callee stored procedure.
From the VARIABLES view, shown in the following figure, we can see that all the variable values have been assigned correctly for department A00. Department A00 has a total salary of 208350.00 and a bonus count of 5, which will be returned to RETURNBESTDEPTINFO for further comparison.
Now let’s click Step Out or press Shift+F11 to return to the RETURNBESTDEPTINFO caller stored procedure. We can see that the CALL STACK view shows only the information of the current stack frame of RETURNBESTDEPTINFO and that the VARIABLES view shows that the information from department A00 has been returned correctly to the caller.
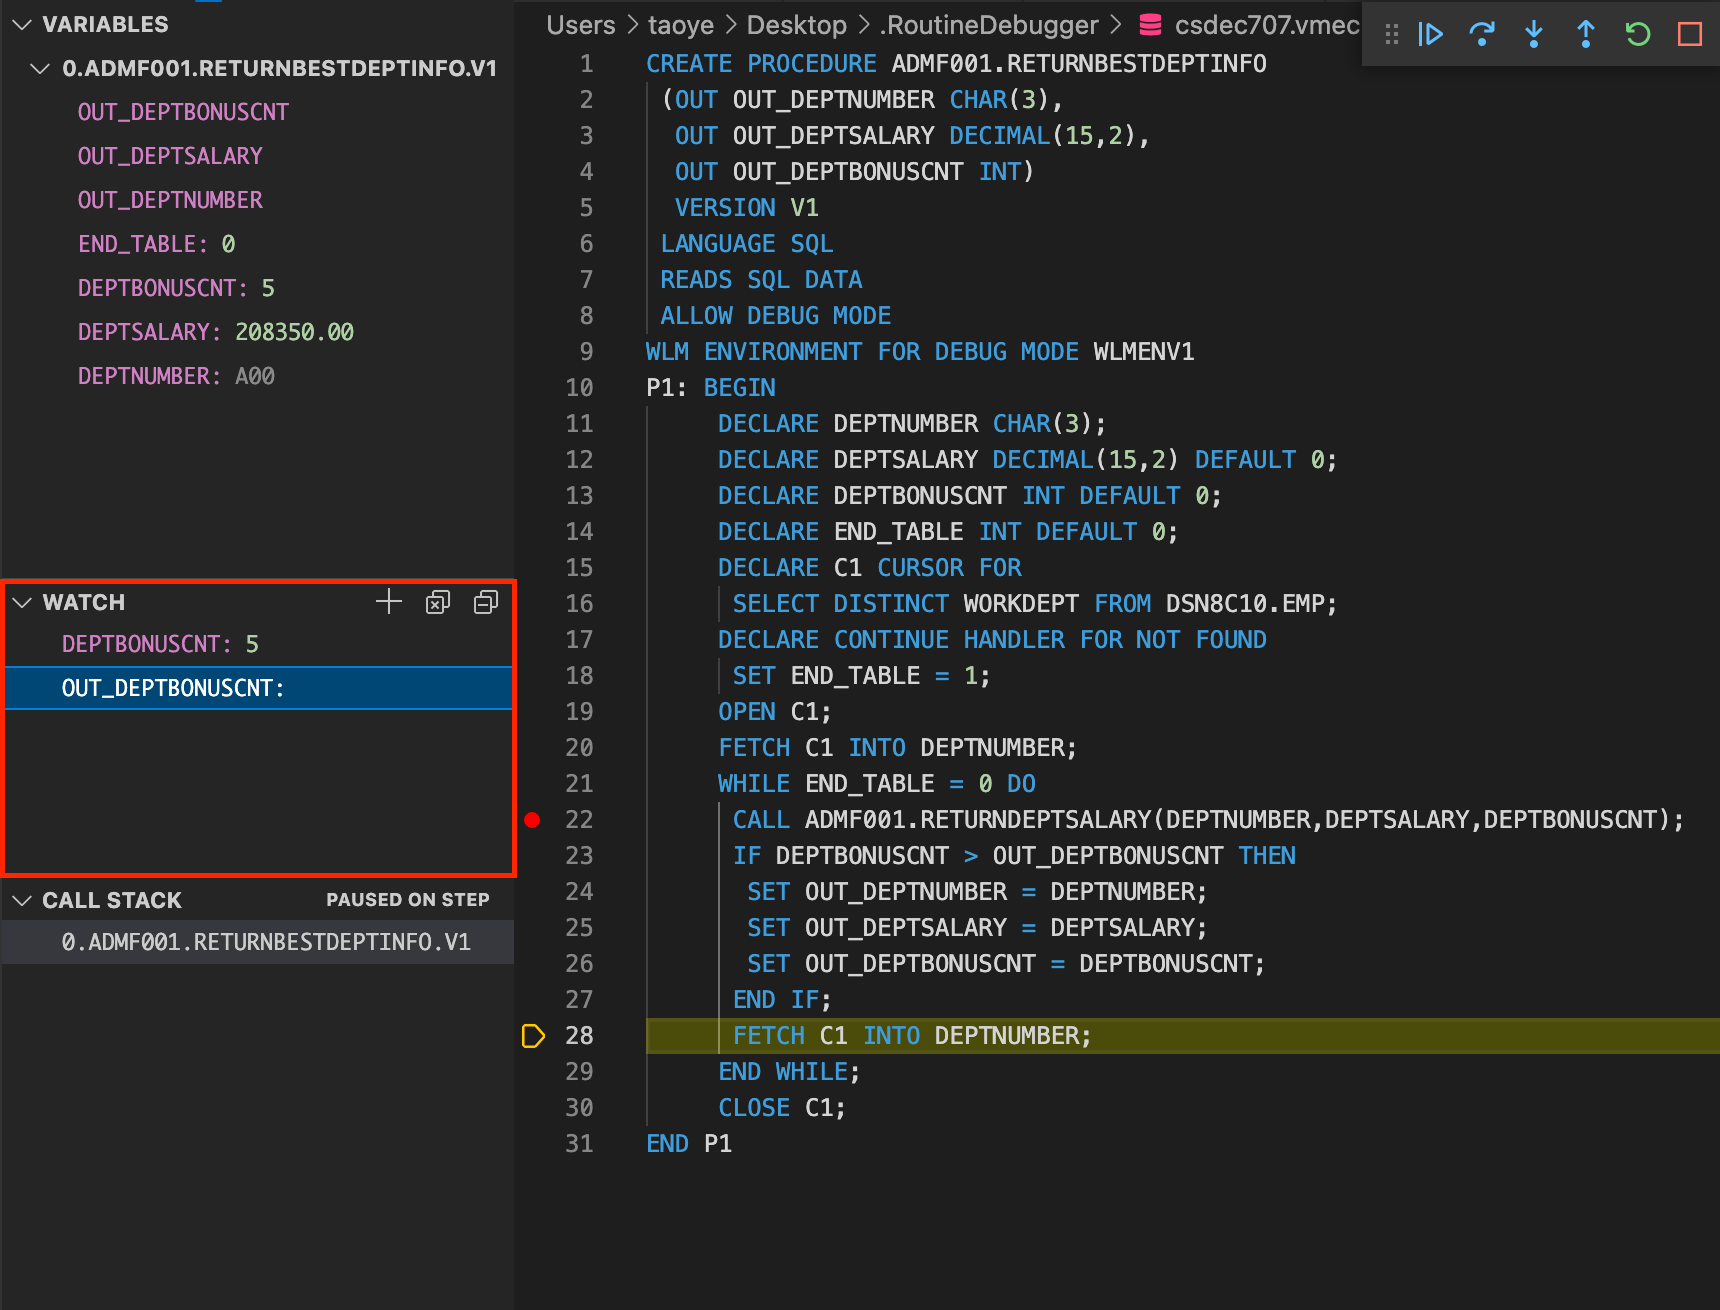
Until now, we might have suspected that the RETURNBESTDEPTINFO stored procedure contains the code bug. A conditional comparison between two variables might provide us with some additional clues. In the stored procedure, we check if DEPTBONUSCNT is greater than OUT_DEPTBONUSCNT. Let’s add these two variables to the WATCH view to see their values.
To add these variables to the WATCH view, double-click on the target variable, right-click it, then select the Add to Watch menu item:
With the two variables added to the WATCH view, as shown in the following figure, after the execution of the IF block completes, we can see that no value is defined for the OUT_DEPTBONUSCNT variable. Because we are comparing OUT_DEPTBONUSCNT with DEPTBONUSCNT, which has an integer value of 5, OUT_DEPBONUSCNT should also have an integer value defined.
We can manually modify the runtime value of the OUT_DEPTBONUSCNT variable in the debug session by double-clicking the value field of this variable in the VARIABLES view. Now we assign it an integer value of 0 for testing. Notice that the value in the WATCH view has been updated to 0.
Let’s resume the execution to see if the code runs with this modification.
Now, all the output variables have been assigned correct values. For now, they’re for department B01. Let’s remove the breakpoint in the loop (it will cause the execution to take longer) and let the stored procedure execute to the end.
Great! The stored procedures are working as designed and are now returning correct values.
By using Db2 Developer Extension’s stored procedure debugger, we were able to quickly determine that a variable initialization was missing for the OUT_DEPTBONUSCNT variable. Without the stored procedure debugger, to locate a code bug in a stored procedure, we would need to update the stored procedure to print more trace data or generate more logs, we would need to execute the stored procedure multiple times to collect the data, and then we would need to to analyze that data, all of which takes a huge amount of time. With the stored procedure debugger, we can develop and maintain stored procedures more quickly and with higher efficiency.
More tips on debugging stored procedures
The following sections contain more information about the process of debugging stored procedures with Db2 Developer Extension.
Required privileges
Make sure that you have the privilege to perform SELECT operations on the SYSIBM.SYSROUTINES Db2 subsystem catalog table. Before you can debug on Db2 for z/OS, you must run the DSNTIJSD job in the prefix.SDSNSAMP data set to set up the environment.
Reloading historical breakpoints
When breakpoints have been set and not removed during a debugging session, the breakpoints will be loaded automatically the next time you debug the same stored procedure.
Error codes and exception handling
When you launch the stored procedure debugger, you might see the following error codes and messages that warn you of various situations that might prevent the debugger from operating properly. Corrective actions are provided with each error code.
-9900 = The Session Manager could not be started.
-9901 = The specified port number is not valid.
-9906 = The specified port is not available.
Verify that the port number assigned for Debug Session Manager is available and has not been assigned to other applications.
-9904 = The stored procedure DBG_PINGSESSIONMANAGER could not be started on the server.
This stored procedure is created during Db2 subsystem installation and is invoked to check the connection between the debug client and server. If it is not working, contact your system administrator.
-9905 = The Session Manager could not be reached by a ping from the server.
A valid connection has been lost between your client and the Db2 server. Attempt to reconnect.
-9908 = The routine is not enabled for debugging.
Either add the ALLOW DEBUG MODE and WLM ENVIRONMENT FOR DEBUG MODE wlm_name clause to the CREATE STORED PROCEDURE statement, or turn on the Enable debugging option of Routine options and set the WLM environment when you deploy the stored procedure that you want to debug.
-9910 = The JCC driver could not be loaded.
The JDBC connection cannot be established between client and Db2 server.
-440 = The debugging routines were not found.
The stored procedure that is being debugged has not been deployed on the Db2 server yet. Check the stored procedure name, schema, and path setting.
To obtain detailed information about errors that occurred with the extension:
- Turn on extension logging by setting Db2forzosdeveloperextension > Debug : Log Level to be any value other than ‘off’.
- Issue the ‘open extension logs folder’ command in the Command Palette to display the log files folder.