Program Control Flow Browser
The Program Control Flow Browser provides an interactive graph that visualizes the control flow of COBOL and PL/I programs. This is an advanced capability available with an active license.
Opening the Program Control Flow Browser
To open a program in the Program Control Flow Browser, it must first be successfully parsed by the language servers. This requires the program to be free of critical syntax errors and for all referenced copybooks, include files, or macro libraries to be resolved. Any issues that hinder parsing appear in the Problems view within VS Code, where users can identify and address them. If the program fails to parse or remains in the parsing stage, attempts to open it in the Program Control Flow Browser triggers an error message.
The Program Control Flow Browser can be opened in the following ways:
Cmd ⌘/Ctrl+Shift+Pto open the command palette and run the command>IBM Z Open Editor: Show in Program Control Flowwhile viewing a COBOL or PL/I program.- Right-click within a COBOL or PL/I program and select Show In > Program Control Flow.
Either method is available for local programs or for remote programs accessed through Zowe Explorer or the z/OS Resources Table. The view opens in the VS Code panel by default but can be repositioned to other areas of the editor if required. The view cannot be opened for a copybook, include file, or macro library.
For COBOL source files that contain multiple top-level programs, the Program Control Flow Browser displays the control flow for the program at the current cursor position. To view the control flow of another program within the same file, place the cursor in that program and run the Show In Program Control Flow command using either the command palette or the Show In menu.
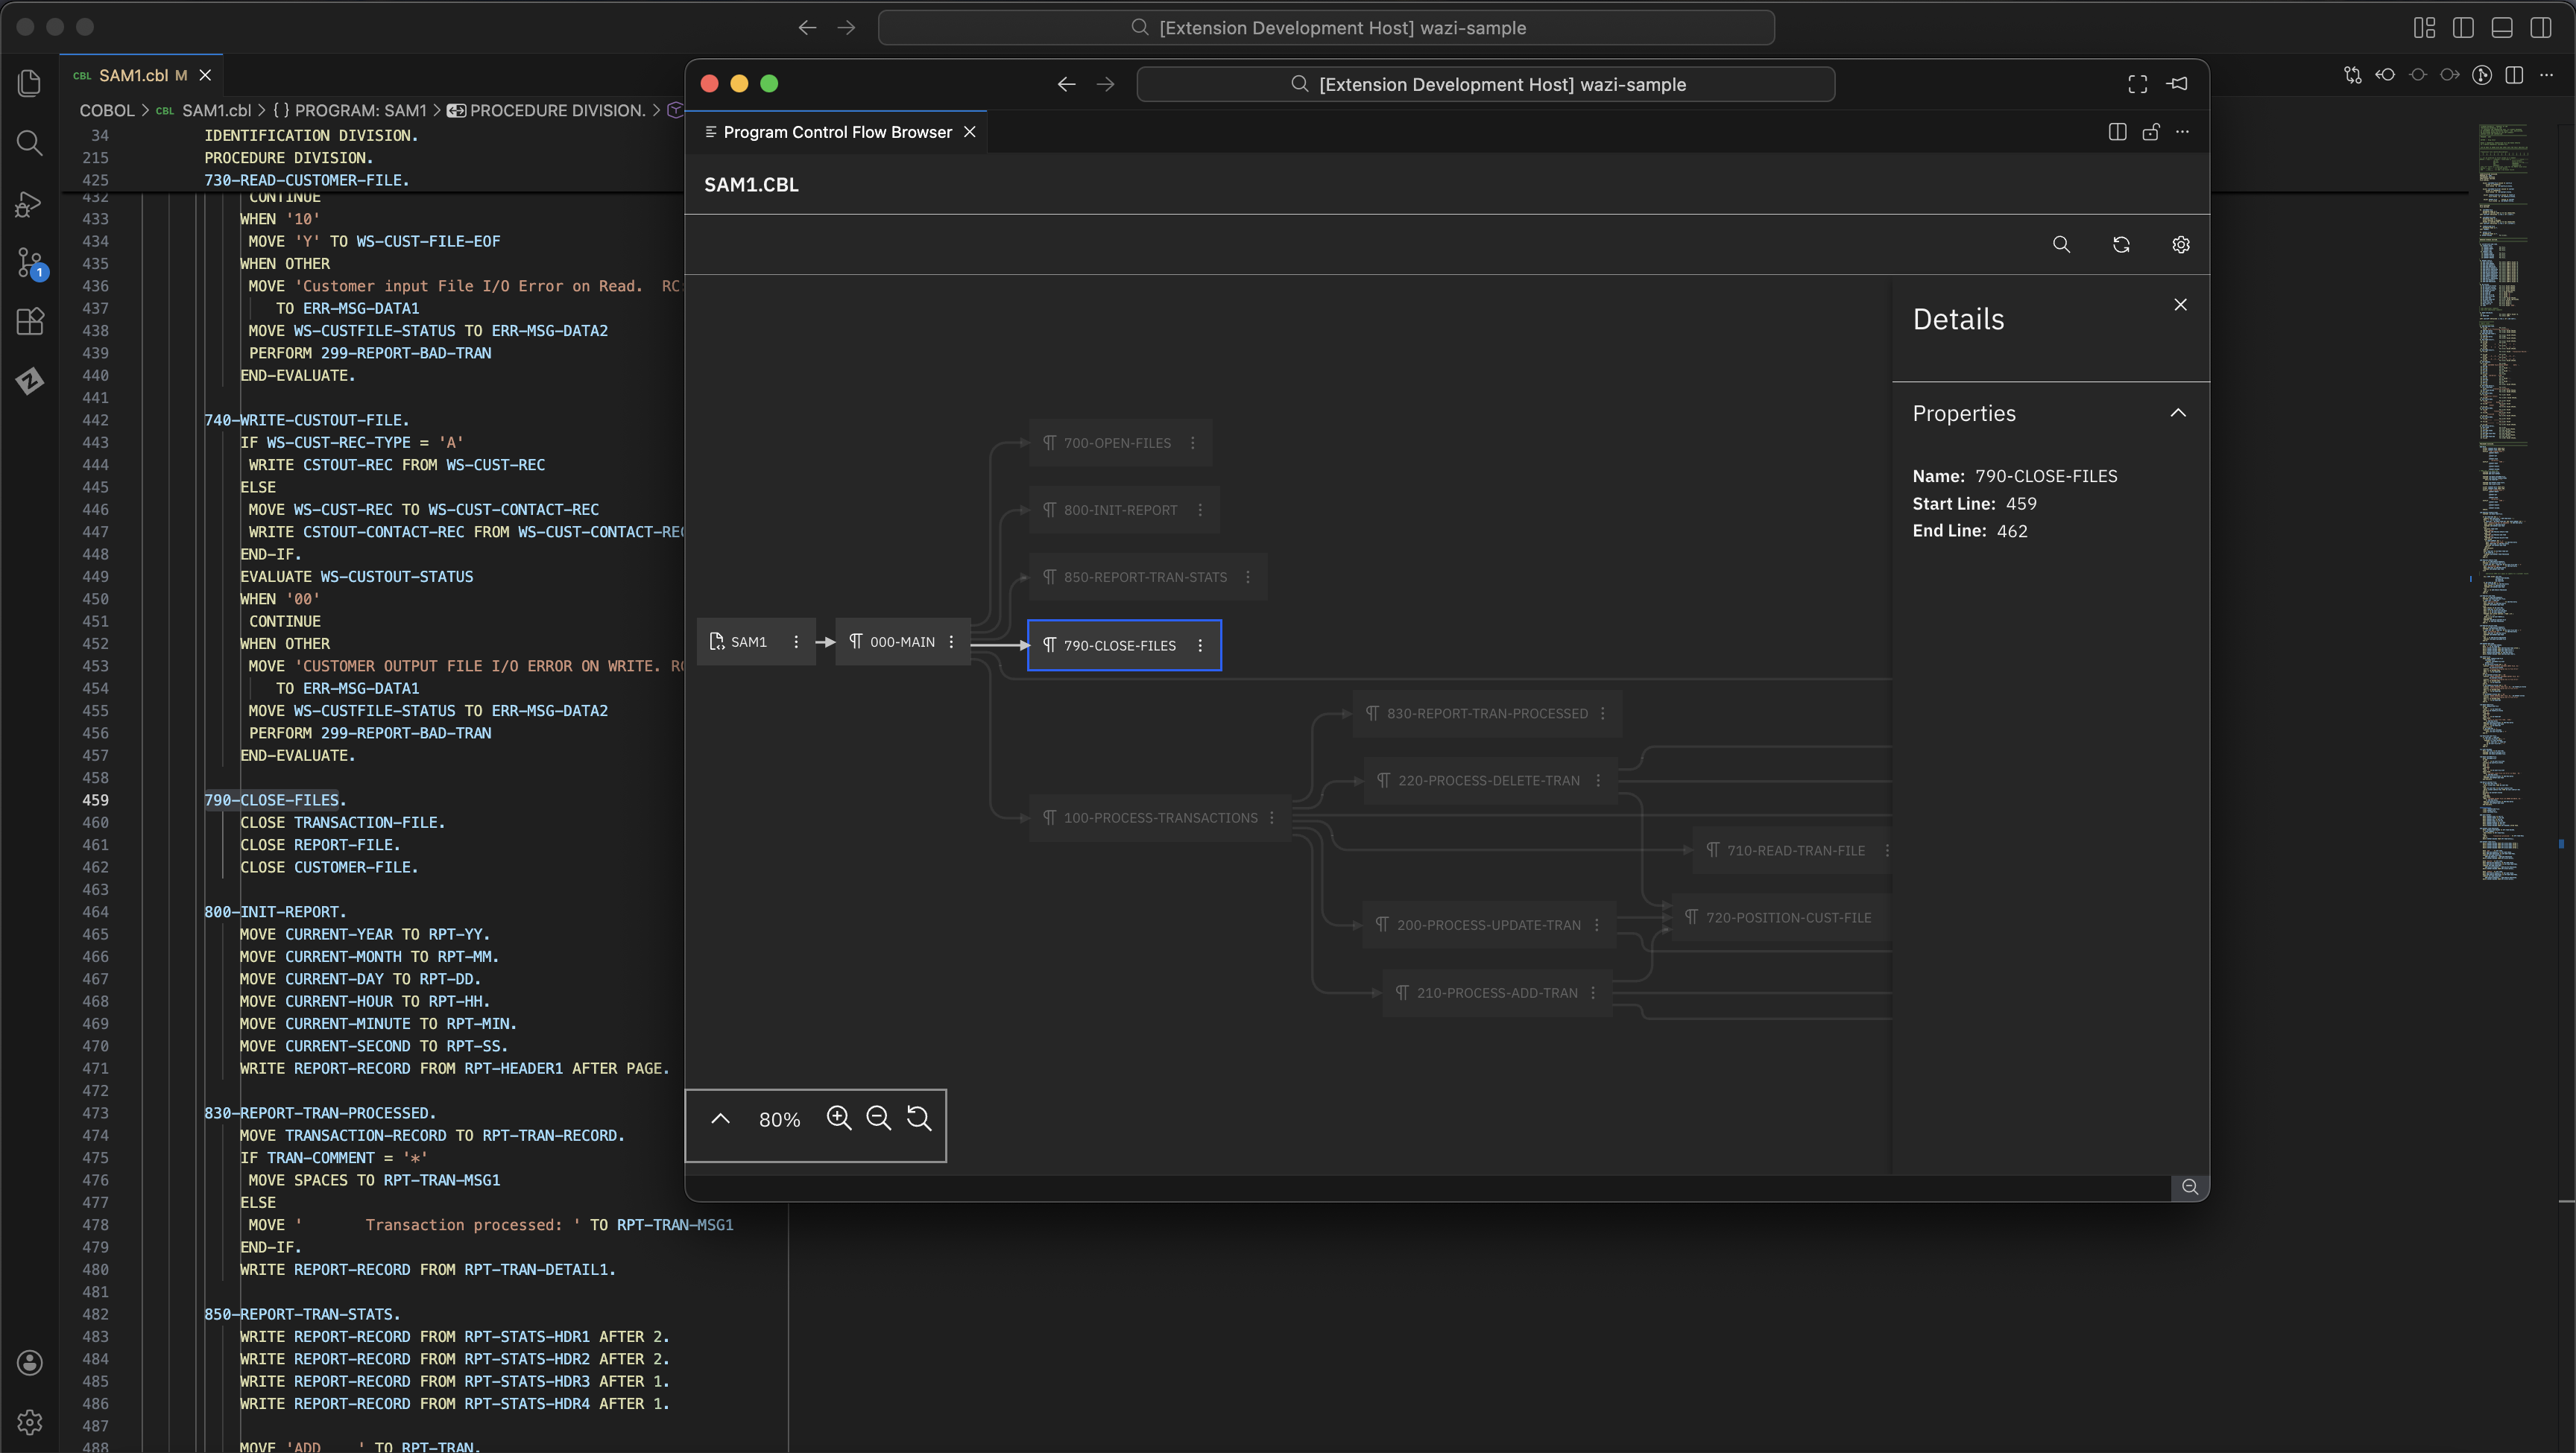
When a PL/I or COBOL program is displayed in the Program Control Flow Browser, the node corresponding to the element at the current cursor position is automatically highlighted in blue.
Navigation
The graph in the Program Control Flow Browser can be navigated by scrolling horizontally and vertically, or by using arrow keys to move the view in any direction.
Zooming is controlled through a set of buttons located in the bottom-left corner of the graph. These buttons allow zooming in and out of the graph, and a reset button on the far right sets the zoom level to 100%, returning the graph to its default scale.
A caret icon to the left of the zoom controls toggles the visibility of the minimap, which starts collapsed by default. When expanded, the minimap displays a scaled-down overview of the entire graph, and clicking within it repositions the main graph view to the selected location.
Actions
Each node in the Program Control Flow Browser represents a different program element, depending on the language:
- COBOL programs: Nodes represent paragraphs, sections, or the procedure division
- PL/I programs: Nodes represent procedures, package, or the program setup
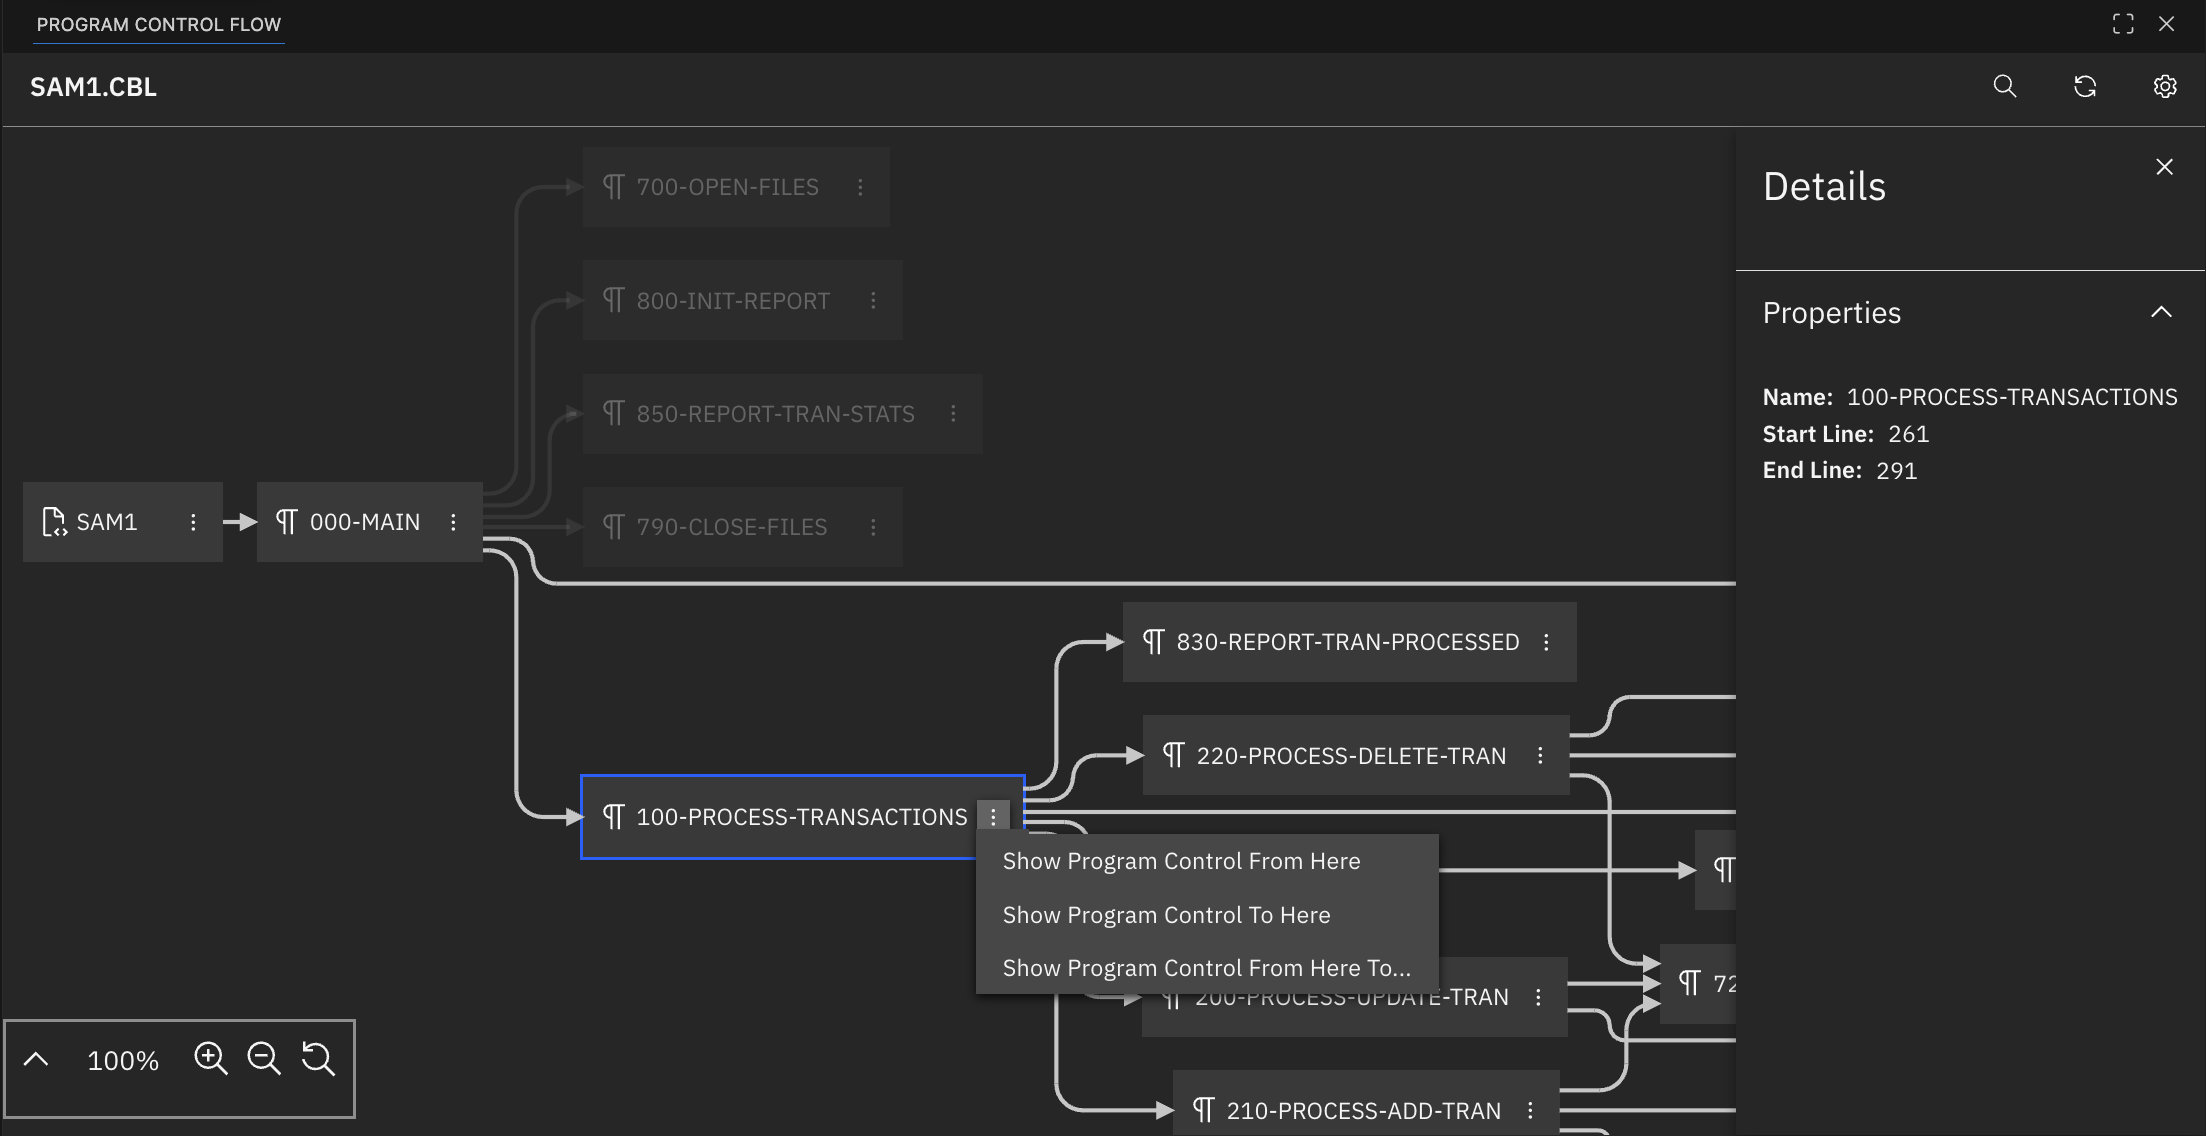
Clicking a node highlights the corresponding element in the source code and opens a details panel showing the full name of the element (or the program name, if the Program node is selected), along with its start and end line numbers in the program.
When a node is clicked, the graph automatically focuses on control flow paths that might transfer control to or from the selected node, while unrelated nodes become slightly transparent.
The following actions are available through the overflow menu (three vertical dots) in the top-right of each node:
Show Program Control From Here: Displays a graph showing all control flow paths that originate from the selected node. This helps visualize how control progresses through the program from that point.
Show Program Control To Here: Displays a graph showing all control flow paths that lead to the selected node. This helps identify potential entry points or calling paths that reach the selected code.
Show Program Control From Here To...: First, the user is prompted to select a node reachable through control flow from the current node. After selecting an end node, this action displays a graph showing all control flow paths from the start node to the selected node. This helps in understanding the scope and control flow between different parts of a program.
A Reload button is available in the top-right corner of the browser. Clicking this button regenerates the graph for the currently opened COBOL or PL/I program, incorporating any recent edits to the source code. For files that contain multiple top-level programs, the Reload button regenerates the graph based on the program at the current cursor position. If a previous actions was applied, using Reload resets the graph to its default state and displays all nodes.
Search
The Program Control Flow Browser provides search capabilities to help locate specific nodes in large graphs.
Click the magnifying glass icon to expand the search input field. A search starts automatically as you enter text. After it completes, a match counter becomes visible that displays the current match index out of the total results. Press Enter/Shift+Enter or use the arrow controls to cycle through matching nodes. To clear the search, click the “×” icon on the right side of the input field.
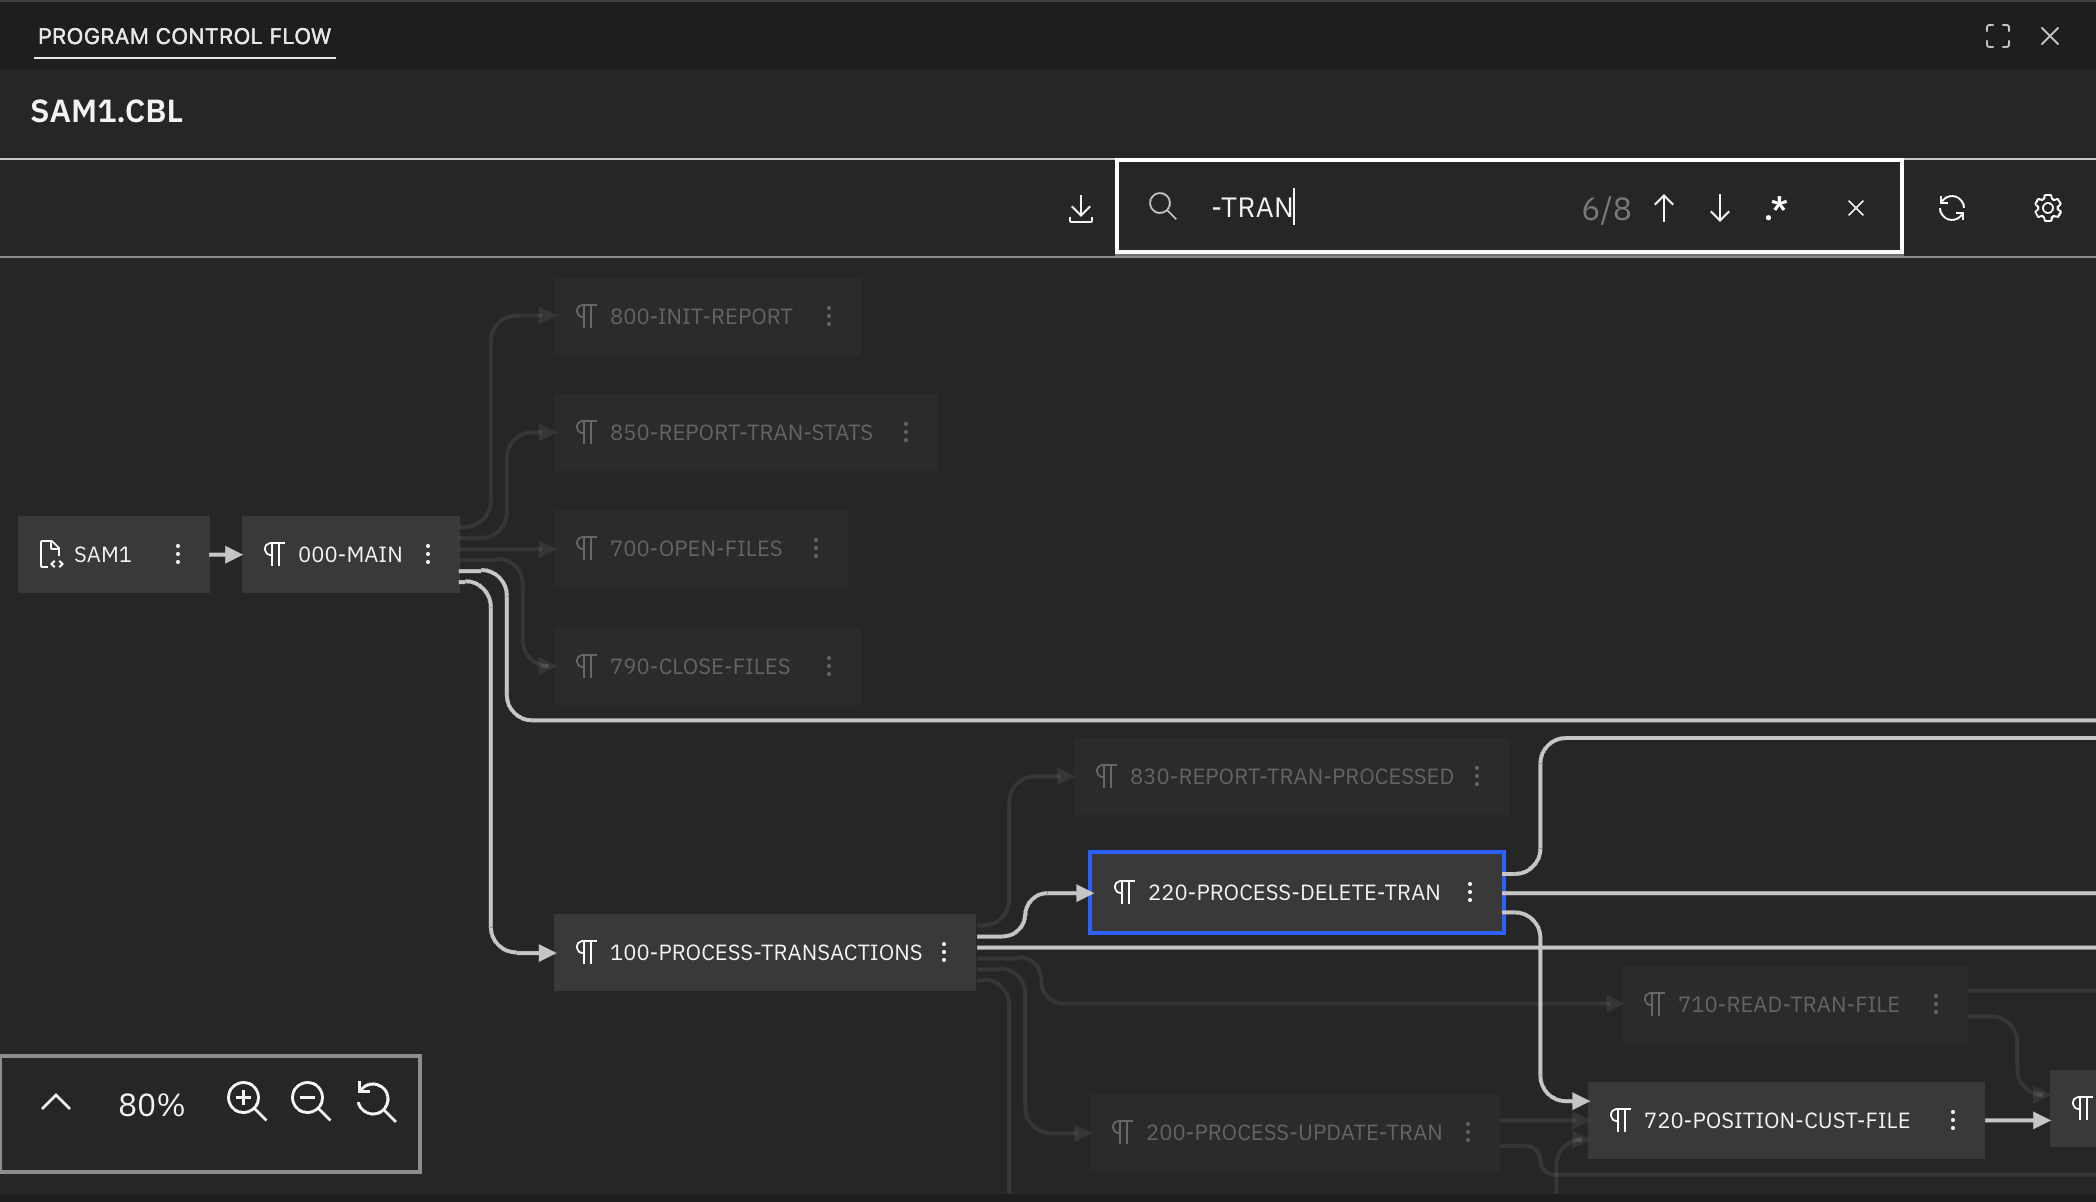
You can search for nodes using regular expressions by enabling the Use Regular Expression toggle. This toggle appears after you expand the search input field and is enabled by clicking on it. When the toggle is enabled, the search input is interpreted as a regular expression pattern. Patterns must follow JavaScript regex syntax, including proper character escaping. Enter the pattern without enclosing it in forward slashes. Matching is case-insensitive, and other regular expression flags are not supported. An error message appears below the search bar for invalid regular expressions.
Export
The Program Control Flow Browser includes an export feature that enables you to save the current graph in various formats. The export action is located in the top-right of the toolbar, to the left of the search bar.
To export a graph:
- Click the Export button in the toolbar
- Select one of the available export formats from the dropdown: JSON, PDF, SVG, PNG, XML, or DOT (for GraphViz)
- Enter a name for the exported file in the input field
- Click Export
- When the export is ready, a file dialog appears where you can choose the save location
The export always includes the full graph as currently displayed. To export a specific section of the Program Control Flow graph, use one of the "Show Program Control" actions (such as Show Program Control From Here or Show Program Control To Here) to limit the graph's scope before exporting. If you have selected a node, nodes that do not share flow with the selected node become slightly transparent, the those transparent styles are preserved in the exported output. The colors in the exported file match your current VS Code theme (light or dark).
For large graphs, visual exports (PDF, SVG, PNG) can take a significant amount of time to generate.
Settings
The Program Control Flow Browser includes a settings menu for customization. Currently, the only available setting is View Location, which lets you choose whether the browser appears in the VS Code Panel (default) or in a separate editor tab. Your selection is saved across sessions.
MCP tool
If you want to analyze program structure with AI assistance, you can use the control flow MCP tools described in IBM Z Open Editor MCP Tools. The available tools are zopeneditor-cobol-get-program-control-flow for COBOL programs and zopeneditor-pli-get-program-control-flow for PL/I programs.