Data Flow Browser
The Data Flow Browser provides a graphical and hierarchical view of the data flow within a COBOL program. You can use this feature to examine how a data element is populated, modified, or written elsewhere. This is an advanced capability available with an active license.
Opening the Data Flow Browser
To open a program in the Data Flow Flow Browser, it must first be successfully parsed by the language servers. This requires the program to be free of critical syntax errors and for all referenced copybooks or include files to be properly resolved. Any issues that impede parsing are reported in the Problems view within VS Code, where users can identify and address them. If a program cannot be parsed, or is still in the parsing stage, any effort to open it in the Data Flow Browser results in an error message.
To open the Data Flow Browser:
- Open a COBOL program file in Z Open Editor
- Select or place your cursor with a data element in the program (such as a variable name, field, or data item)
- Right-click and choose Show In > Data Flow from the context menu
This feature is available for both local programs and remote programs accessed through Zowe Explorer or the z/OS Resources Table. By default, the view opens in the VS Code panel but can be repositioned to other areas of the editor if required. The selected data element must be present in the source program, not defined in a copybook. The Data Flow Browser cannot open directly from data elements in a copybook. However, these elements can still appear in the graph if they participate in the flow.
Navigation
You can navigate the graph in the Data Flow Browser by scrolling horizontally and vertically, or by using arrow keys to move the view in any direction.
Zooming is controlled through a set of buttons located in the lower-left corner of the graph. You can use these buttons to zoom in and out, and a reset button on the far right sets the zoom level to 100%, returning the graph to its default scale.
A caret icon to the left of the zoom controls toggles the visibility of the minimap, which is collapsed by default. When expanded, the minimap displays a scaled-down overview of the entire graph. Clicking within the minimap repositions the main graph view to the selected location.
Understanding Data Flow Graphs
The graph in the Data Flow Browser consists of nodes and edges. Each node represents a data element, file, or literal that is connected in some way to the data element selected for the data flow. Each node includes a label and a type. Types are indicated by distinct icons and displayed in bold text, while labels correspond to the name of the element represented by the node.
The graph includes the following node types:
- Data: Regular data items and variables
- File: File descriptors and file-related elements
- Structure: Group items and record structures
- Entry point: Alternate entry points where data flow begins
- Data store: Data storage elements
- Literal: Literal values and constants
There are two styles of edges: solid and dashed.
- Solid: Solid edges represent the statement or statements that cause data to flow to or from the target element. When data flows to the target element, the edge's arrow points toward it. When data flows from the target element, the arrow points away.
- Dashed: When an element is a group element, data flowing to or from that element also affects the values of its members. Likewise, when an element is a member of a group, data flowing to or from that element also affects the value of the group. This hierarchical relationship between a group and its members is represented by a dashed edge.
Hovering over either type of edge displays a tooltip with relevant information. The tooltip a solid edge contains the line number and statement responsible for data flow between the two nodes. The tooltip for a dashed edge contains the relevant data definition.
Clicking an edge opens the COBOL source code at a relevant location:
- Solid edge: Opens the source at the statement that modifies or transfers the data between the connected nodes.
- Dashed edge: Opens the source at the group's declaration, showing the hierarchical relationship between the group and its members.
Actions
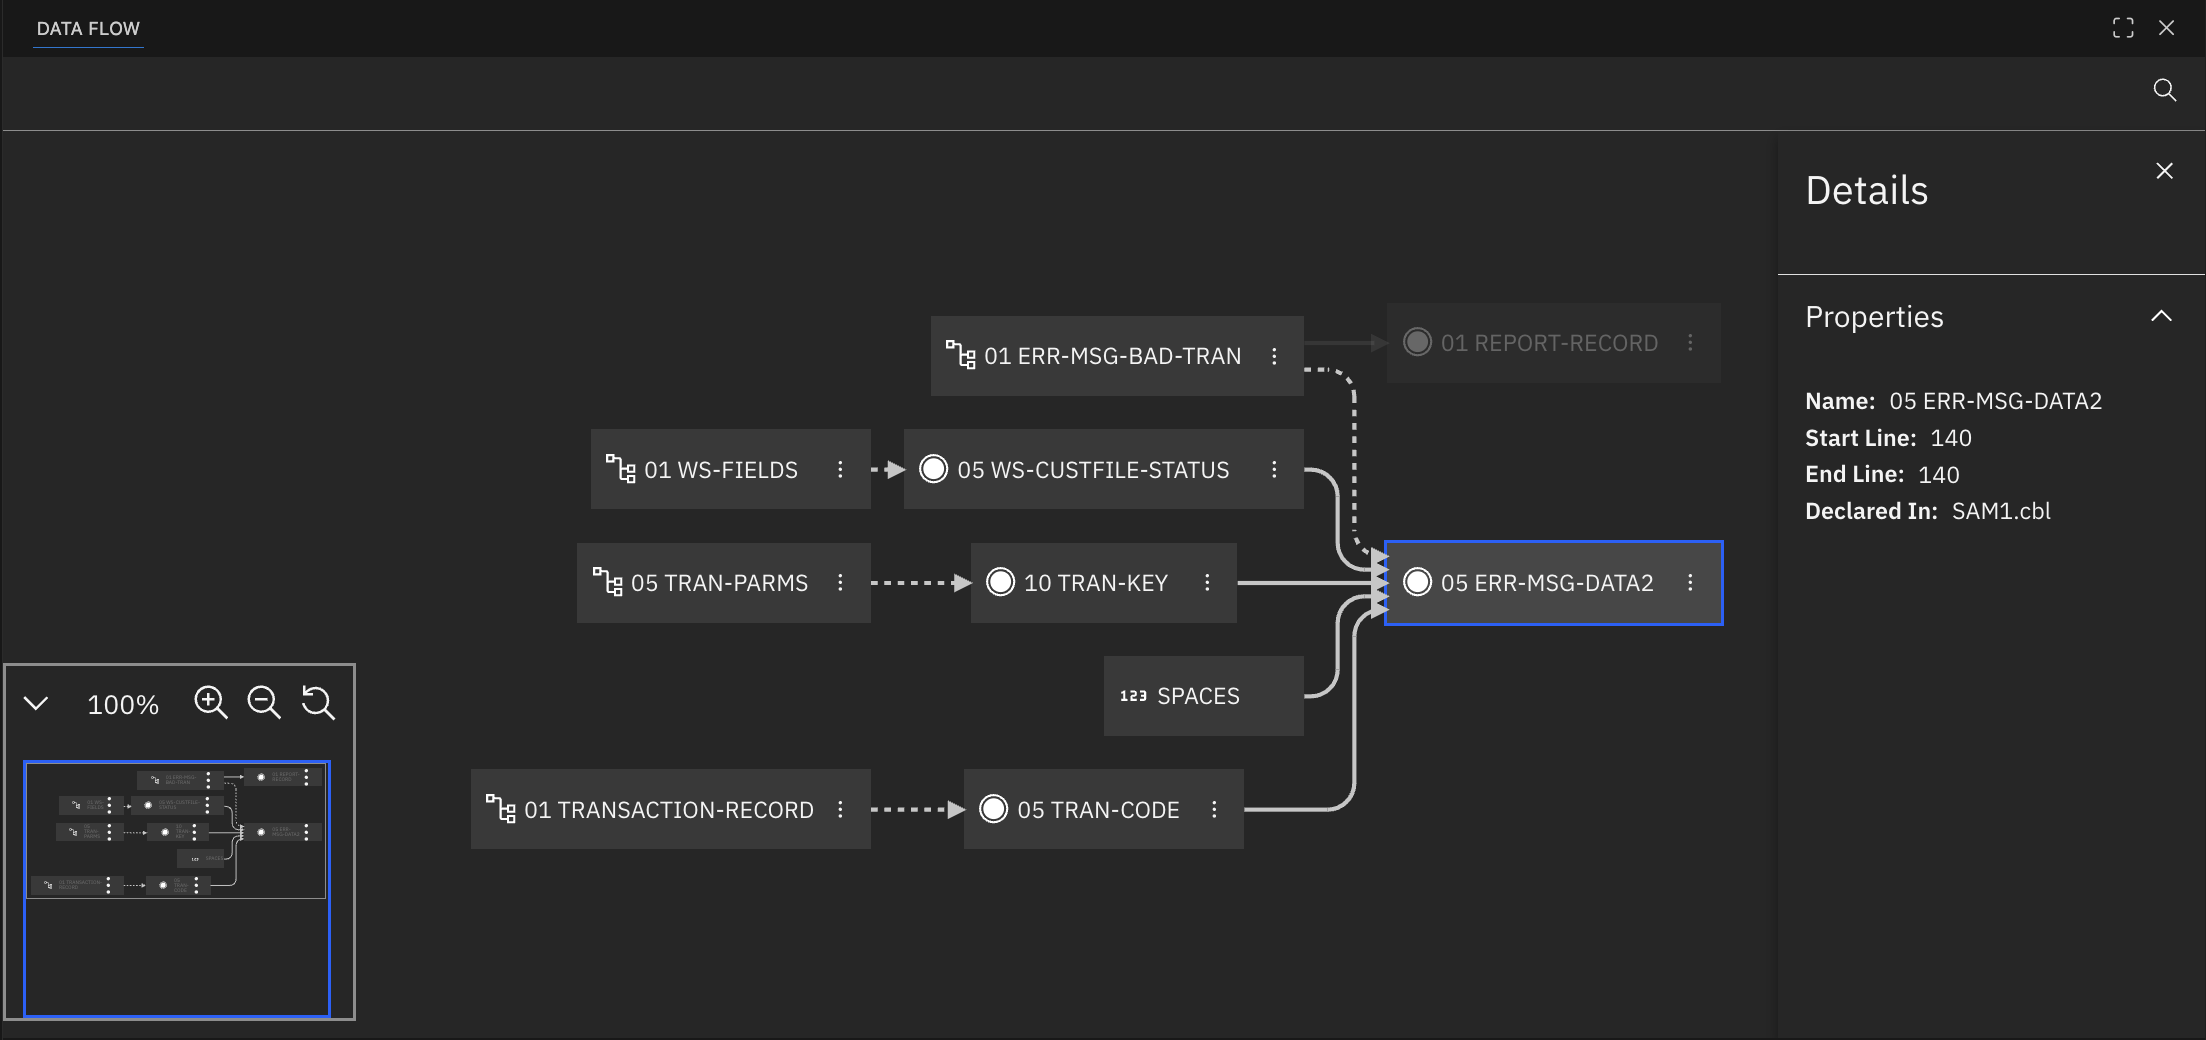
Clicking a node in the Data Flow Browser highlights the corresponding element in the source code and opens a details panel showing the full name of the data element, its start and end line numbers, and the file in which it was declared. When a node is clicked, the graph automatically focuses on data flow paths that can transfer data to or from the selected node, while unrelated nodes become slightly transparent.
For Data and Structure nodes, a Show Data Flow for this Node action is available through the overflow menu (three vertical dots) in the upper-right of the node. Selecting this action displays the data flow for the node.
Search
The Data Flow Browser provides search capabilities to help locate specific nodes in large graphs.
Click the magnifying glass icon to expand the search input field. A search starts automatically as you enter text. After it completes, a match counter becomes visible that displays the current match index out of the total results. Press Enter/Shift+Enter or use the arrow controls to cycle through matching nodes. To clear the search, click the “×” icon on the right side of the input field.
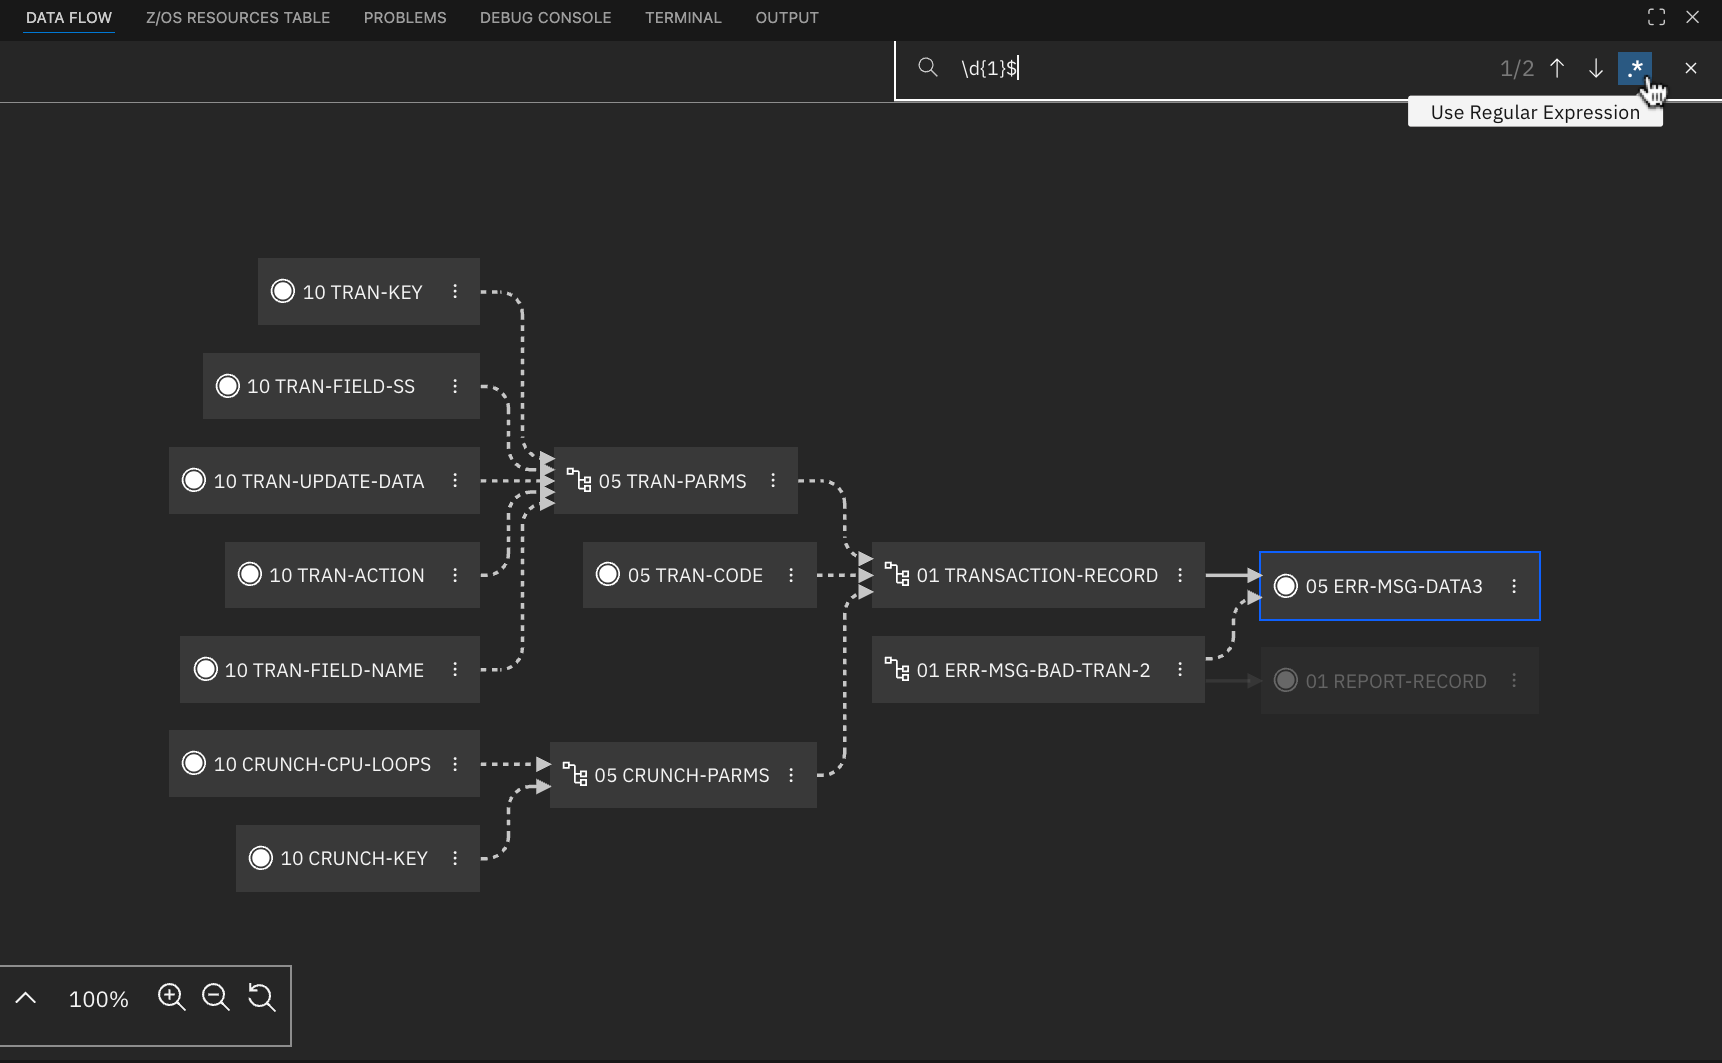
You can search for nodes using regular expressions by enabling the Use Regular Expression toggle. This toggle appears after you expand the search input field and is enabled by clicking on it. When the toggle is enabled, the search input is interpreted as a regular expression pattern. Patterns must follow JavaScript regex syntax, including proper character escaping. Enter the pattern without enclosing it in forward slashes. Matching is case-insensitive, and other regular expression flags are not supported. An error message appears below the search bar for invalid regular expressions.
Export
The Data Flow Browser includes an export feature that enables you to save the current graph in various formats. The export action is located in the top-right of the toolbar, to the left of the search bar.
To export a graph:
- Click the Export button in the toolbar
- Select one of the available export formats from the dropdown: JSON, PDF, SVG, PNG, XML, or DOT (for GraphViz)
- Enter a name for the exported file in the input field
- Click Export
- When the export is ready, a file dialog appears where you can choose the save location
The export always includes the full graph as currently displayed. If you select a node, nodes that do not share flow with the selected node become slightly transparent, and those transparent styles are preserved in the exported output. The colors in the exported file match your current VS Code theme (light or dark).
For large graphs, visual exports (PDF, SVG, PNG) can take a significant amount of time to generate.
Limitations
- Data flow analysis supports COBOL programs only; PL/I is not supported
- It supports base COBOL language elements and some embedded languages, such as CICS and SQL; however, DLI is not supported
MCP tool
If you want to analyze data usage with AI assistance, you can use the data flow MCP tool described in IBM Z Open Editor MCP Tools. The available tool is zopeneditor-cobol-get-data-flow for COBOL programs.